


halbergman/E+ via Getty Images
Highwoods Properties, Inc. (NYSE:HIW) is an office-focused real estate investment trust (“REIT”) that operates in the best business districts (“BBDs”) in the United States. These include key markets, such as Raleigh, Nashville, and Atlanta. Collectively the three markets represented over 60% of the company’s total net operating income (“NOI”) for the three months ended September 30, 2022.
Following a solid earnings release, investors still appear to be unsold on the stock. Seeking Alpha’s (“SA”) Quant Rating currently assigns shares a hold rating, with favorable grades on valuation and profitability, offset by lagging grades on growth and momentum.
While HIW is more favorably rated by both Wall Street and SA authors, with a buy rating from both groups, the number of analysts covering emerging developments in the company is limited.
The lack of investor interest is surprising. Currently, shares are down nearly 40% YTD and are still trading near the bottom end of their 52-week range. Their forward pricing multiple of 7.1x is also meaningfully below historical and sector averages. In addition, their dividend payout is currently yielding about 7% and has been growing at a respectable 5-YR compound growth rate, supported in part by steadily improving portfolio metrics and their strong liquidity position. At its lows with an implied cap rate disconnected with its fundamentals, HIW is one that could provide significant long-term returns to any diversified portfolio.
HIW’s Current Portfolio Metrics
Overall occupancy at the end of September 30, 2022, stood at 90.7%. This is up about 10 basis points (“bps”) from the second quarter and 30bps from the same period last year. It is down, however, from the approximately 91% rate reported at the end of 2021 and the 1st quarter of the year due primarily to their active development pipeline, totaling half a billion in current investment with just less than half a billion more remaining to fund.
In total, their in-process projects were 22% pre-leased, while their completed projects were 92.5% pre-leased. These completed projects, however, are not yet stabilized, with physical occupancy rates at just 59.2% at quarter end. Overall, at stabilization, this pipeline is expected to result in +$36M in incremental NOI. But until then, the projects are likely to continue weighing on occupancy.
Compared to the pre-pandemic benchmark at the end of 2019, current occupancy levels aren’t too far off levels reported then, down just 150bps. And for seven quarters in a row, the company has experienced strong demand for their properties, with only two quarters of below-average new leasing, which came in early 2020. Overall, occupancy has increased 40bps over these seven quarters, with new tenants generally offsetting those who downsize for more hybrid working arrangements.
In addition, total leasing activity has averaged over 320K square feet (“SF”) during these seven prior quarters. This is 16% above their 10-year average. Importantly, net effective rents (“NER”) have trended 1.5% higher than both 2018 and 2019 levels.
And in the current quarter, the company leased over 1M SF of space, over 500K SF of which was attributable to new signings. This is well above prior quarter leasing levels and the highest activity since 2014.
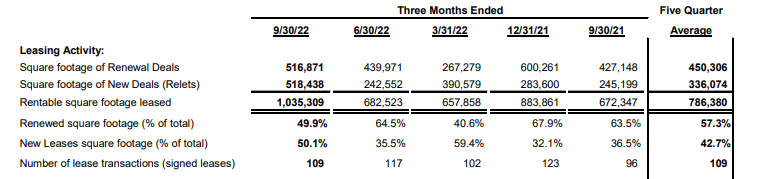
Q3FY22 Investor Supplement – Summary Of Leasing Activity By Quarter
Furthermore, these signings came with weighted average lease terms (“WALTs”) of 7.4 years, which is 1.5 years more than both their five quarter and ten-year averages. These also were done with favorable economics, with NERs 22% above their five quarter averages.
Cash spreads, however, continue to be flat at about 0.3% following just 0.5% growth in Q2. This is in stark contrast to another Sunbelt-focused REIT, Piedmont Office Realty Trust (PDM), who recently reported nearly double-digit cash roll-ups when excluding the effects of one significant renewal.
While HIW’s roll-up performance seems significantly weaker, it’s worth nothing that PDM has no active developments. This produces more parity between cash/GAAP spreads. Overall spreads for PDM on a cash and GAAP basis, for example, were 33% and 38%, respectively. Whereas, for HIW it came in at 0.3% and 13.4%, respectively, owing in part to ongoing lease-ups on active developments. In later periods, the straight-line effect should begin to have a lesser impact as cash receipts eventually catch up.
HIW’s Liquidity Profile And Debt Composition
Through three quarters of the year, the balance sheet continues to remain conservative and flexible, with ample liquidity to fund both their reoccurring obligations and their growth ambitions. As of Mid-October, the company had over +$600M in total liquidity, comprised of availability on their revolving credit facility and cash on hand.
As a multiple of adjusted EBITDAre, net debt stood at 5.60x, which is up slightly but generally consistent with prior quarters. Overall, their total debt capitalization is just above 40%, with over 90% of it unsecured, which is a credit positive. In addition, about 85% of their debt holdings were fixed rate. This minimizes their exposure to interest-rate volatility, especially in the current market environment.
Looking ahead, they have an accommodative debt ladder, with a weighted average maturity of 6.1 years. At their filing date, they did have one maturity at the beginning of 2023. But that has since been prepaid without penalty via proceeds from a new +$200M unsecured-term loan, which matures in October of 2025. As a result of the prepayment, the company has no maturities until late 2025 at the earliest.
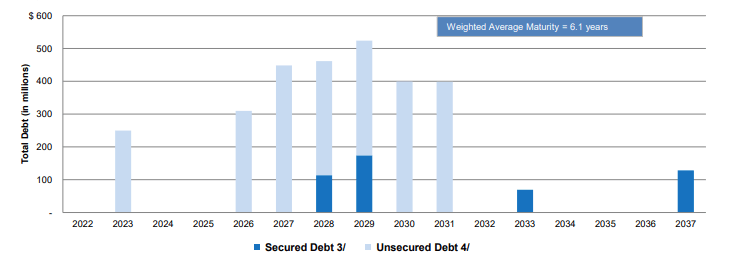
Q3FY22 Investor Supplement – Debt Maturity Schedule
HIW’s Dividend Safety
Currently, shares offer a quarterly dividend payout of $0.50/share, which represents an annualized yield of just over 7% at current pricing. As an additional bonus to shareholders, the payout has steadily grown over the past several years, which is a rarity among many in the pure-play office sector.
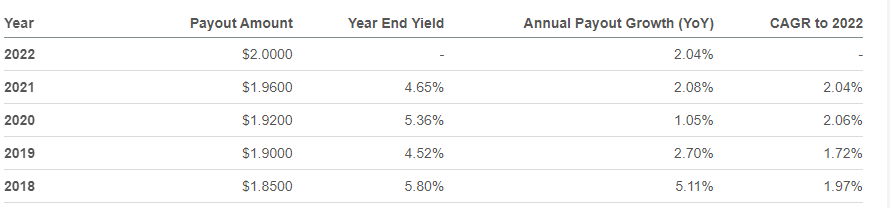
Seeking Alpha – HIW’s Dividend Growth History
While the quarterly payout has remained fixed at $0.50/share for over a year, there is room for further growth.
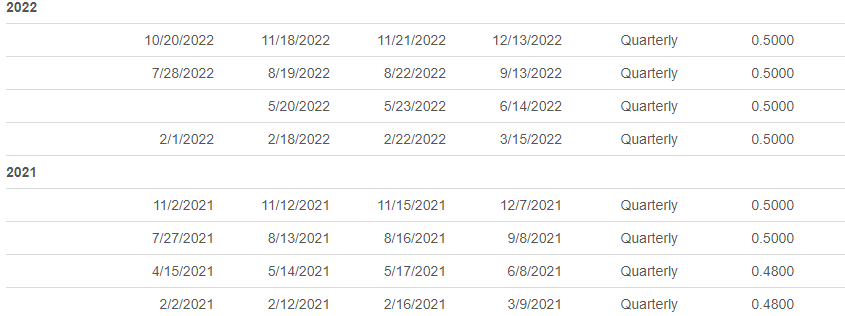
Seeking Alpha – Summary Of HIW’s Recent Quarterly Payouts
Through the first nine months of the year, the company generated over +$300M in operating cash flows. This is up about 3.5% from last year and more than enough to fully cover their distributions, which total +$160M over the same period.
Their active pipeline of developments does result in higher investing activities, thereby constraining liquidity for their payout, but there does not appear to be evident risks or threats to the current payout for the foreseeable future.
Additionally, as a percentage of funds from operations (“FFO”), the payout ratio was just under 50% in the third quarter, providing additional support to the continuity of their quarterly payouts.
How Much Is HIW Undervalued?
Presently, HIW is trading at the lower end of their 52-week range at just 7.1x forward FFO. In addition, shares are being valued at an implied cap rate, calculated as a percentage of forward NOI to their current market capitalization, of 9.5%. For comparative purposes, shares were provided an implied cap of 7% in the third quarter of last year and 6.6% at the end of 2021.
Shares, therefore, appear clearly undervalued, especially considering their current leasing volumes and steadily improving portfolio metrics.
Given the staying power of hybrid working arrangements, cap rate expansion is certainly warranted. But 9.5% seems overdone. While an 8% cap rate is also arguably on the higher end of the spectrum, an assessed valuation at this rate would suggest an intrinsic share price of approximately $37.50. At current pricing, this represents upside of over 30%.
Consensus Wall Street estimates, on the other hand, assess an average price target of $31.60, which would represent upside of about 12%.
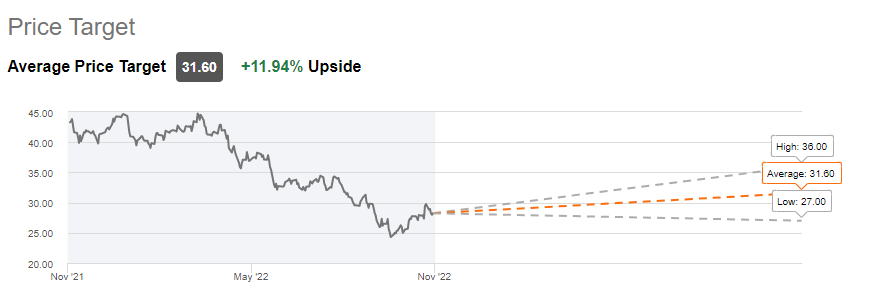
Seeking Alpha – Snapshot Of Consensus Wall Street Price Targets For HIW
Together with consensus estimates, an average price of about $35/share appears appropriate. This would represent estimated upside potential of just under 25%, excluding the dividend payouts.
Is Highwoods Properties A Buy Following Earnings?
HIW reported historically strong new leasing activity levels in the current quarter and paired that with their third consecutive increase to their full-year FFO outlook. And overall, the company reported strong progress in their major operating markets, with particular strength in Charlotte, North Carolina, a market that now accounts for over 10% of their total NOI in a time span of less than three years since entering the market.
Activities performed during the quarter to extend out upcoming debt maturities further strengthened their already conservative balance sheet. The company now has no amounts due prior to late 2025 at the earliest. This provides the company with increased flexibility to satisfy ongoing operational and growth ambitions.
For income investors, shares offer an attractive dividend yield of over 7%, with a strong track record of continuous growth. This dividend would also be combined with sizeable upside potential in the share price, estimated to be about 25%, based on current trading levels. While many view the office-sector with caution, companies such as HIW continue to prove the durability of the asset class, as evidenced by continued strength in leasing with WALTs in excess of five years. For investors seeking material upside in the REIT sector, HIW is one well past due for a rebound.
Be the first to comment