

Nikada/iStock Unreleased via Getty Images
Apple (NASDAQ:AAPL) invented the smartphone, and the first iPhone was introduced in 2007. This is one example of innovative products that include the iPod and iPad, but also innovative strategies that enhance the functionality of these products such as iTunes, Apple Pay, and the App Store.
Most of the time, Apple is not the first company to introduce a product. Its Smartwatch was introduced in 2014, a year after Samsung’s (OTC:SSNLF) Smart Gear. But enhancements to its Apple Watch, such as ECG, fall detection, walkie-talkie modes, LTE on the wrist and heart rate notifications have catapulted the product ahead of other smartwatches with a 53% share. That’s well ahead of Samsung’s 11% share.
Innovation is taking Apple in many new directions. One key strategy is semiconductor components, as Apple has moved away from sourcing components from Samsung Electronics Co. and Intel Corp. (INTC). Apple designs its own chips for the iPhone, iPad and Mac, and is also looking to reduce and ultimately drop Qualcomm (QCOM) for cellular modems. After writing six Seeking Alpha articles on ARK Innovation ETF (ARKK) in 2022, I’ve often wondered why Cathie Wood hasn’t included Apple as a holding.
This article provides an extensive analysis of Apple’s key product segments, including growth for the past six years and its competitive standing among competitors
Apple Product Analysis
iPhone
Apple’s core product is the iPhone, and the popular smartphone is among the top five smartphone vendors in the world. The company reported net sales for the iPhone unit of $192 billion for the 2021 fiscal year compared to $138 billion reported in the year before. Sales reached $71.63 billion in F1Q 2022, up 9% YoY and 84% QoQ. iPhone revenues exhibited a CAGR (compound annual growth rate) of 7.7% between C2016 and C2021.
Apple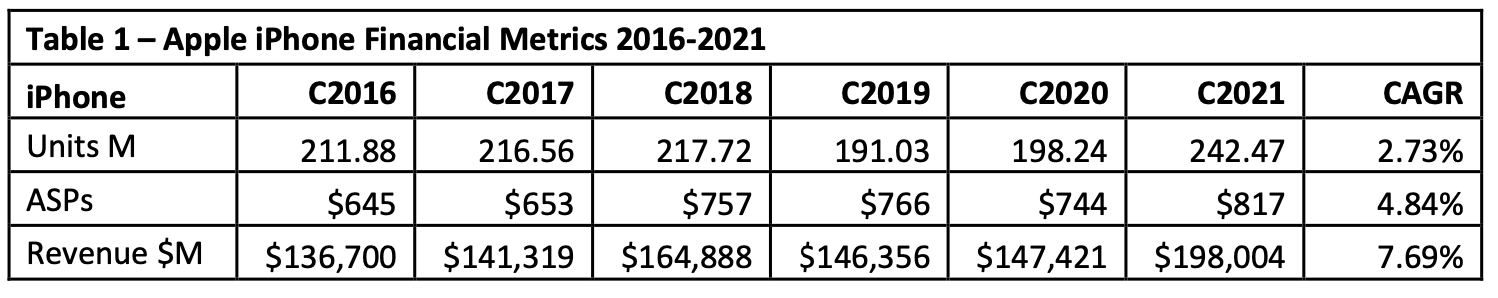
Global smartphone shipments grew 4% YoY to reach 1.39 billion units in 2021. Q4 2021 shipments declined 6% YoY to reach 371 million units. The top five brands gained share due to a significant decline by Huawei, and LG’s exit from the market. Apple surpassed Samsung to become the top smartphone vendor in Q4 2021, shipping 81.5 million units.
Mac
Apple’s personal computer business is built around the Mac and includes its MacBook laptops and the iconic iMac desktop computers. Macs generated sales of $37.4 billion in C2021 ($10.9 billion for F1Q 2022 alone), which is an increase from the $30.1 billion reported in C2020 ($9.2 billion in F4Q 2021). iMac revenues exhibited a CAGR (compound annual growth rate) of 10.4% between C2016 and C2021, as shown in Table 2.
Apple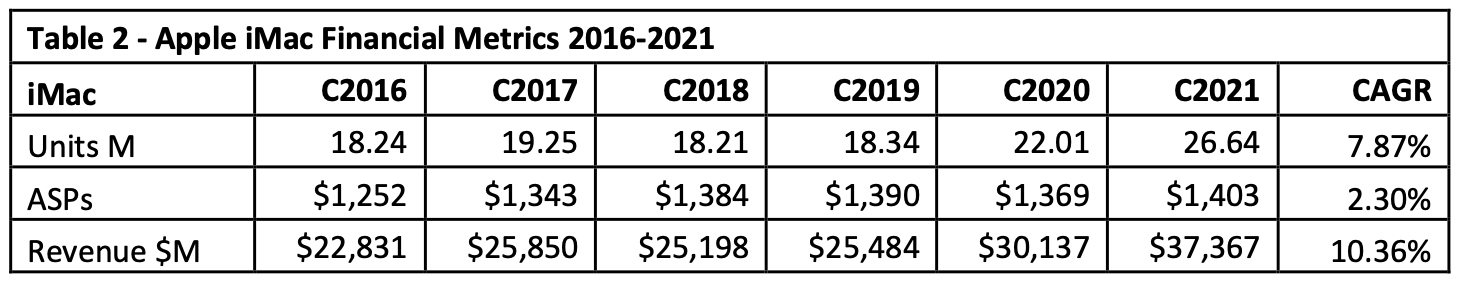
Apple increased its share of the global PC market in Q4 to 8.2% and of the U.S. PC market to 16.6% on the strength of its M1 processor.
Apple announced in March 2022 its highest-end M1 Mac processor to date, a model that links two M1 Max chips together into a single package with 20 processing cores, 64 graphics cores, and support for up to 128GB of memory. This should strengthen its sales in 2022 versions.
iPad
Although worldwide demand for tablets is waning, Apple continues to dominate this part of the market. Apple launched its first iPad in 2010. iPads generated sales of $30.7 billion in C2021 ($7.2 billion for F1Q 2022), which is an increase from the $26.2 billion reported in C2020 ($8.3 billion in F4Q21), as shown in Table 3. iPad revenues exhibited a CAGR (compound annual growth rate) of 8.3% between C2016 and C2021.
Apple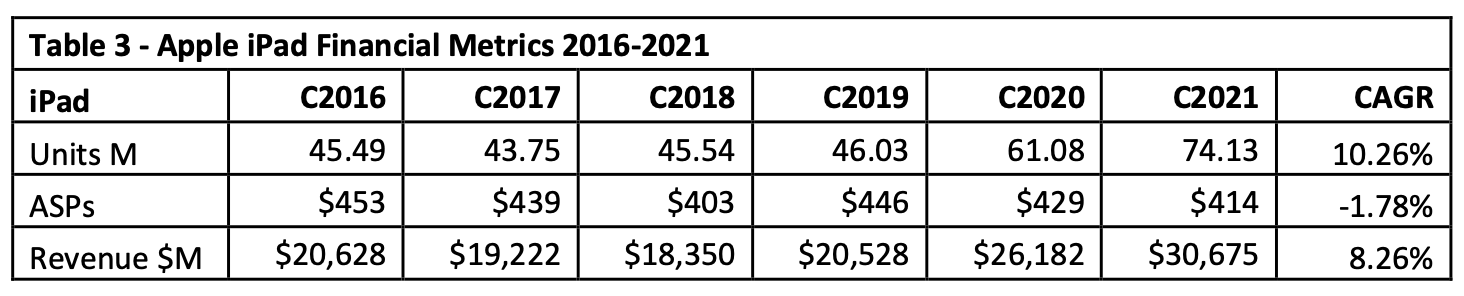
Global tablet shipments fell 21% year on year to 41.9 million units, illustrating the waning of the Table market as users opt for larger smartphones.
Wearables, Home, And Accessories
Apple’s Wearables, Home, and Accessories segment is made up of devices such as AirPods, Apple Watch, and HomePods. The segment posted $38.4 billion in revenue during F2021 and $8.8 billion for the year’s fourth quarter. That’s compared to $30.6 billion and $7.9 for the same periods in 2020, respectively.
Services
Revenue also comes from selling a range of services, such as AppleCare, Apple Pay, iCloud storage services, AppleCare warranties, and subscriptions to services like Apple Music, Apple Arcade, Apple TV+, and the Apple Card, which competes with other financial payment giants. The company’s services business is led by the App Store and Apple Music.
Apple’s services revenue came in at $68.4 billion for the year, growing 27.3% compared to FY2020. In its FY2021, Apple’s overall gross margin was 41.8%. Apple’s product gross margin came in at 35.3%, compared to 69.7% for its services unit.
Chart 1 shows the continued growth of the services segment, which exhibited a CAGR of 24.3% between 2016 and 2021 on a revenue basis. As a percentage, services revenue decreased in 2021 because of the large increase in iPhone sales, as was shown in Table 1.
Apple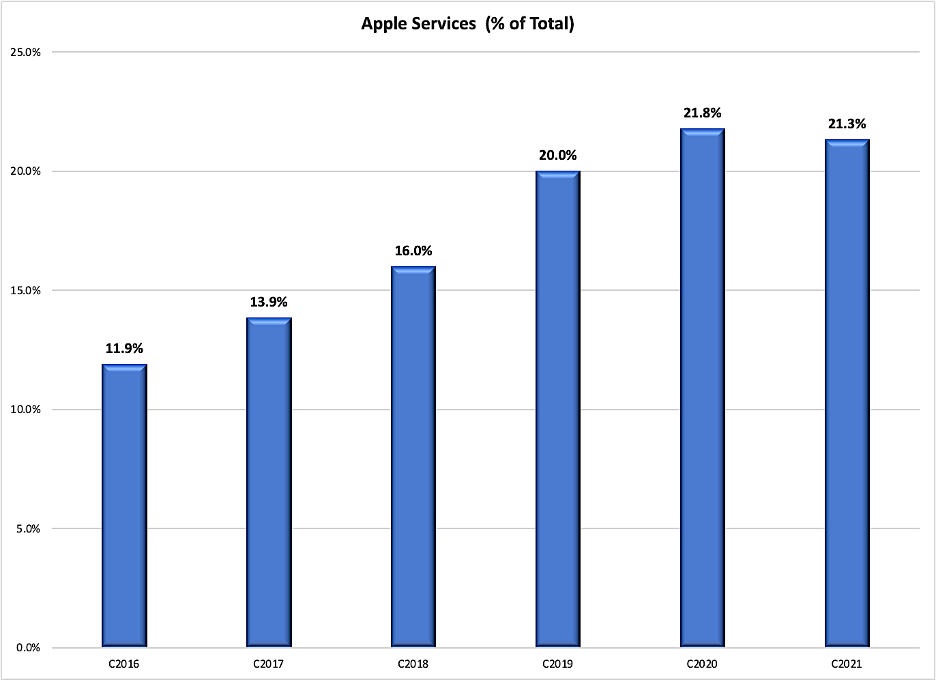
Chart 1
Apple’s service business consists of multiple units including mobile payments service Apple Pay and streaming music service Apple Music. According to MIDiA Research, in the second quarter of 2021 Apple Music was the second most used music platform, still far behind Spotify. With a total global subscriber base of 523.9 million subscribers (a YoY 26.4% increase) Apple’s 15% share means that it has already surpassed 78 million paid subscribers. This is up from 50 million subscribers in 4Q 2019. The standard Apple Music subscription costs $9.99 in the United States, but there are special prices for families, students, and Apple One subscribers.
Apple Pay is the payment service from Apple, allowing using to make in-store payments with apps on mobile iOS devices or online with web browser Safari. An important characteristic of this payment option is that it only exists on devices built and sold by Apple itself – meaning Apple Pay is unavailable on Android. At the end of FY2020, Apple Pay had 507 million subscribers, up from 442 million in FY2019.
Apple Pay remains the biggest in-store mobile wallet player, with 45.5% share of mobile wallet users. Over the last seven years, the total amount of Apple Pay transactions at U.S. retail stores has increased from an estimated $5 billion in 2015 to $90 billion in 2021.
Apple’s App Store generated revenues of $6.5 billion in F1Q 2022, as shown in Table 4. Growth has moderated following the Covid-19 pandemic when work/stay/study at home edicts were relaxed.
Apple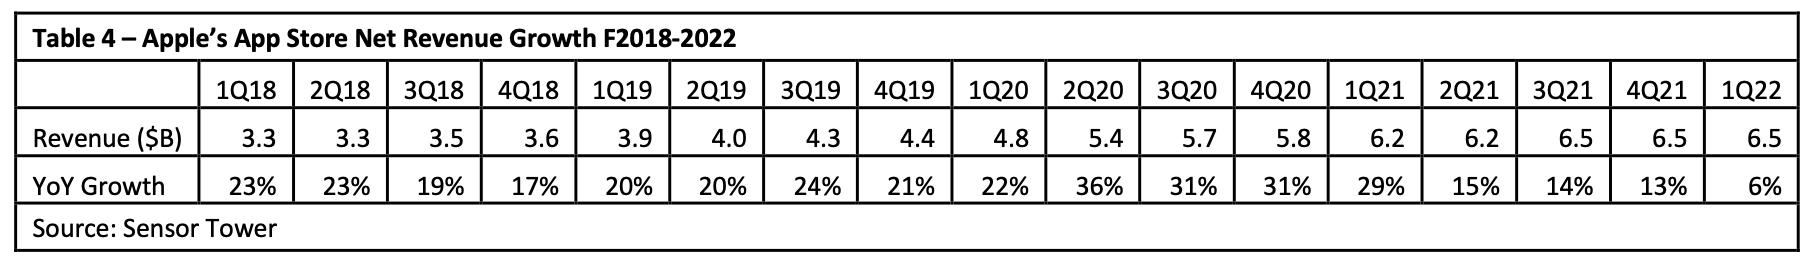
Chart 2 shows Apple’s operating income in 2021 by region, showing that Greater China (Mainland and Taiwan) is 41.7%, one of the highest of the regions. Apple hit a record 23% market share in China in the fourth quarter of 2021, with Apple reclaiming the number one player for the first time in six years. That was driven by the “relatively lower starting price” of its iPhone 13 which had strong camera and 5G features. Meanwhile, China’s smartphone market declined in 2021 due to component shortages and sluggish consumer spending.
Apple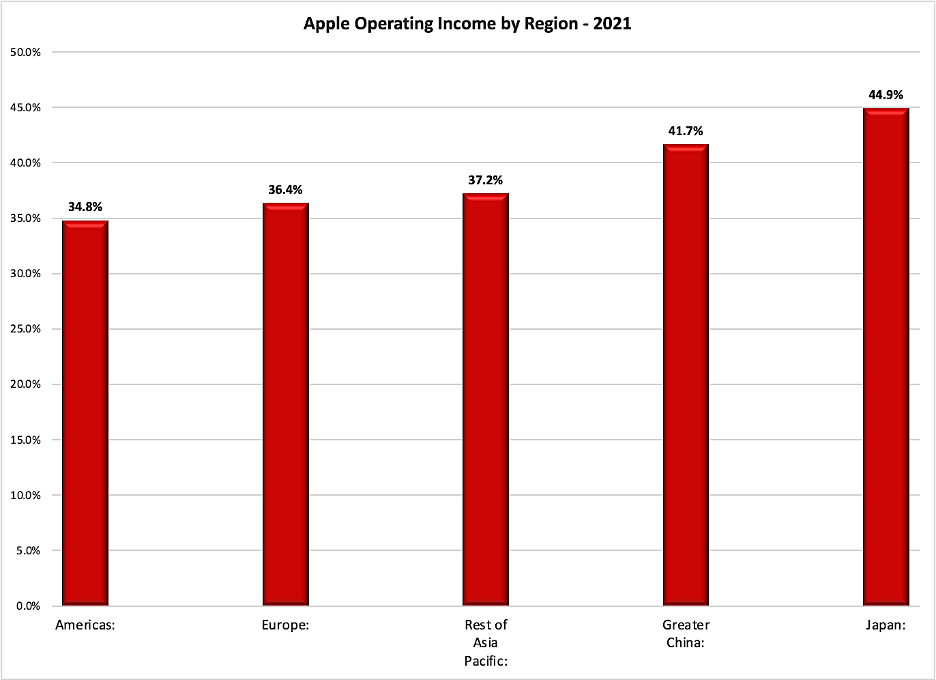
Chart 2
But this foothold in China has come at a price. Apple has been accused of making a number of efforts to appease Beijing.
Back in 2017, the Chinese government asked Apple to remove the New York Times app from the Chinese App Store and Apple complied. Then China insisted that Apple remove more than 400 VPN apps from the App Store and Apple did so. Also in 2017, the Chinese Ministry of Public Security asked Apple to remove Skype and again Apple did as requested. In 2022, Apple removed access to the Quartz news app and banned a Hong Kong protest app at the request of China.
With geopolitical tensions rising in Ukraine and concerns over China-Taiwan annexation, there could be a backlash against Apple. If more sanctions are imposed on China, Chinese buyers could walk away in response. U.S. buyers could react against the woke Apple culture.
Investor Takeaway
Chart 3 shows that Apple’s price change increased 36.44% over the past 1-year period, more than double growth of the S&P Technology sector index (IXT).
YCharts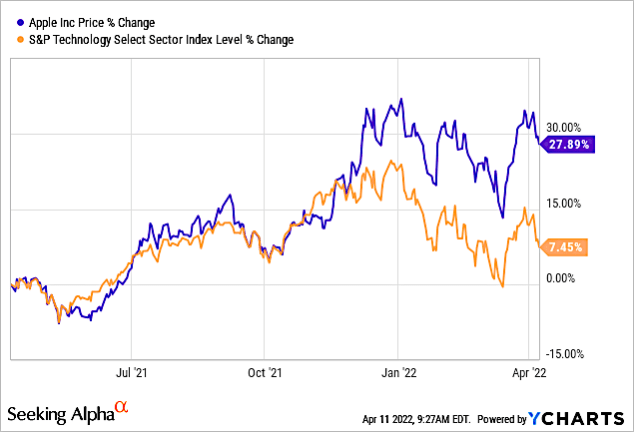
Chart 3
Chart 4 shows that Apple’s stock had been increasing in tandem with the 10-year Treasury until the past few days. This is a positive for Apple, because technology stocks have been dropping as rates are increasing.
YCharts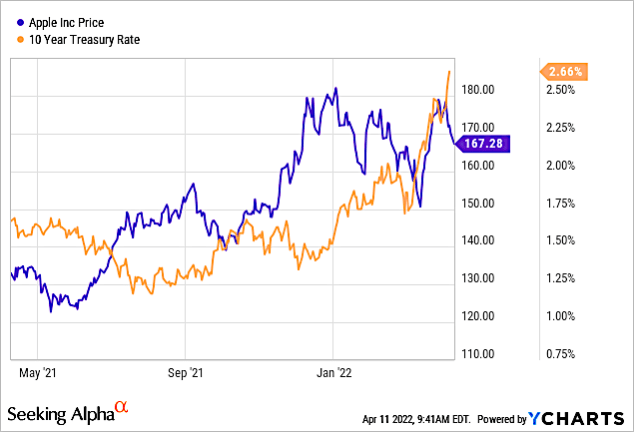
Chart 4
Seeking Alpha’s Factor Grades give the company an F for valuation and D- for Growth, as shown in Chart 5.
Seeking Alpha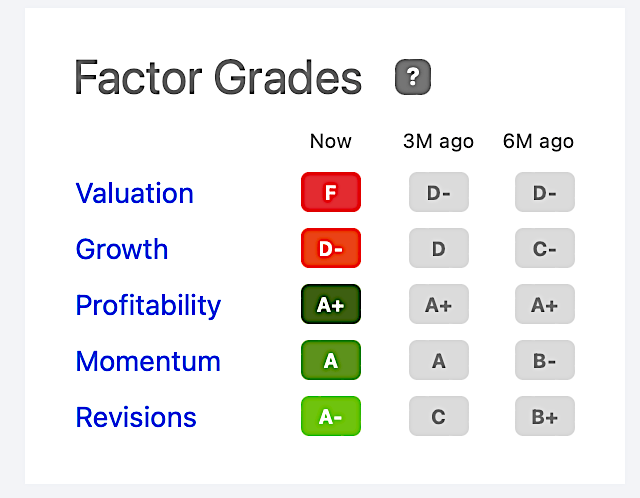
Chart 5
Valuation is a poor value based on its P/E Ratio (28.4x) compared to the US Tech industry average (15.1x), as shown in Chart 6.
YCharts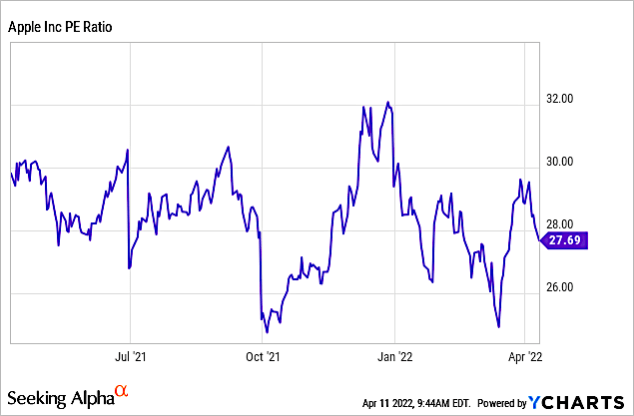
Chart 6
The D for growth is attributed to slow shipments of Apple’s hardware products, as illustrated by CAGR growth in Tables 1-3. The bright note is that its non-hardware segment, i.e., services, is increasing its share of total Apple’s revenue.
Based on my valuation analysis, Apple is a good opportunity to buy. I am encouraged by the fact that Apple stock is not being negatively impacted by increased 10-year Treasury rates as inflation increases, and investors could move money from other technology stocks to Apple.
Be the first to comment