

Vasil Dimitrov/E+ via Getty Images
Many compare the plummet in the broader market, including the S&P 500 (SP500) and Nasdaq (COMP.IND) indices, to the 2000 dot-com bubble burst. Clearly, we aren’t in 2000, when most households only had a dial-up internet connection, and the tech sector contributed less than 1% of GDP (9.3% in 2021 in the US). Many publicly-listed tech companies in 2000 generated single to double-digit million dollar revenues, while most tech and growth companies in the S&P 500 index are generating nine-digit to billions of dollars in revenue today. Internet-focused companies such as delivery, e-commerce and remote meeting services like Zoom (ZM) have transformed lives worldwide and helped many get through the unprecedented global lockdown and pandemic.
Yet, 2022 has proven to be an unprecedented economic cycle, regardless of which type of investment, and the macroeconomic environment affects many investment decisions. Now, inflation in the US and worldwide is at a 40-year high. Some of us are experiencing what our parents went through.
So, we should step back and quantify what is happening in the economy and around us.
There has been a lot of chatter around comparing the current economy to the below:
-
2000 dotcom bubble
-
2008 financial crisis
-
1970s recession
Two key takeaways:
1) Mapping correlation
Making a map of relevant past events and drawing correlations can help us take precautions for future or recurring bad events. While mapping, make sure we compare objectively–apples to apples, instead of apples to oranges, mangoes, or whichever flavor.
The price charts, especially indices, often show us interesting patterns and collective wisdom (market behavior). The number and percentage of the decline and the velocity (rate of change) for the three periods: 2000 (dot-com), 2008 and 2022, aren’t the same. Investors whose portfolio is overweighted with tech or growth stocks should be particularly concerned if 2022 becomes the dot-com bubble 2.0. So far, the data shows it is not, and if that is true, then this cycle is an entirely different ball game.
First, to understand the drawdown’s extent, investors should also look at the expansion of prior up cycles.
The chart below compares the Nasdaq and S&P 500 in the up cycle leading to the dotcom bubble burst vs. the long-bull cycle since 2012 vs. the pandemic bull run. The velocity (speed of change) and intensity of the Nasdaq growth before the 2000 crash (+9.71%/mo) is higher than even the pandemic bull run (+7.15/mo). While there is much growth in tech concentrated stocks, it doesn’t mirror the dotcom bubble. If the two up cycles share a similar velocity, the decline should be just as sharp. Synthesizing the two provides insights and determines whether it is comparable.
Now, let’s look at the down cycle. The highlighted area in the charts below illustrate a critical point – we’re still above the key support of a 50-month average (=~200 week) in 2022 within a similar timeline (roughly 6-7 months), similar downward velocity (10mo rate of change (‘ROC’) below -15%) and a relative weakness (RSI around or below 30) compared to 2000 and 2008. This means that companies in the 2022 cycle show more resilience and stronger business fundamentals, and investors are in better financial positions in this current recessionary environment.
Charts:
-
1: SP500, SPX during dotcom bubble – below 50mo SMA (200 wk SMA), ROC (10,c) -18.32, RSI (10,c) 34.15 on March 2001
SP500, SPX during dotcom bubble downtrend (Yahoo Finance (data from author))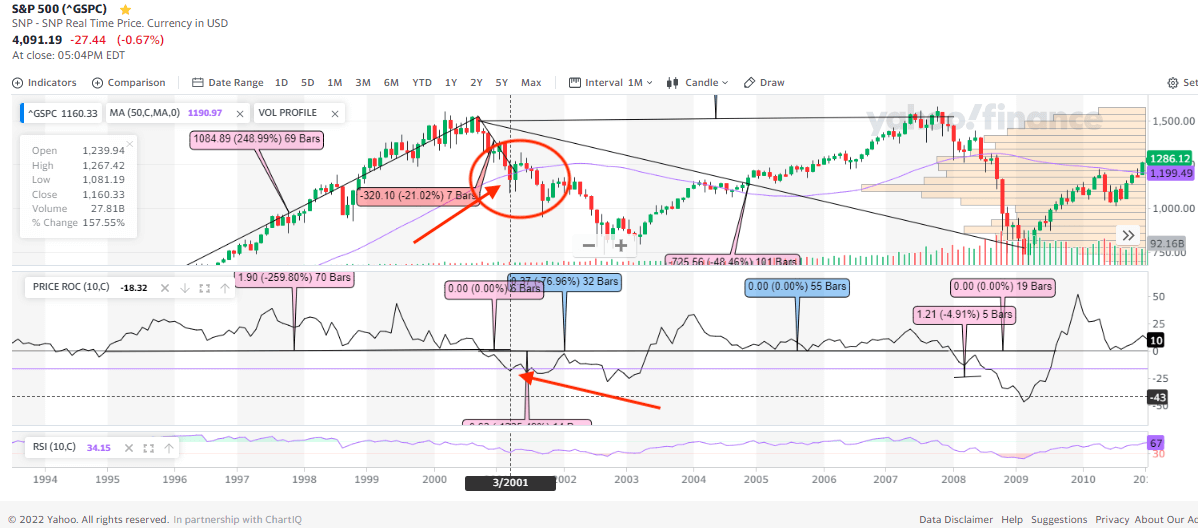
-
2: SP500, SPX during 2008 crash – below 50mo SMA (200 wk SMA), ROC (10,c) -16.99, RSI (10,c) 34.98 on July 2008
SP500, SPX during 2008 crash downtrend (Yahoo Finance (data from author))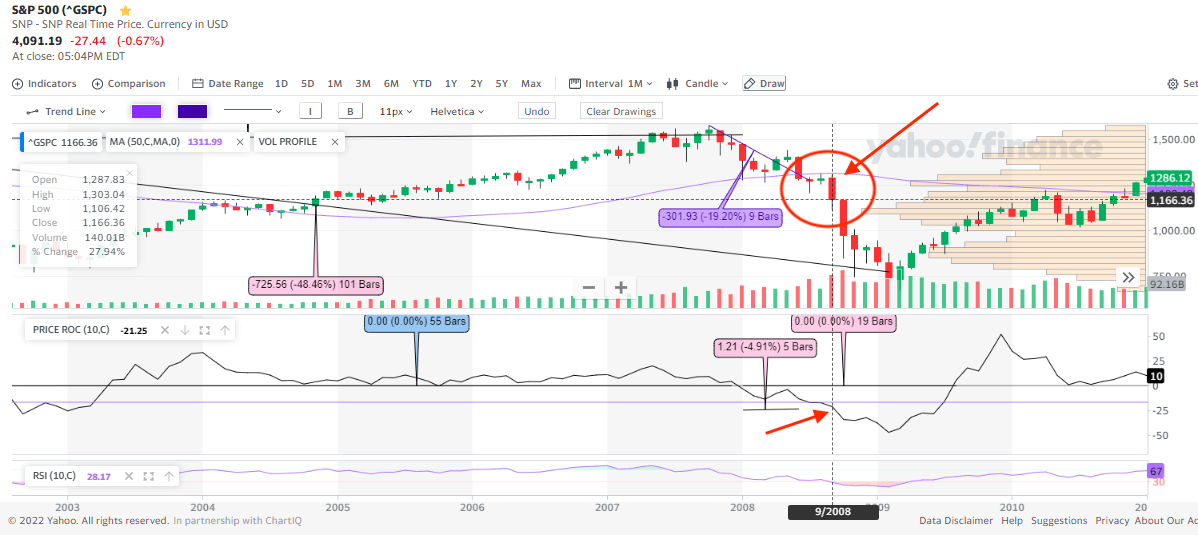
-
3: SP500, SPX during 2022 crash – above 50mo SMA (200 wk SMA), ROC (10,c) -16.30, RSI (10,c) 39.8 on June 2022
SP500, SPX during 2022 crash downtrend (Yahoo Finance (data from author))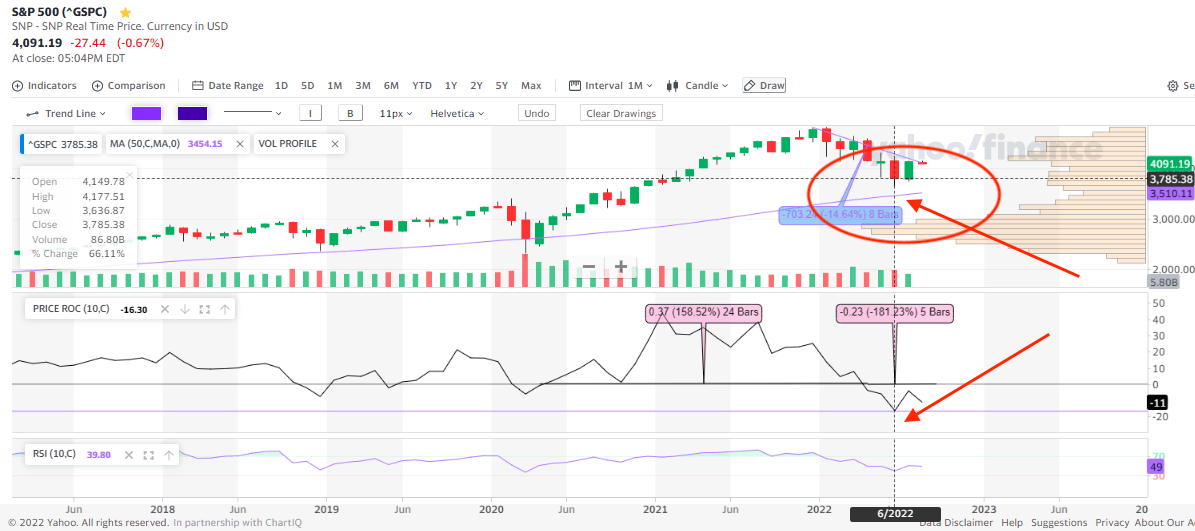
2) Economic downfall fatigue
Some say the market is becoming complacent. As a result, investors ignore or feel numb to the bad economic news and data because the market has been down enough in the first half of the year. They have reset and lowered their earnings expectations from corporations. Bank of America’s (BAC) latest report on August 12th shows that the “Bull & Bear Indicator remains pinned at 0.0, suggesting investors literally could not be more bearish on stocks.” It’s a little bit like COVID-19 fatigue. People know the virus still exists and are being infected, but many are tired of living in fear and cautious mode. Some may feel the situation is not as bad as the media paints it to be, or people bounce back from extreme pessimism to a bit of optimism. The point is that the recent equity market’s rebound doesn’t mean we are in a full recovery, but we are adapting to the new environment; the market has priced in the over-pessimism. While government and corporations need to deal with issues around us, including inflation and the supply chain, the big cap companies such as Apple (AAPL), Amazon (AMZN) and others are well capitalized to solve problems. For example, consumers are shopping for the iPhone 14. The downtrend is still far from recovery, but perhaps the bottom, or floor, is within sight. The lows could be retested at another 5% below the recent lows (approximately in the range of $3450-$3500), but not too far down and certainly not as bad as the $3,000 level for the S&P 500. According to the same Bank of America report, it “showed investors were buyers almost across the board last week, with $11.7 billion coming into bonds, $7.1 billion moving into stocks, and $4.3 billion coming out of cash holdings. Money also moved out of commodities last week.” That illustrates the resilience and a turn in risk tolerance among investors, but bigger institutions or hedge funds are required to take additional fiduciary duty and cautious risk management.
In Chart 3 above, the main indicator shows that in June 2022, we reached a decline at a ROC (10m basis) below -15%. In essence, we have reached a significant bottom, and the reversal indicates a reflection point in this cycle (See Chart 3 and commentary above).
The rally and broad market reversal from 4 to 6 weeks of gains in major indices, including the S&P 500 from mid-June up until August, shows the breadth and strength beyond the typical short-lived bear rally within a challenging environment and many economic headwinds still intact. As Carson Group’s Ryan Detrick stated, “Nearly 90% of stocks in the S&P 500 are now above their 50-day moving average.” So, during the usually slow and low-volume July, while institutional investors are on holiday, the uptrend spike with high velocity demonstrates a sign of programmatic trading, short covering and retail investor flow, especially in the lower quality meme and small-cap stocks.
Measurable next steps
Investors need to dive into the company fundamentals that they invest in. Not all companies are created equal. Some might have experienced the same drawdown percentage, but selective, high-quality companies with strong fundamentals and an edge would have better long-term prospects. For example, when the media calls it a meme stock, I’d suggest not. The only thing that resembles Coinbase (COIN) and GameStop (GME) is the high percentage of short selling. Undoubtedly, Coinbase is experiencing a shortfall in earnings and over-expanded operating expenses given the current macro environment and crypto market decline. It’s crucial that Coinbase trims their expenses as much and as fast as possible while maintaining their long-term growth prospect and competitiveness. The main concern in their Q2 Earnings is that their cost cutting results are still lagging. But in terms of the business fundamentals, Coinbase and GameStop are far apart. Coinbase isn’t Pets.com nor a meme stock. If the institutional client base thesis plays out, it could lift the Coinbase stock price and catch the short seller by surprise.
While the data shows the market isn’t repeating a dotcom bubble crash cycle, there is the overall economic slowdown and headwinds, including the Fed interest rate hike. The extended July rally shows a certain level of over-optimism that perhaps wouldn’t be realistic either. Investors should monitor the extent of the current rally. The S&P 500 could hit its previous high of $4,606 in March at the current pace, but it also serves as a strong resistance. For investors who prefer to take risk off the table, it could be a profit-taking opportunity in the short term and buy back the position when it declines. For long-term investors, it’s more beneficial to hold, but they should refrain from buying at this point because the upward movement should hit a pause, which will present a better buying level.
Currently, the S&P 500 is at a healthy level above the Bull Market Support Band (BMSB formed by 20wk SMA and 21wk EMA). Also, the 21- week EMA crosses above the 20-week SMA, which shows a strong upward trend. When the uptrend reverses and the price level trends below BMSB, investors should closely monitor the trend-line and a variety of macro factors, including the US dollar index and the Crude Oil future price. If they trend upward while the S&P 500 trends downward over 2% to 4% within two consecutive weeks in the opposite direction, it will accelerate the selling pressure. Overall, the economy shows signs of improvement and the equity markets should fare better in the second half of the year and could recover some or most of the losses to end 2022, around $4,600 to $4,800 price range.
S&P 500 above Bull Market Support Band (Yahoo Finance (data from author))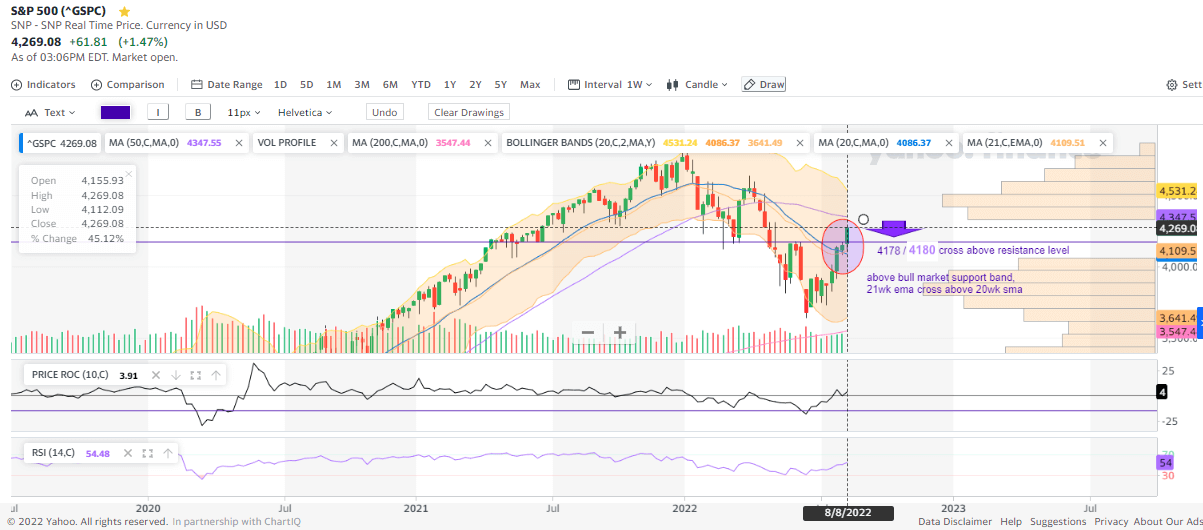
Be the first to comment