

monsitj/iStock via Getty Images
In this follow-up to my previous piece analyzing IRM from a technical perspective (Iron Mountain: The Charts Say Yes Even As The Bears Say No), I would like to offer a brief analysis of the stock’s trading patterns in recent months and assessment of what the charts are telling us now.
As before, I am bullish on the company from a fundamental perspective, and the company’s recent Q4 results and its full-year guidance for 2022 along its acquisition of ITRenew have only served to reinforce that view. However, since there are already plenty of good articles discussing IRM fundamentals from other SA contributors, I feel the best way to add value at this time is to focus on the stock’s technical picture.
Overview of recent chart action
In the roughly three months since my previous piece was published in early December last year, IRM has taken investors on a rollercoaster ride. The market has of course had its own ups and downs but during this timeframe there were extended periods when IRM visibly outperformed or underperformed both the S&P 500 and the real estate sector index, as shown in the chart below.
IRM versus S&P 500 and S&P 500 Real Estate Sector Index (3-month chart)
TradingView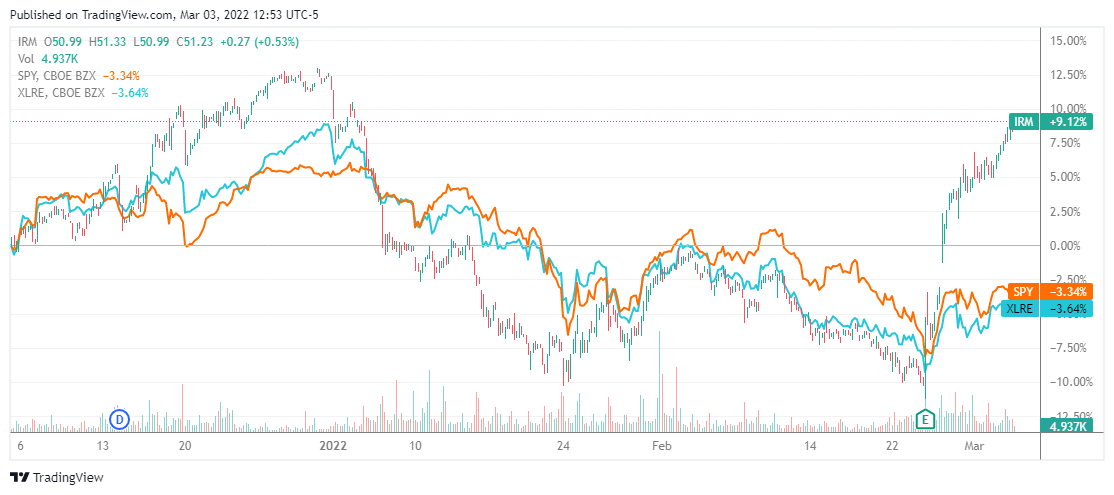
On the upside, we would particularly note the stock’s two-week move above $50 in the latter half of December. The real estate sector index outperformed the S&P 500 that month, rising 9.3% versus a 4.3% rise for the S&P 500, but the 16.0% rise in IRM easily beat both the sector index and the S&P 500. The outsized gains logged by IRM in December were due in part to developments on the fundamentals side, as detailed below, but the boost that pushed the stock over $50 came from the “headline effect” of being in the news.
On the fundamentals side, the big news from the company in December was its acquisition of ITRenew announced on Friday, December 10 (Iron Mountain to acquire ITRenew for $725M in cash), and the up-sized notes offering to pay for the acquisition announced on Monday, December 13 (Iron Mountain boosts size of notes offering to pay for ITRenew deal). The acquisition provided more proof that the company was making good progress on its digital transformation initiative. The up-sized notes offering showed just how easy it was for IRM to issue new debt to finance acquisitions-this being especially significant because one of the main complaints about IRM is it carries too much debt. These two pieces of news were not enough to send the stock over $50, though, it was the surge of speculative buying following a favorable general mention by one of the talking heads on CNBC’s Halftime Report show on Wednesday, December 15 (Iron Mountain gains amid CNBC commentator mention).
Since it was a rush of speculative buying on top of the positive developments on the fundamentals side that drove the stock’s outperformance in December, it is not surprising that, in the absence of any company-specific news flow, IRM underperformed both the real estate sector and the S&P when the broad market was coming down in January and again in February. That said, from a technical perspective the most important point is not the underperformance but where IRM found downside support-just above the key downside support line at $40-$41, as indicated in the charts below.
IRM one-year chart: Key downside support line at $40-$41
TradingView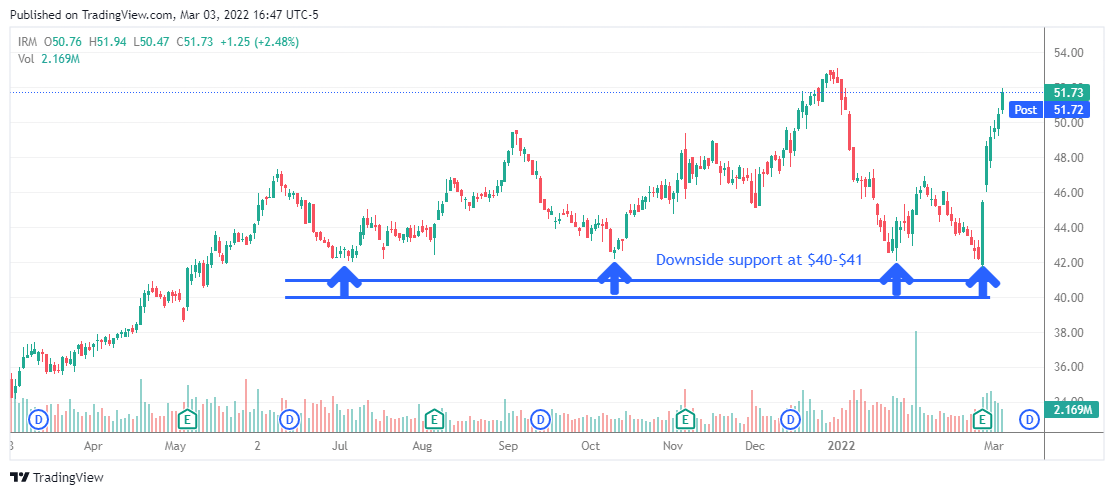
Long-term chart: Resistance at level of triple-top now support line at $40-$41
TradingView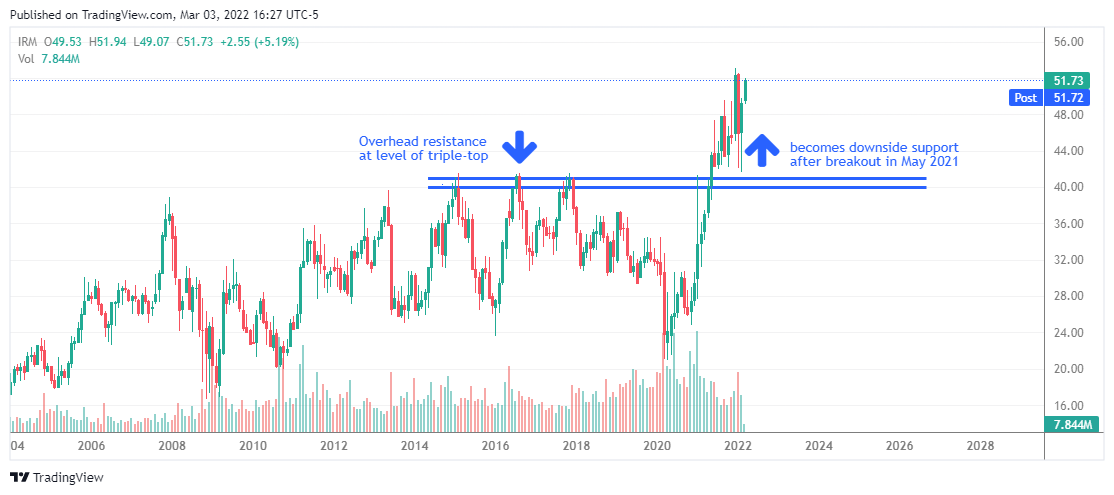
The rules of technical analysis tell us that after a breakout above an overhead resistance line, the former resistance line turns into a support line. Moreover, the greater the resistance at a particular level in the past (which is in part a function of time), the greater the support that can be expected at that level once it becomes a support line. Think about this in terms of supply-demand dynamics and you should be able to understand why. When a stock is trading below past highs, the overhead resistance comes from selling by existing stockholders looking to sell into strength (some just hoping to break even). Once that selling has been absorbed and there are no more weak-holders anxious to sell, the stage is set for the stock to move higher because would-be buyers will be forced to bid higher and higher to convince remaining holders to sell.
Applying this to IRM, we can say that the stock’s initial breakout above what had been long-term resistance at $40-$41 was a sure sign of technical strength that has been subsequently confirmed by the fact that the stock has continued to hold above that level and advance to new highs. In particular, we note that the stock has pulled back to $42 a number of times since the initial breakout last May and bounced back quickly each and every time; this tells us there are still plenty of investors waiting to buy on weaknesses because they believe the company’s fundamentals have taken a decisive turn for the better and continue to improve as it executes on its digital transformation strategy.
Of course, investors would rather not see a stock slip below its 50-day moving average or its 200-day moving average, but that happened in the midst of a broad market selloff and was not a company-specific selloff involving only IRM. More importantly, after dropping below its 200-day moving average IRM was quick to bounce back on heavy volume following the February 24 release of strong Q4 2021 results and upbeat guidance for 2022 on and has followed this with further gains in the days since.
It helped that the market staged a powerful upside reversal on the day IRM released Q4 results, but the stock’s 23%-plus rise since then easily beats the S&P 500’s 2.5% gain and the real estate sector’s 6.1% gain (through March 4). The obvious conclusion is investors liked IRM’s latest earnings and guidance for 2022, and are now even more confident in the company’s ability to deliver growth and strengthen its financial position while maintaining and perhaps even increasing its dividend.
What about the upside?
Now that the market has been reassured by the company’s latest earnings and guidance, IRM investors have all the more reason to be confident that the stock has a solid floor of support at $40-$41. But what about the upside?
With the stock having already worked its way back above $50 (closing at $52.14 on March 4), the first question is whether the stock can stay above $50 for anything more than a few days or a couple of weeks (as it did in December). Given the more than 20% jump in the stock in the week since the company’s reported Q4 results, it is hard to be optimistic about the stock’s ability to firmly establish itself above $50 this time around. Even under stable market conditions, a fast 20% gain might be expected to trigger sales by investors wanting to take money off the table. But these are not stable market conditions so there is all the more reason for short-term investors to book the fast gain.
Further compounding the situation are the many speculators (mentioned previously) who bought the stock above $50 in December in response to the plug for IRM on CNBC’s Halftime Report show. Assuming they are still holding, many may be looking to sell now that they are at or close to breakeven.
The strength of the overall market and the relative strength of the real estate sector will also play a role in determining whether IRM stays above $50, but there is not much certainly on those fronts either. In short, don’t be surprised or worried if the stock does slips back below $50. Be prepared to wait a little longer for the stock to firmly establish itself above $50. Depending on conditions in the overall market, that might take another quarter and more good news on the fundamental side. That is not unusual, as most major moves in stocks are linked to quarterly earnings announcements.
If IRM does pull back below $50, investors would prefer to see the stock find support around the level of its 50- or 200-day moving average (which at this time are both around the $46-$47 range). These moving averages might not be of much help amid a broad market selloff, though. If the market as a whole comes under heavy selling pressure, as we saw in January and February, you might be better off holding out for buying opportunities closer to the downside support at $40-$41.
If IRM manages to stay above $50, I would strongly encourage investors to continue holding for the long term. Because the company’s digital transformation initiative only started becoming a significant factor last year, the stock still has plenty of room (and time) to run if the company continues to successfully execute on its digital transformation initiative. In addition to the expected growth in earnings and cash flow, the accompanying improvement in the company’s financial position and the increasing certainty surrounding its financials may also give the stock an additional boost in the form of higher valuation multiples. For our holding period, we are still thinking in terms of years, not months or quarters.
With regard to the dividend, although the current yield of 4.7% is not as high as it was when the stock was depressed, investors can expect rewards in the form of additional capital gains and, eventually, increases in the dividend itself (now $0.685 per quarter or $2.67 per annum).
Other factors of note
Also noteworthy at this time is the decline in the stock’s short interest in recent months. As of February 15, the short interest in the stock was $959 million (7.64% of the float) versus $1.37 billion (9.92% of the float) in December last year and last year’s high of $1.59 billon (12.13% of the float) in June. While these figures mean a mad rush of short-covering is no longer likely to send the stock skyrocketing (as we saw in January 2021), the steady decline in the stock’s short interest is a good sign that long-time bears are finally throwing in the towel in recognition of IRM’s improving fundamentals.
Conclusion
Technical analysis supports a rating of strong hold/buy on weakness for IRM. The stock’s 20%-plus rise since the company released Q4 results and 2022 guidance confirms that investors liked what they saw and heard, and further reinforced the stock’s major downside support at $40-$41.
With the stock already trading above $50, the upside appears limited in the near term. A pullback below $50 is a real possibility, but don’t be too quick to buy on weakness amid the current market environment. Long term, both the improving fundamentals of the company and the technicals of the stock support a bullish outlook, and this together with the relatively high dividend yield (currently 4.7%) and prospects for dividend hikes in the future make IRM a good buy-and-hold stock.
Be the first to comment