

Pgiam/iStock via Getty Images
Investment briefing
Following the June publication on IRadimed Corporation (NASDAQ:IRMD) the firm continues to unlock value for its shareholders and offer favourable long-term industry positioning. Central to the thesis, is the firm’s sales and earnings growth, and greater share of the profit pool in MRI-compatible devices and monitors. Here I’ll run through the moving parts of the IRMD investment debate, and link this back to the broader investment opportunity.
Net-net, on asset factors and earnings power, IRMD continues to present with attractive economics and a buy rating is well supported in my view.
Before proceeding, I’d encourage you to investigate the prior IRMD publications, in dated order (newest to oldest):
Figure 1.
Data: Updata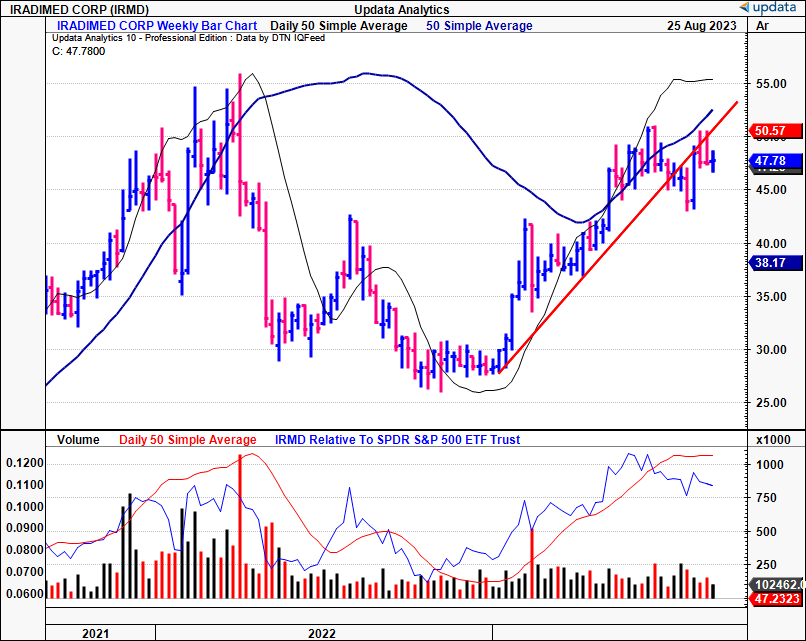
Critical factors driving reiterated buy thesis
Outlined below is the revised case underpinning the IRMD buy thesis. The critical facts of the investment debate are of fundamental, economic and valuation origin.
1. Insights from Q2 earnings
IRMD came in with another strong set of numbers in its Q2 FY’23 results. It clipped sales revenue of $16.1mm, up 27% YoY, and pulled this to 75% gross and earnings of $0.33/share, a growth of 27% from Q2 last year. The bulk of revenues were earned in U.S. markets (80%) with the remainder obtained on international sales. Curiously, there was a 500bps shift toward ex-U.S. sales from last year, with international sales up 67% over the 12 months to $3.2mm.
The breakdown of the top-line is as follows:
- Device revenues were up 24% YoY to ~$11mm, with pumps and monitors underlining this upside securing 17% and 25% growth in sales, respectively.
- Disposables also grew by 40% YoY to ~$5mm and continued its upward bias. This was exemplified in the company booking $9.25mm in disposables revenue for the YTD.
- In fact, Figure 2 outlines the firm’s segment revenues from H1 FY’17-H1 FY’23. Comparatively, IV pump systems were at $10.61mm for the half, up from $6.3mm, and monitoring systems clipped $10.8mm, up from $0.78mm over this time.
Figure 2.
BIG Insights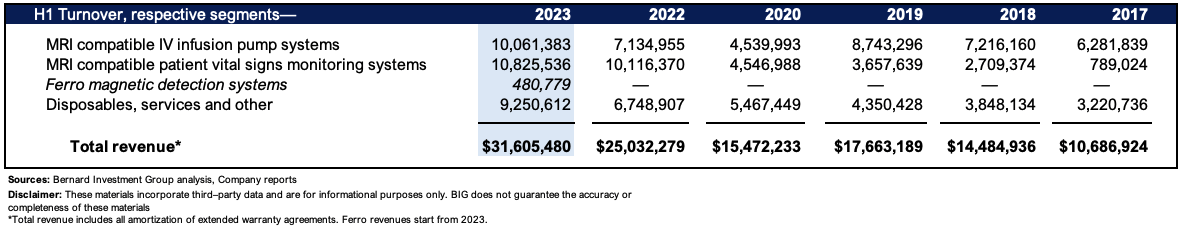
By the same token, IRMD is a qualified growth company based on the record shown in Figure 3. It also aggregates the H1 revenues across the 2017-’23 period, albeit in consolidated fashion. Note, IRMD has compounded both operating segments at 19-20% over the 6 years, with overall sales growing at the same geometric rate.
One of the inflection points worth noting is that IRMD’s main competitor in the monitors space-Phillips-looks to be “[deteriorating] in how strongly they’re remaining in this market”, per management. This, combined with evidenced demand in its IV infusion pumps, is a key growth lever for the company going forward in my opinion. Maintaining a 20% growth rate at the top line is certainly no easy feat, especially when hitting size. But consider that 1) management projects 22% sales growth this year, and 2) consensus estimates on Wall Street support this view. My estimates have the company ending the year with $78mm in capital invested, and at 0.85x capital turnover (discussed later) I get to $66.3mm in FY’23 sales. Hence, I’m aligned with the notion of a 20% compounding rate for IRMD going forward.
Figure 3.
Sources: BIG Insights, Company reports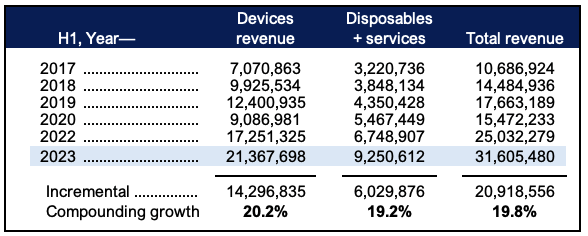
2. Additional insights to business economics
Critically, observations from the firm’s economic growth levers are promising to IRMD catching a further bid.
Figure 4 details the degree of operating cash flows underneath each revenue print on a rolling TTM basis. It captures the conversion from the receivables account versus revenues booked forward. Note, it has ranged from 19-25% from FY’22-’23, whilst the revenue ramp has walked higher in a near-linear fashion. Having 25% of the sales clip as “cash revenues” are attractive economics in my view and enables the firm to recycle cash flows back into additional inventories and capacity to fulfill demand. It also shows the firm is working through its backlog at a reasonable pace, hence, no capacity issues to talk of.
Figure 4.
BIG Insights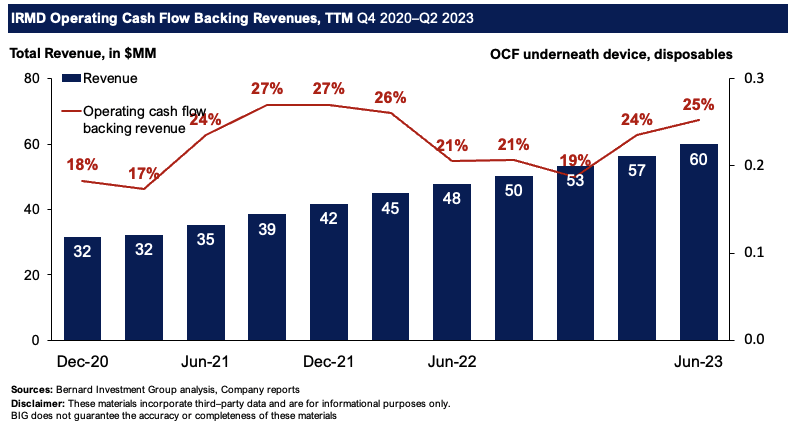
Meanwhile, Figure 5 outlines the major economic growth lever in IRMD’s arsenal in rolling TTM figures. It depicts the degree of capital employed into the business, and the profits earned on this capital at risk. The full reconciliation is observed in Figure 6. Critically:
- A total $6/share in capital employed ($72mm) produces $$1.15/share ($13.8mm) in post-tax earnings, a 19.2% return on investment.
- The bolus of capital requirements are tied up to NWC, i.e., inventory and receivables and the likes. This fits the business model and suggests that to expand, future investment in additional fixtures (including land) is light.
- This return on capital has inflected higher from 13% in 2020 to 19% in Q3 on a trailing basis.
As an equity investor, when buying a company/a position you’re buying the combination of asset factors and earnings power. That is, what capital/assets are in the business, and what kind of sales + profits do this produce.
You’re looking at what amount of earnings are produced on what amount of capital. The higher the earnings relative to the invested capital, the higher the profitability-a higher attractiveness, in my eyes.
You’re also in the business of capital allocation, much like the corporations under the investment radar. Except with every investment decision comes an opportunity cost. On the company side, it is the next highest NPV in the selection of growth projects. For the investor, it is the long-term market return on capital, typically the benchmark indices (equating to 12% in this analysis). Hence, a positive spread in return on capital deployed vs the hurdle rate is fundamental in the value creation of companies for their equity holders.
That IRMD is outpacing the 12% hurdle suggests capital is more valuable in its hands than our own, providing security that it can compound its intrinsic valuation over the long-term. Market returns tend to track business returns over the long-run, hence, this is absolutely critical in the IRMD buy thesis.
These are tremendously attractive economic characteristics in my view and support a buy rating.
Figure 5.
BIG Insights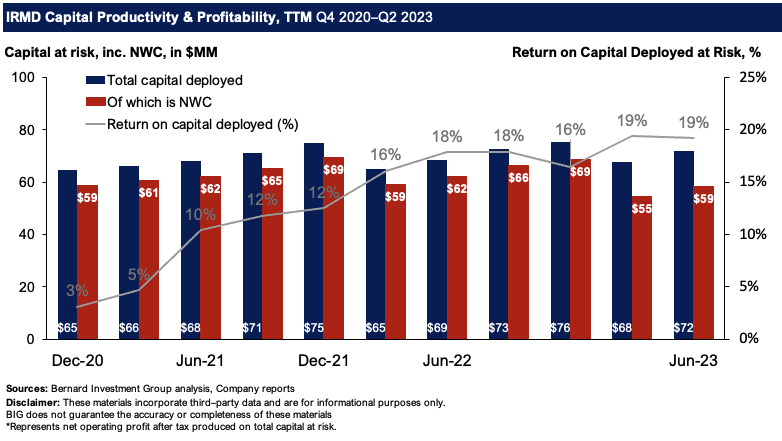
Figure 6 also illustrates that advantages drawn from firm’s capital productivity are driven at the margin versus capital turnover. Post-tax margins have crept up from 6.3% in 2020 to 23.1% last period (TTM basis).
By the same token, capital turnover is up from 0.5 turns to 0.83x over the same period. This shows it has consumer advantages and is employing a cost differentiation strategy, pricing its offerings at above-industry averages and collecting higher margins on this. These are consumer advantages that demonstrate the attractiveness of its product lines. As IRMD moves more inventories out the door, the absolute margins collected on these are conducive to driving profitability higher, especially as it begins to enjoy the benefits of economies of scale, thus setting in the flywheel.
Figure 6.
Sources: BIG Insights, Company reports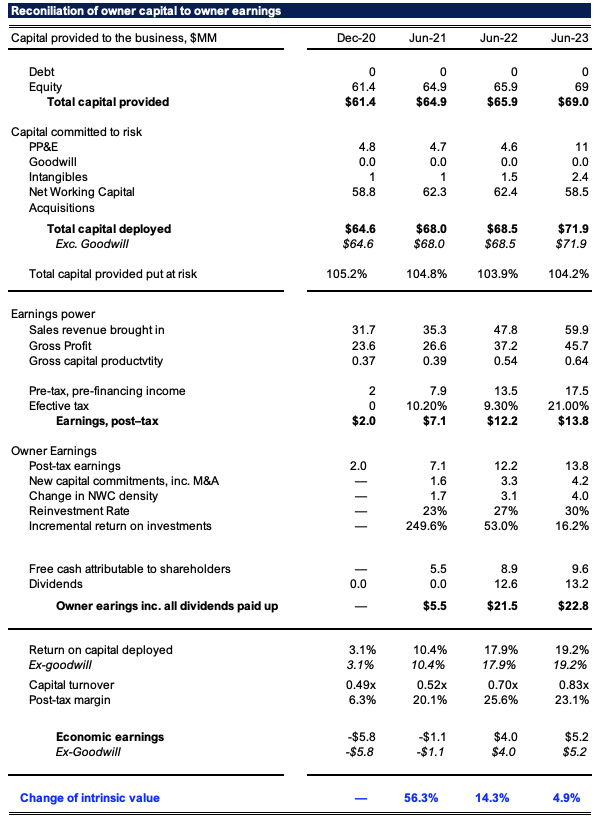
3. Valuation factors
The stock sells at premium multiples to peers and is offered at 34x forward earnings and ~39x forward cash flows. This is 73% and 115% to the sector, respectively. But what does this really say? Is it an outsized multiple to scoff at, or, does it imply the market’s high expectations for IRMD going forward?
Consider that the market also values its net assets at ~$9 in market value for every $1 in NAV. I’ve outlined earlier why this would be so-the firm’s capital is valuable, and returning ~19% from every $1 of capital deployed into the business. IRMD is therefore valued at 8.4x invested capital at the current market cap, up from 4.4x in 2020. Investors, therefore, recognize the earnings power from what the firm’s assets can produce and have priced IRMD accordingly.
A corporation can compound its intrinsic value at the function of its ROIC and what amounts it reinvests at these rates of return. Applying this calculus to IRMD’s equity line, my estimates have the firm perpetually undervalued since 2020. Figure 7 illustrates this. The recent equity gains are corroborated by the economics of the business and imply it is worth ~$880mm in market value or $73/share, 53% value gap as I write. This supports a bullish view. The red and grey lines show 1 standard deviation above and below the implied value, and align with the upside and downside cases, respectively.
Figure 7.
Sources: BIG Insights, Seeking Alpha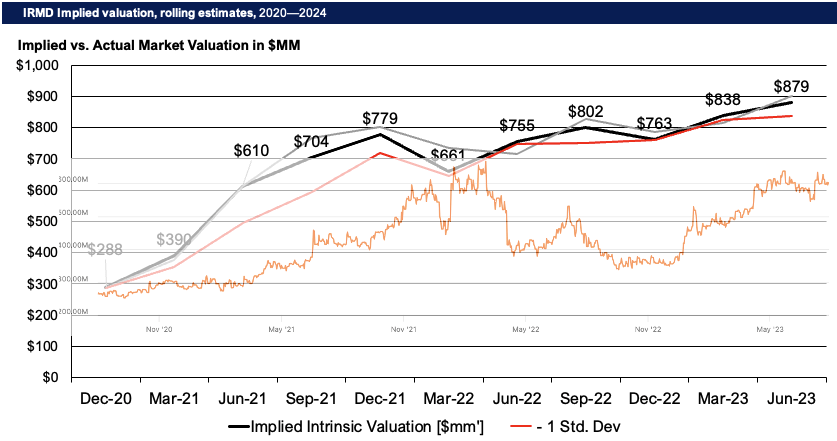
In short
IRMD continues to present with attractive economic characteristics, with high potential to grow earnings and profitability in my view. The firm’s latest numbers support this narrative well, and underlying forces in its core markets add another set of tailwinds to position against. My estimates have the firm fairly valued at $73/share, a 53% value gap at the time of writing. Each of the findings presented here today therefore support a buy rating. Net-net, reiterate buy.
Be the first to comment