

imaginima
Both the decade from 1970 to 1980 and the decade of 2000 to 2010 were basically lost decades for the S&P 500. During the same time period, many international markets drastically outperformed the U.S. stock market:
Long Term Trends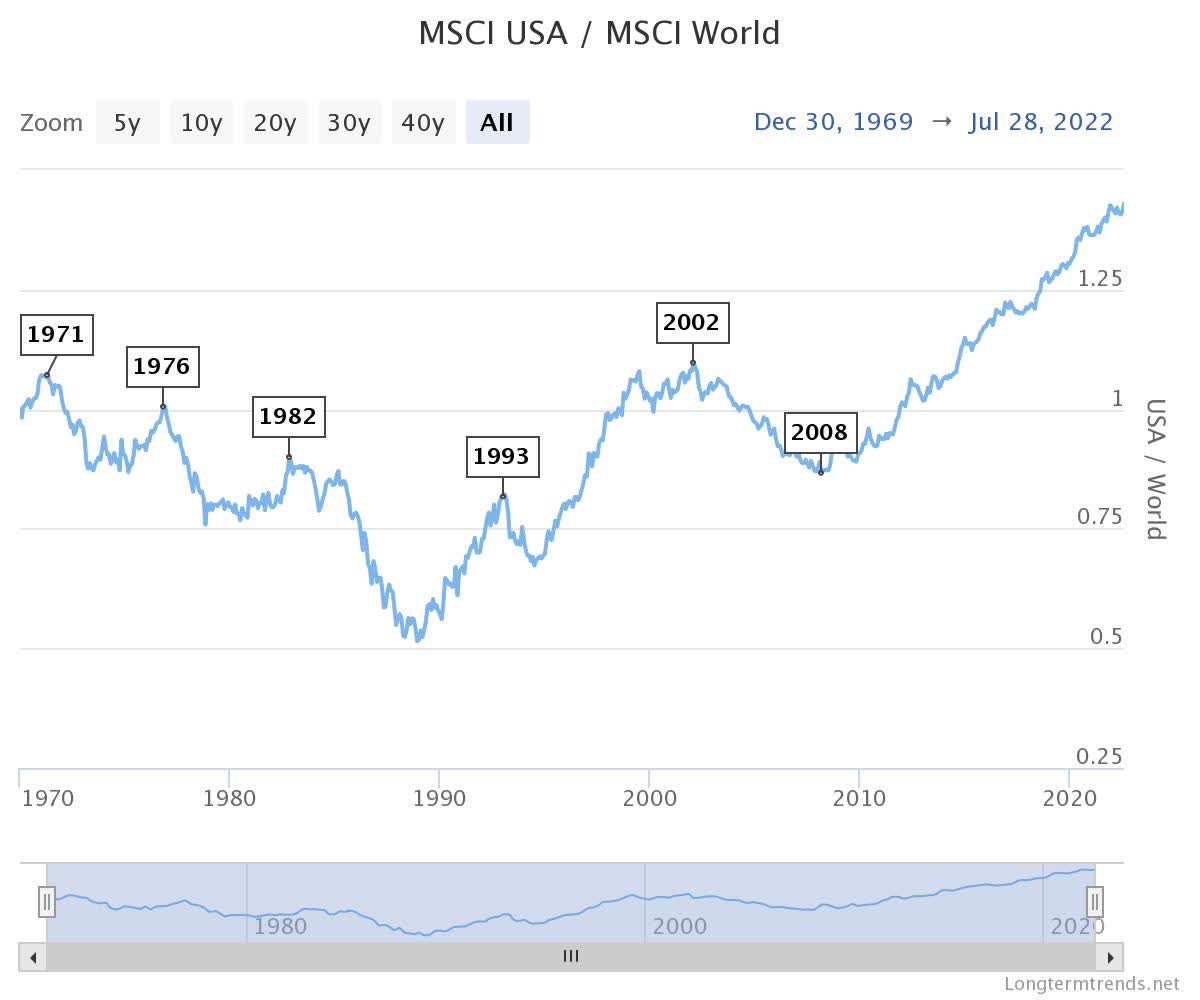
The S&P 500 ended the 1970s only a few percentage points above where it began. During the same time period, the Japanese stock market had excellent returns:
Yahoo Finance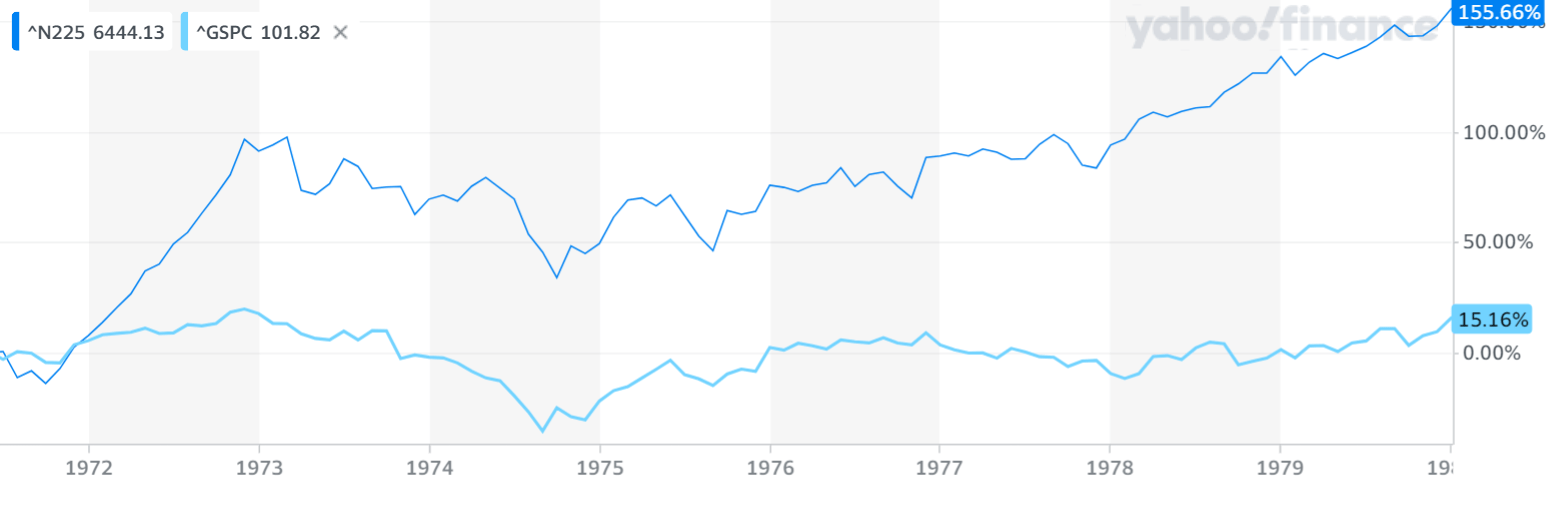
The S&P 500 ended the first decade of the 21st century 23% below were it began:
Long Term Trends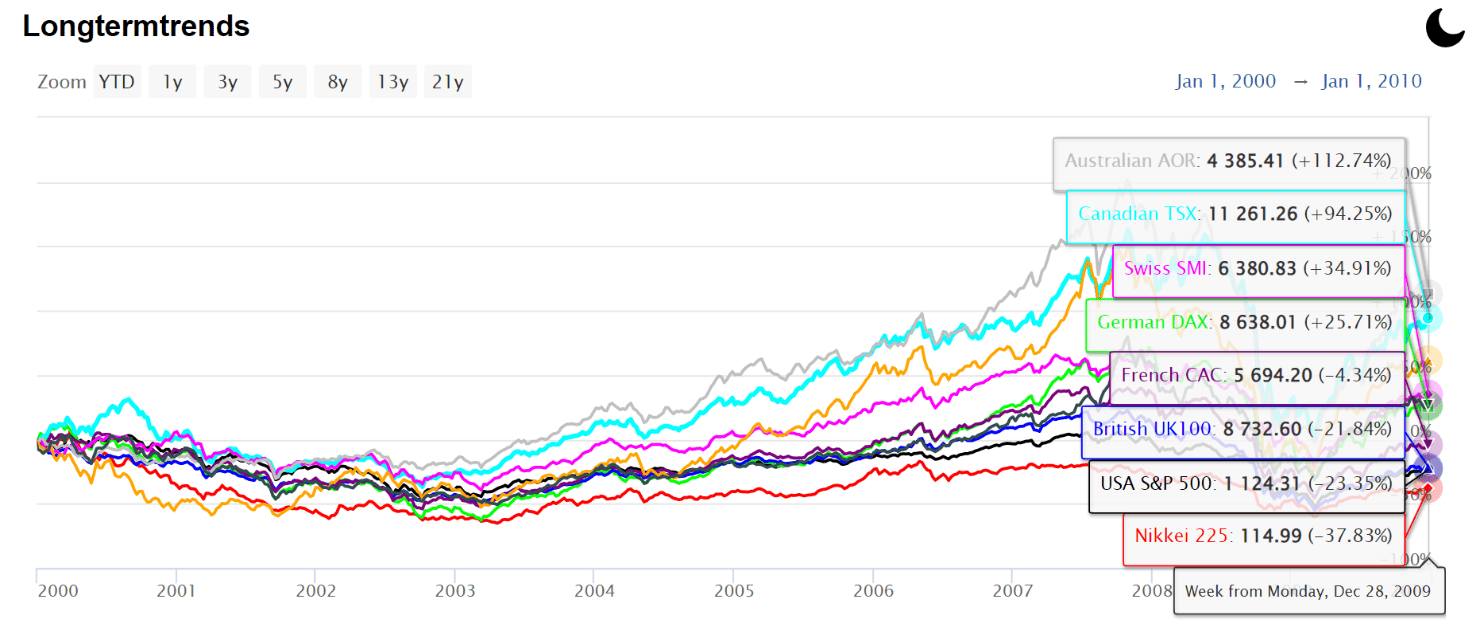
During the same time period, both emerging stock markets and the Australian, Canadian, Swiss, and German markets all showed positive returns. While it’s difficult to predict the future, it seems likely that 2020 to 2030 will see dismal U.S. stock market returns similar to the 1970s and the 2000s.
Long Term Trends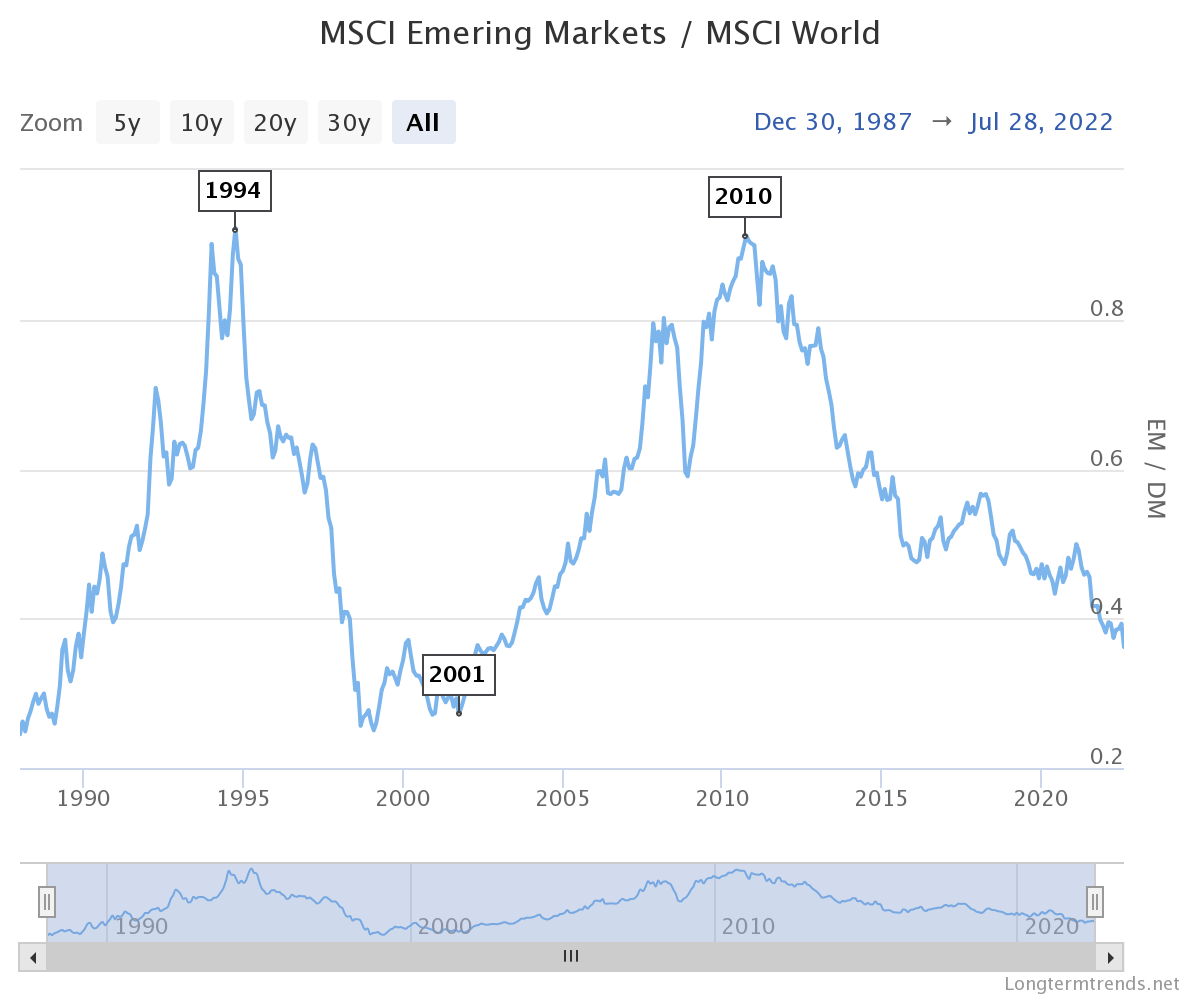
U.S. stock market performance during the 2000s was by no means uniform. While large-cap growth stocks ended the decade down 30% and mid- and small-cap growth stocks ended the decade little changed, small and mid-cap value stocks showed respectable returns over 100% and large-cap value stocks were slightly positive for the decade.
Long Term Trends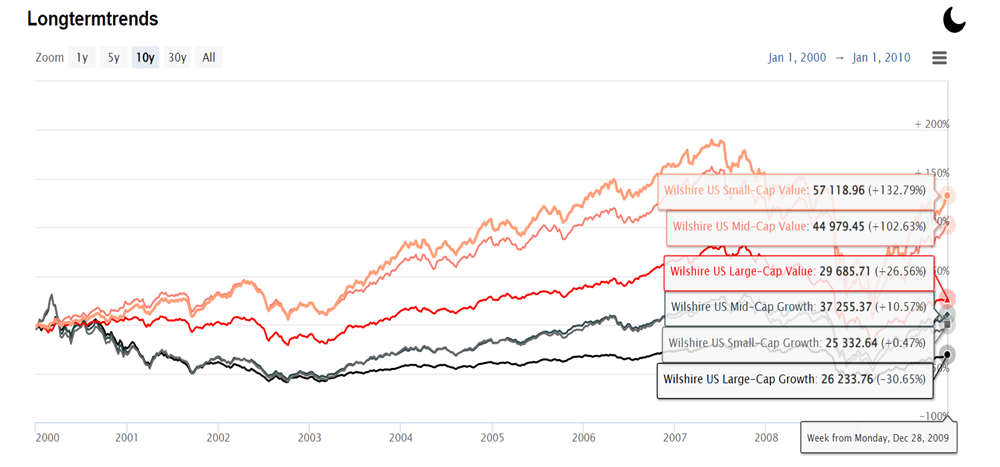
As of the summer of 2022, the Consumer Price Index (CPI) for all urban consumers had increased 9.1% year over year. The last time the official CPI was at this level was during the last half of the 1970s. During this time period, 10-year bonds ranged in interest rates from around 7% to around 16%, the Fed funds rate was moved up and down with the U.S. presidential election cycle from around 5% to nearly 20%, and there was no quantitative easing.
Here’s the CPI-U:
MacroTrends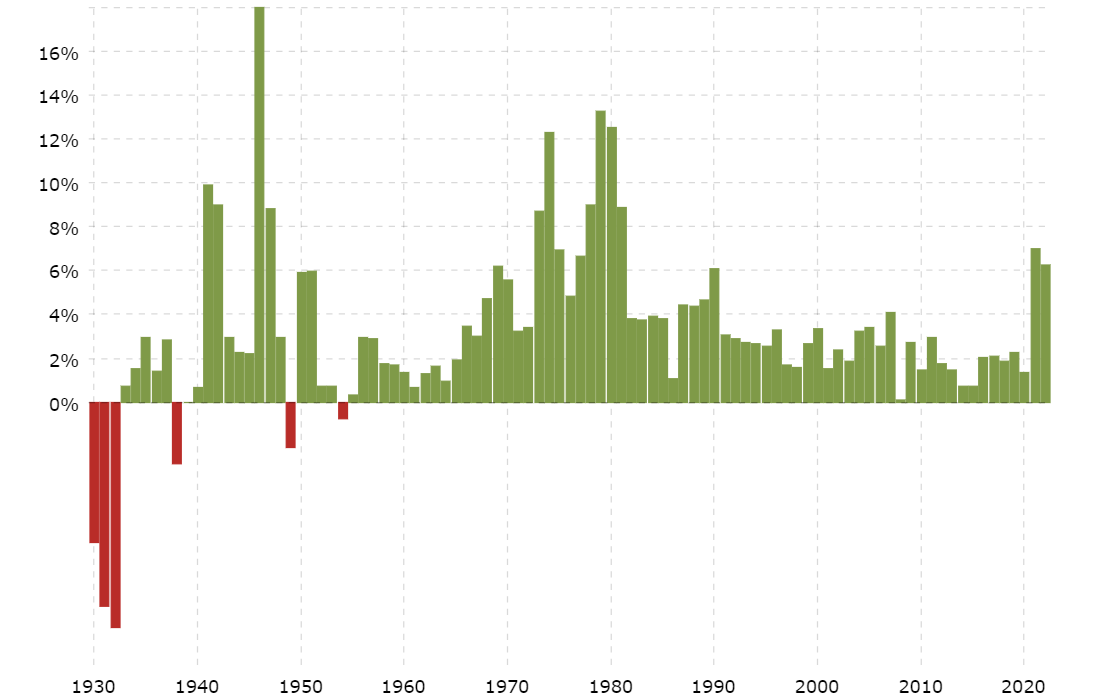
And the 10-year bond:
MacroTrends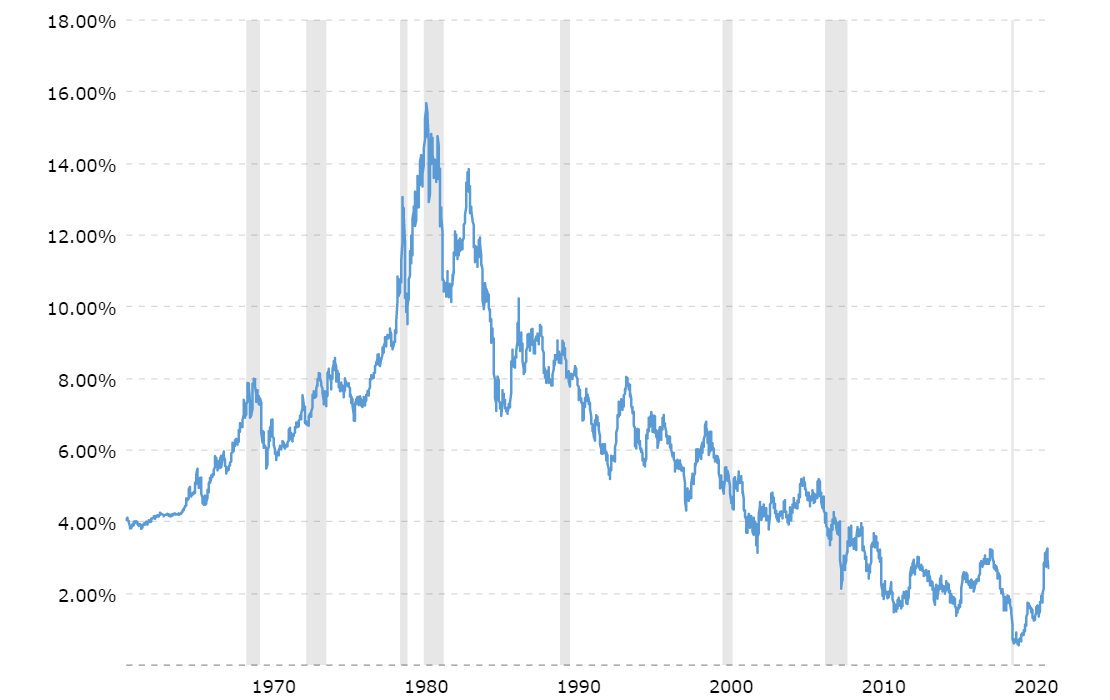
FRED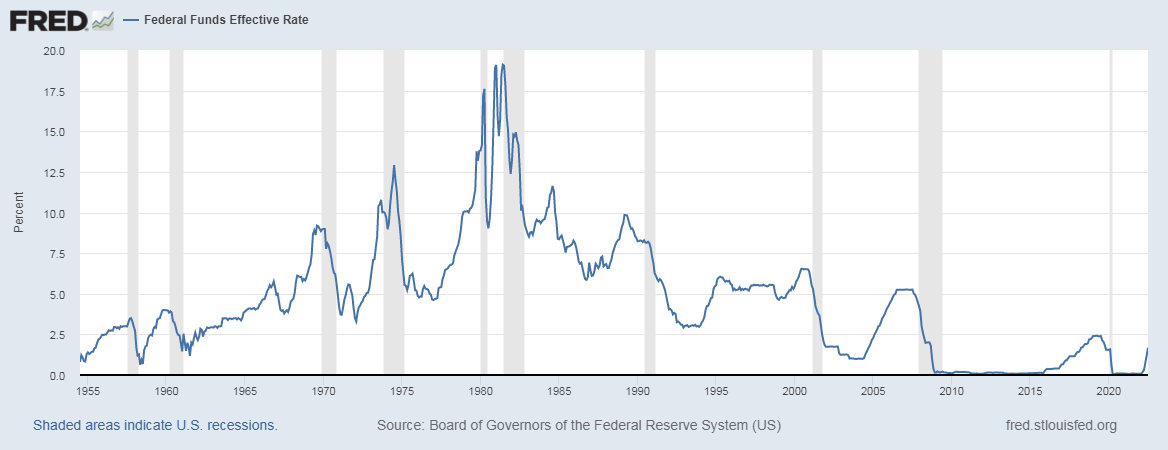
Given that the Fed funds rate currently sits at below 3% and the massive COVID-era purchases of long-term debt on the Fed’s balance sheet are still suppressing 10-year bond rates to around 3%, it seems unlikely that inflation will be under control anytime in the near future.
FRED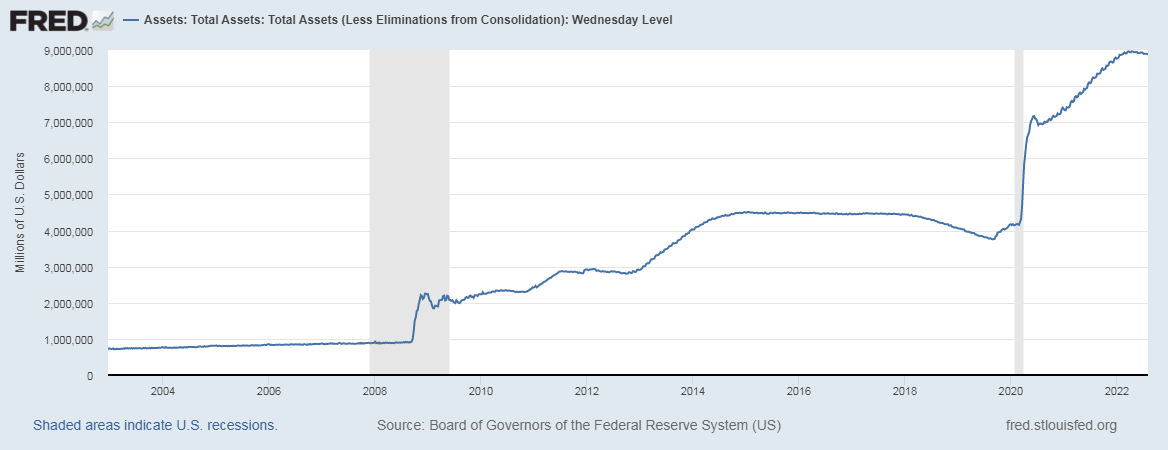
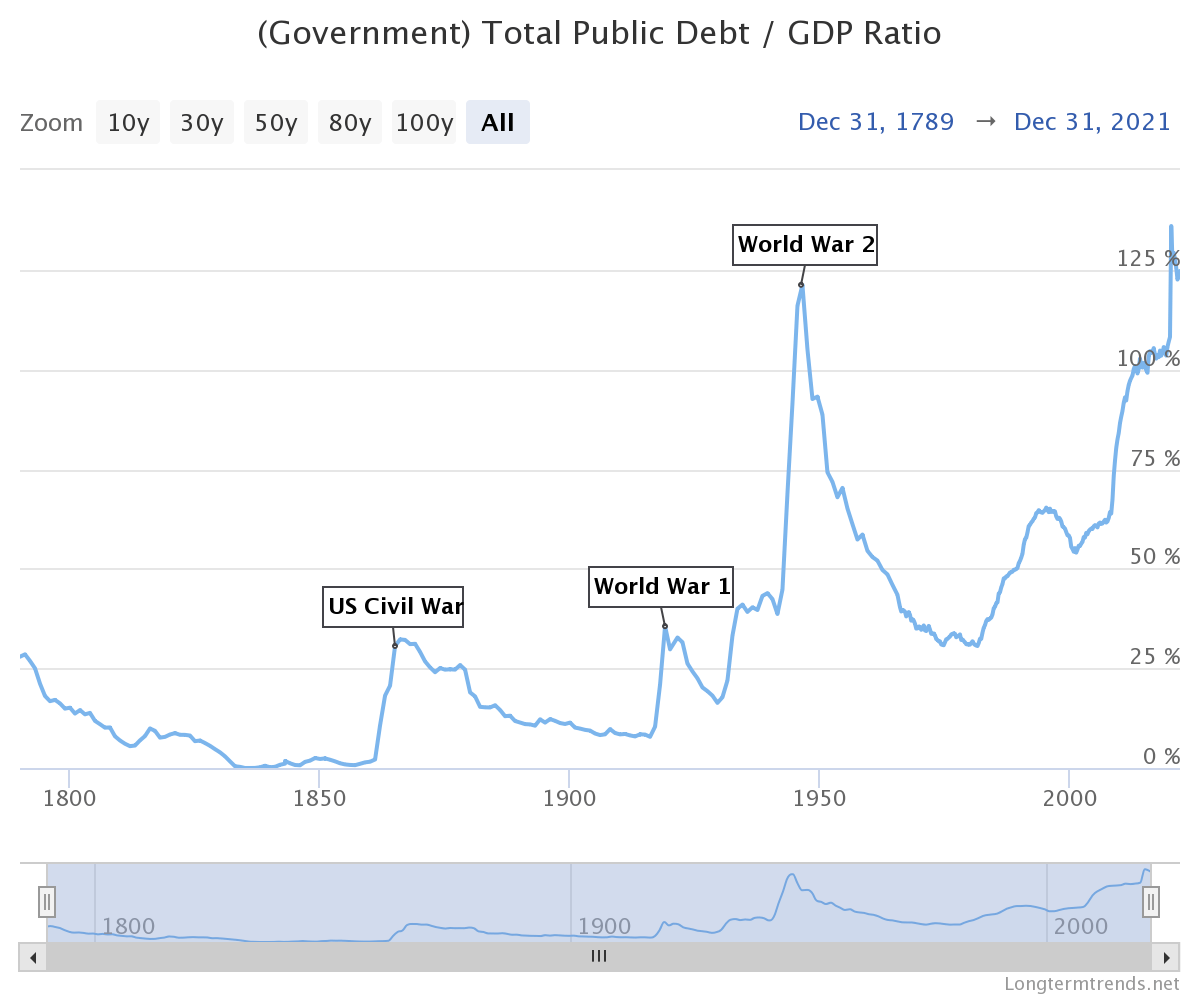
However, given that both the debt/GDP ratio of the U.S. taxpayer and the U.S. government is much higher than what it was in the 1970s, it might be easier to curtail inflation now than it was in the 1970s by more quickly driving the U.S. economy into a recession. It is also true that the U.S. government will be less likely to increase interest rates on itself today than it was in the 1970s, since a small increase in interest rates will result in a very large increase in U.S. government interest payments on the national debt.
Open Democracy Net Long Term Trends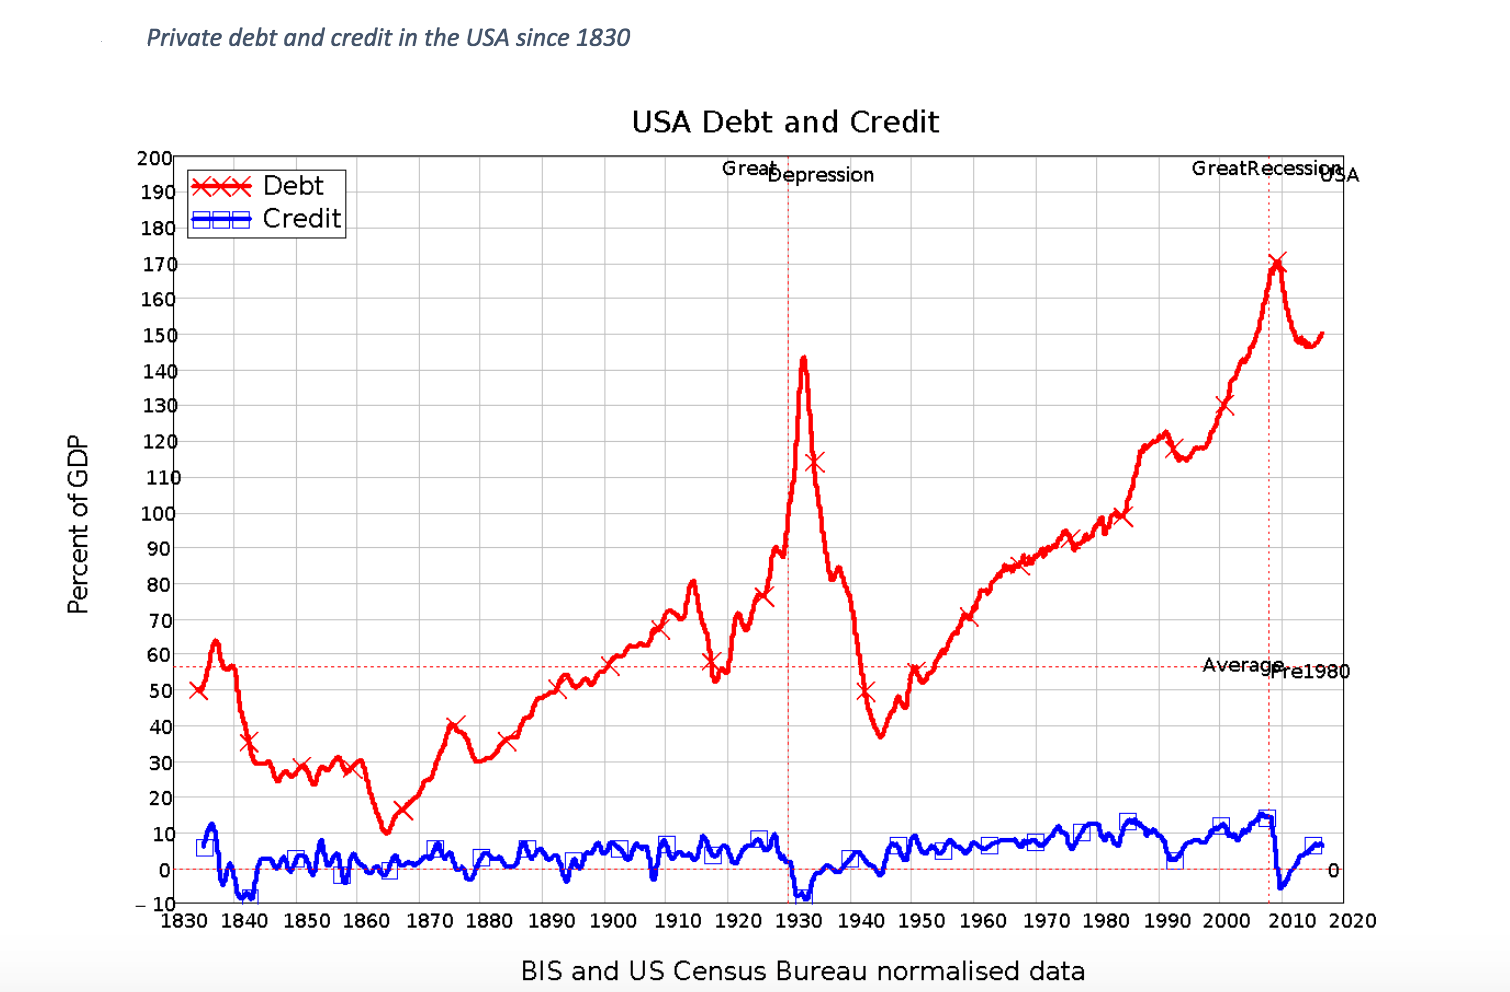
As the Federal Reserve was forced to increase interest rates to fight inflation in the 1970s, the P/E ratio of the S&P 500 was suppressed as stock market investments were forced to compete with higher yielding bonds. P/E compression also occurred in the 2000s with the bursting of the speculative mania of first the dot-com bubble and later the housing bubble.
Long Term Trends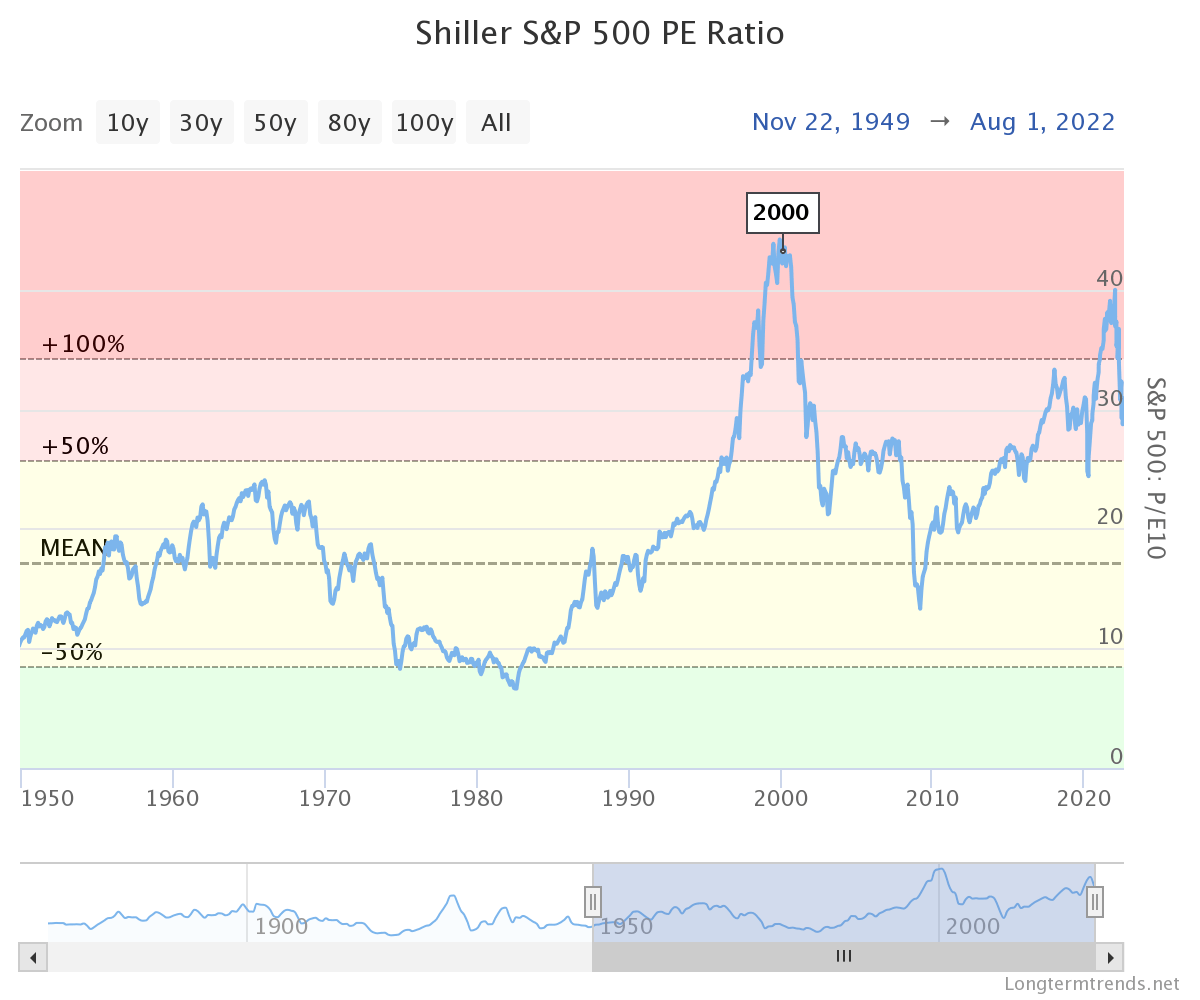
As of 2022, the U.S. stock market is coming off of a second, but less extreme, dot-com-style bubble during a period of drastically increasing inflation. While a multi-year bounce back to recent highs in the S&P around the end of 2023 is possible (see presidential election cycle theory), the next decade looks dismal for at least the growth stock portion of the U.S. stock market. The value stock portion of the U.S. stock market has a more positive outlook and did relatively well after the dot-com bubble, as I discussed in a separate post.
Long Term Trends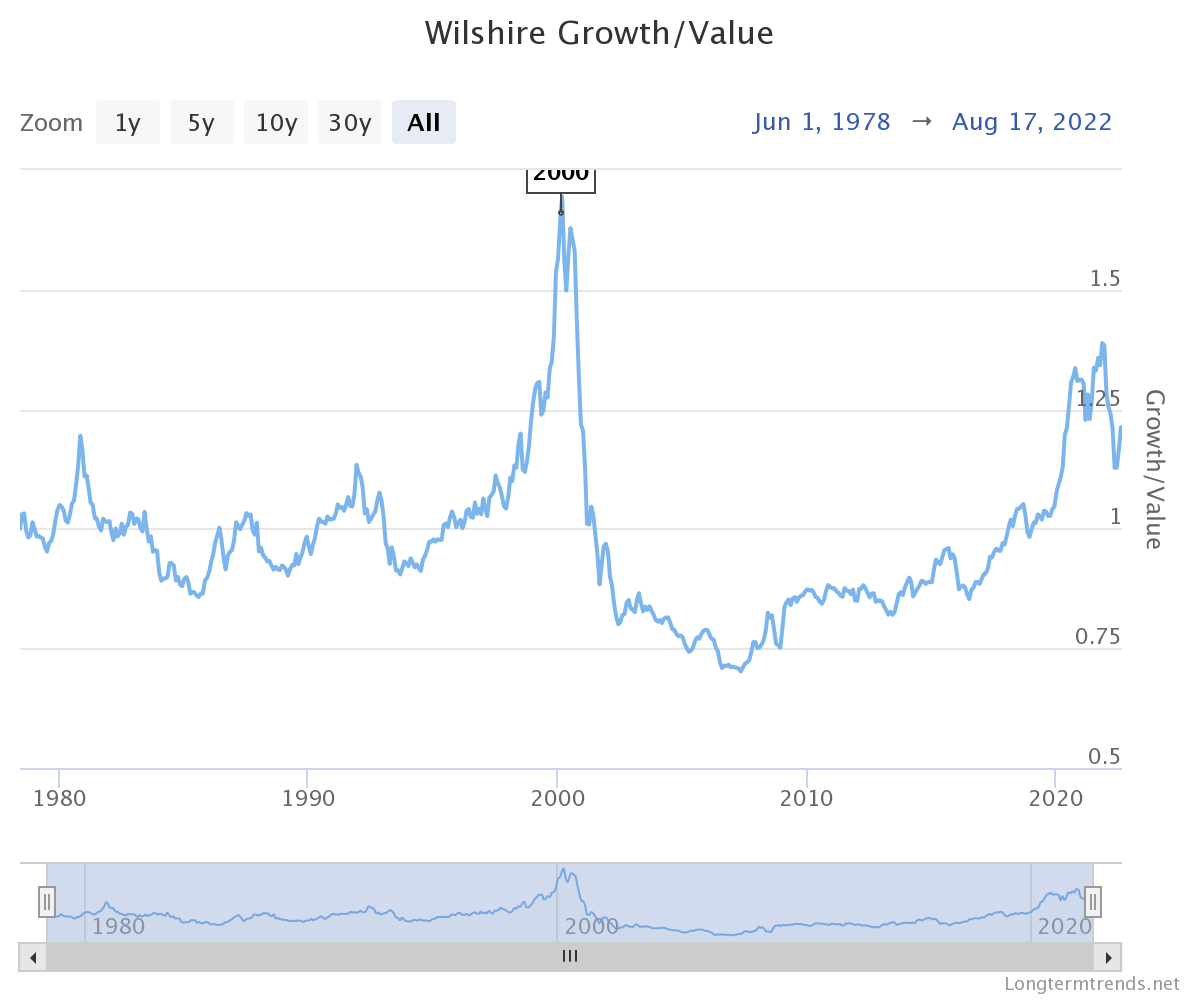
The future outlook for many international markets looks far more positive than the future outlook for the U.S. stock market. The website GuruFocus attempts to project future rates of return for the 26 largest economies in the world using three factors, as follows:
- Future business growth: We assume that average future growth will be the same as past growth. This may overestimate growth for fast-growing economies.
- Dividends: The average future dividends per year in the next five years will be equal to the average of the last five years. This may underestimate dividend yield as in general, dividends will grow as economies grow.
- Change in market valuation: A big assumption here in the market valuation is that the ratio of market cap to GDP will revert to its previous mean during a full market cycle, which will last 7-8 years.
Total investment return is given by:
Investment Return (%) = Dividend Yield (%) + Business Growth (%) + Change of Valuation (%)
Guru Focus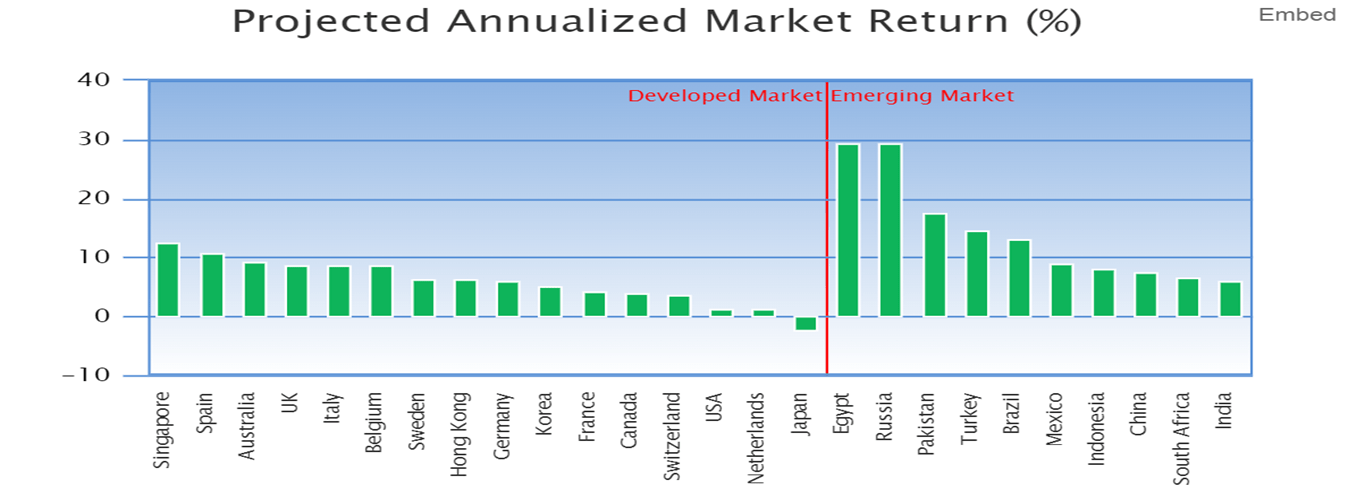
These projections do not look good for the U.S., the Netherlands, or Japan, but look pretty good for much of Europe, the emerging markets, and Asia ex-Japan. There is probably more uncertainty in the emerging market calculations than in the developed market calculations. Also, some emerging markets hold significant political risk. The freezing of assets invested in Russia, such as the VanEck Russia ETFs (RSX) (RSXJ), is a good recent example.
Vanguard offers an excellent series of low-fee global ETFs. The table below shows the region and country components of Vanguard Total World Stock Index Fund (VT), the Vanguard European Stock Index Fund (VGK), the Vanguard Pacific Stock Index Fund (VPL), and the Vanguard Emerging Markets Stock Index Fund (VWO).
|
VT Regions |
VT Top Countries |
VGK Top Countries |
VPL Top Countries |
VWO Top Countries |
|
North America 63.60% |
United States 59.65% |
Switzerland 14.69% |
Japan 55.37% |
India 15.64% |
|
Europe 15.5% |
Japan 6.14% |
Germany 12.59% |
Australia 19.15% |
China 7.00% |
|
Pacific 10.8% |
UK 4.05% |
Netherlands 6.31% |
South Korea 13.68% |
Brazil 6.70% |
|
Emerging Markets 9.9% |
Hong Kong 3.47% |
Sweden 5.62% |
Hong Kong 7.03% |
Saudi Arabia 4.84% |
|
Middle East 0.2% |
Canada 3.19% |
Denmark 3.98% |
Singapore 3.41% |
South Africa 4.20% |
|
France 2.48% |
Spain 3.97% |
New Zealand 0.89% |
Thailand 2.66% |
|
|
Switzerland 2.32% |
Italy 3.96% |
United States 0.30% |
Mexico 2.54% |
|
|
Australia 2.12% |
Finland 1.76% |
Ireland 0.15% |
Indonesia 2.00% |
Given the dismal outlook for United States stocks, I recommend that U.S. investors underweight U.S. stocks and overweight European and emerging markets stocks. The benchmark to use for overweighting and underweighting these stocks is a more complicated issue.
The U.S. is now around 40% of the worldwide investable stock market, but only around 25% of the world’s GDP. VT, which tracks the FTSE Global All Cap Index, is currently around 60% U.S. stocks. It’s worth noting that most investors, including Americans, have a tendency to engage in home country bias – i.e., to overweight their own country’s investment opportunities.
A Morgan Stanley study from 2021 examined issues including GDP weightings, market weighting, and modern portfolio theory. The study recommends emerging market weightings between 17% and 39%, favoring the higher end.
Using the FTSE Global All Cap Index as our base, incorporating an average of the Morgan Stanley emerging markets recommendations, and considering the arguments put forth in this article for U.S. value stocks, we propose the following model portfolio – which also slightly favors small-cap stocks in the U.S.
|
USA |
Base (%) |
Recommended (%) |
|
|
Vanguard Value Index Fund (VTV) |
Overweight |
26 |
28 |
|
Vanguard Mid-Cap Value Index Fund (VOE) |
Overweight |
3 |
5 |
|
Vanguard Small Cap Value Index Fund (VBR) |
Overweight |
1 |
4 |
|
Vanguard Growth Index Fund (VUG) |
Underweight |
26 |
11 |
|
Vanguard Mid-Cap Growth Index Fund (VOT) |
Underweight |
3 |
2 |
|
Vanguard Small Cap Growth Index Fund (VBK) |
Underweight |
1 |
0 |
|
International |
|||
|
Vanguard European Stock Index Fund |
Overweight |
16 |
19 |
|
Vanguard Pacific Stock Index Fund |
Equal Weight |
11 |
11 |
|
Vanguard Emerging Markets Stock Index Fund |
Overweight |
10 |
20 |
The 3% missing from the base is due to Canada being included in VT, but not in the U.S. ETFs. The equal weight rating for VPL (as opposed to an overweight rating) is due to VPL’s high concentration in Japanese stocks. Allocations to the Vanguard High Dividend Yield Index Fund (VYM) and the Vanguard International High Dividend Yield Fund (VYMI) could also be beneficial for those desirous of current income.
Here’s a look at global equity market capitalization in 2022:
SIFMA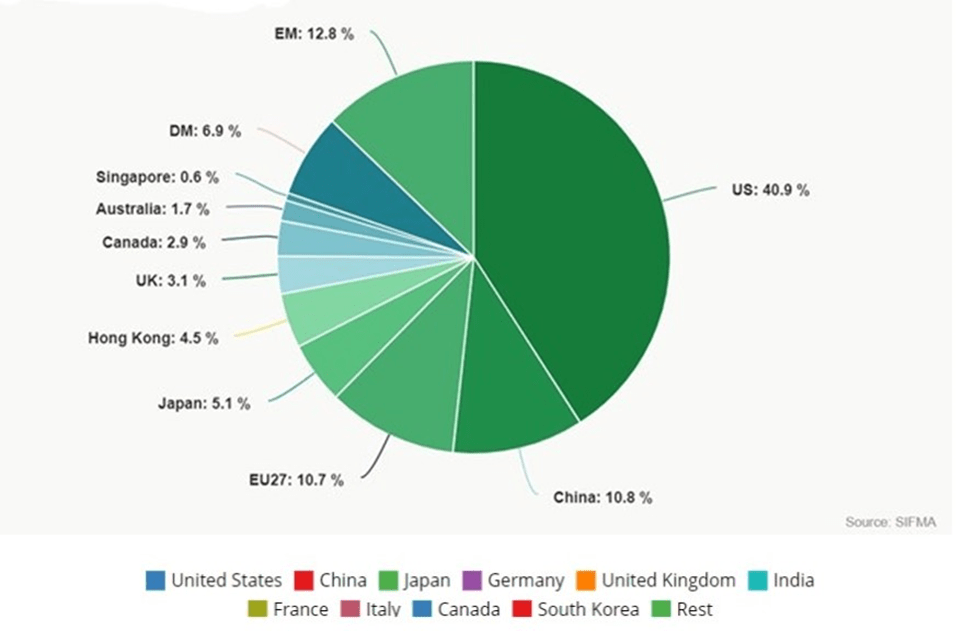
And here are world countries by GDP in 2022:
SIFMA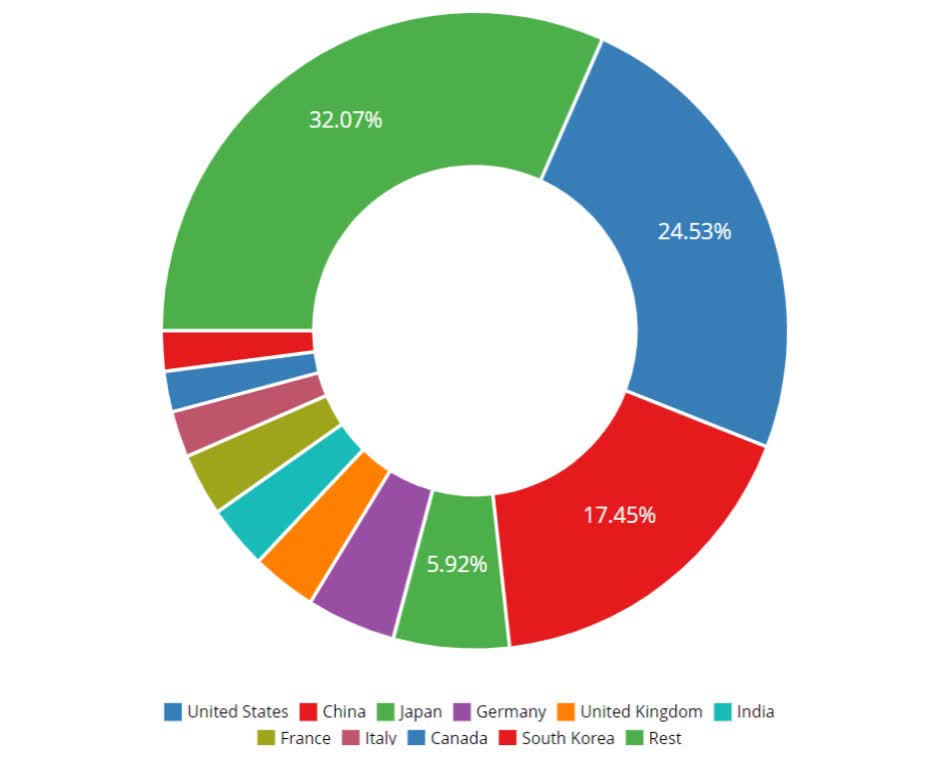
Like all forward-looking investment recommendations, this one is not perfect or completely rigorous. For most Americans, suffering from home country bias, the best recommendation is simply to include more international and fewer domestic investments in their portfolio than they currently own.
Be the first to comment