

Daniel Grizelj
The dollar index measures the US currency against other world reserve currencies. While the index includes the euro, British pound, Japanese yen, Canadian dollar, Swedish krona, and Swiss franc, the moves in the euro versus the US dollar exchange rate dominate the index. The dollar index has a 57.6% weighting to the euro versus the dollar currency pair.
The current bullish trend in the dollar index began in early 2021 when the index reached a bottom at 89.165. Since then, the index has made higher lows and higher highs, reaching nearly the 110 level on September 1, 2022. Currency trends often last for years, and the bullish trend in the US dollar continues to take it to new multi-year highs as we head toward 2022’s final months.
The Invesco DB USD Bullish Fund (NYSEARCA:UUP) moves higher and lower with the index, while the UDN product operates inversely.
New two-decade highs in the dollar index
The dollar index futures contract reached a low of 89.165 in early January 2021. Since then, the index has made higher lows and higher highs, breaking out above a critical technical resistance level in May 2022.
ICE US Dollar Index Futures Contract (Barchart)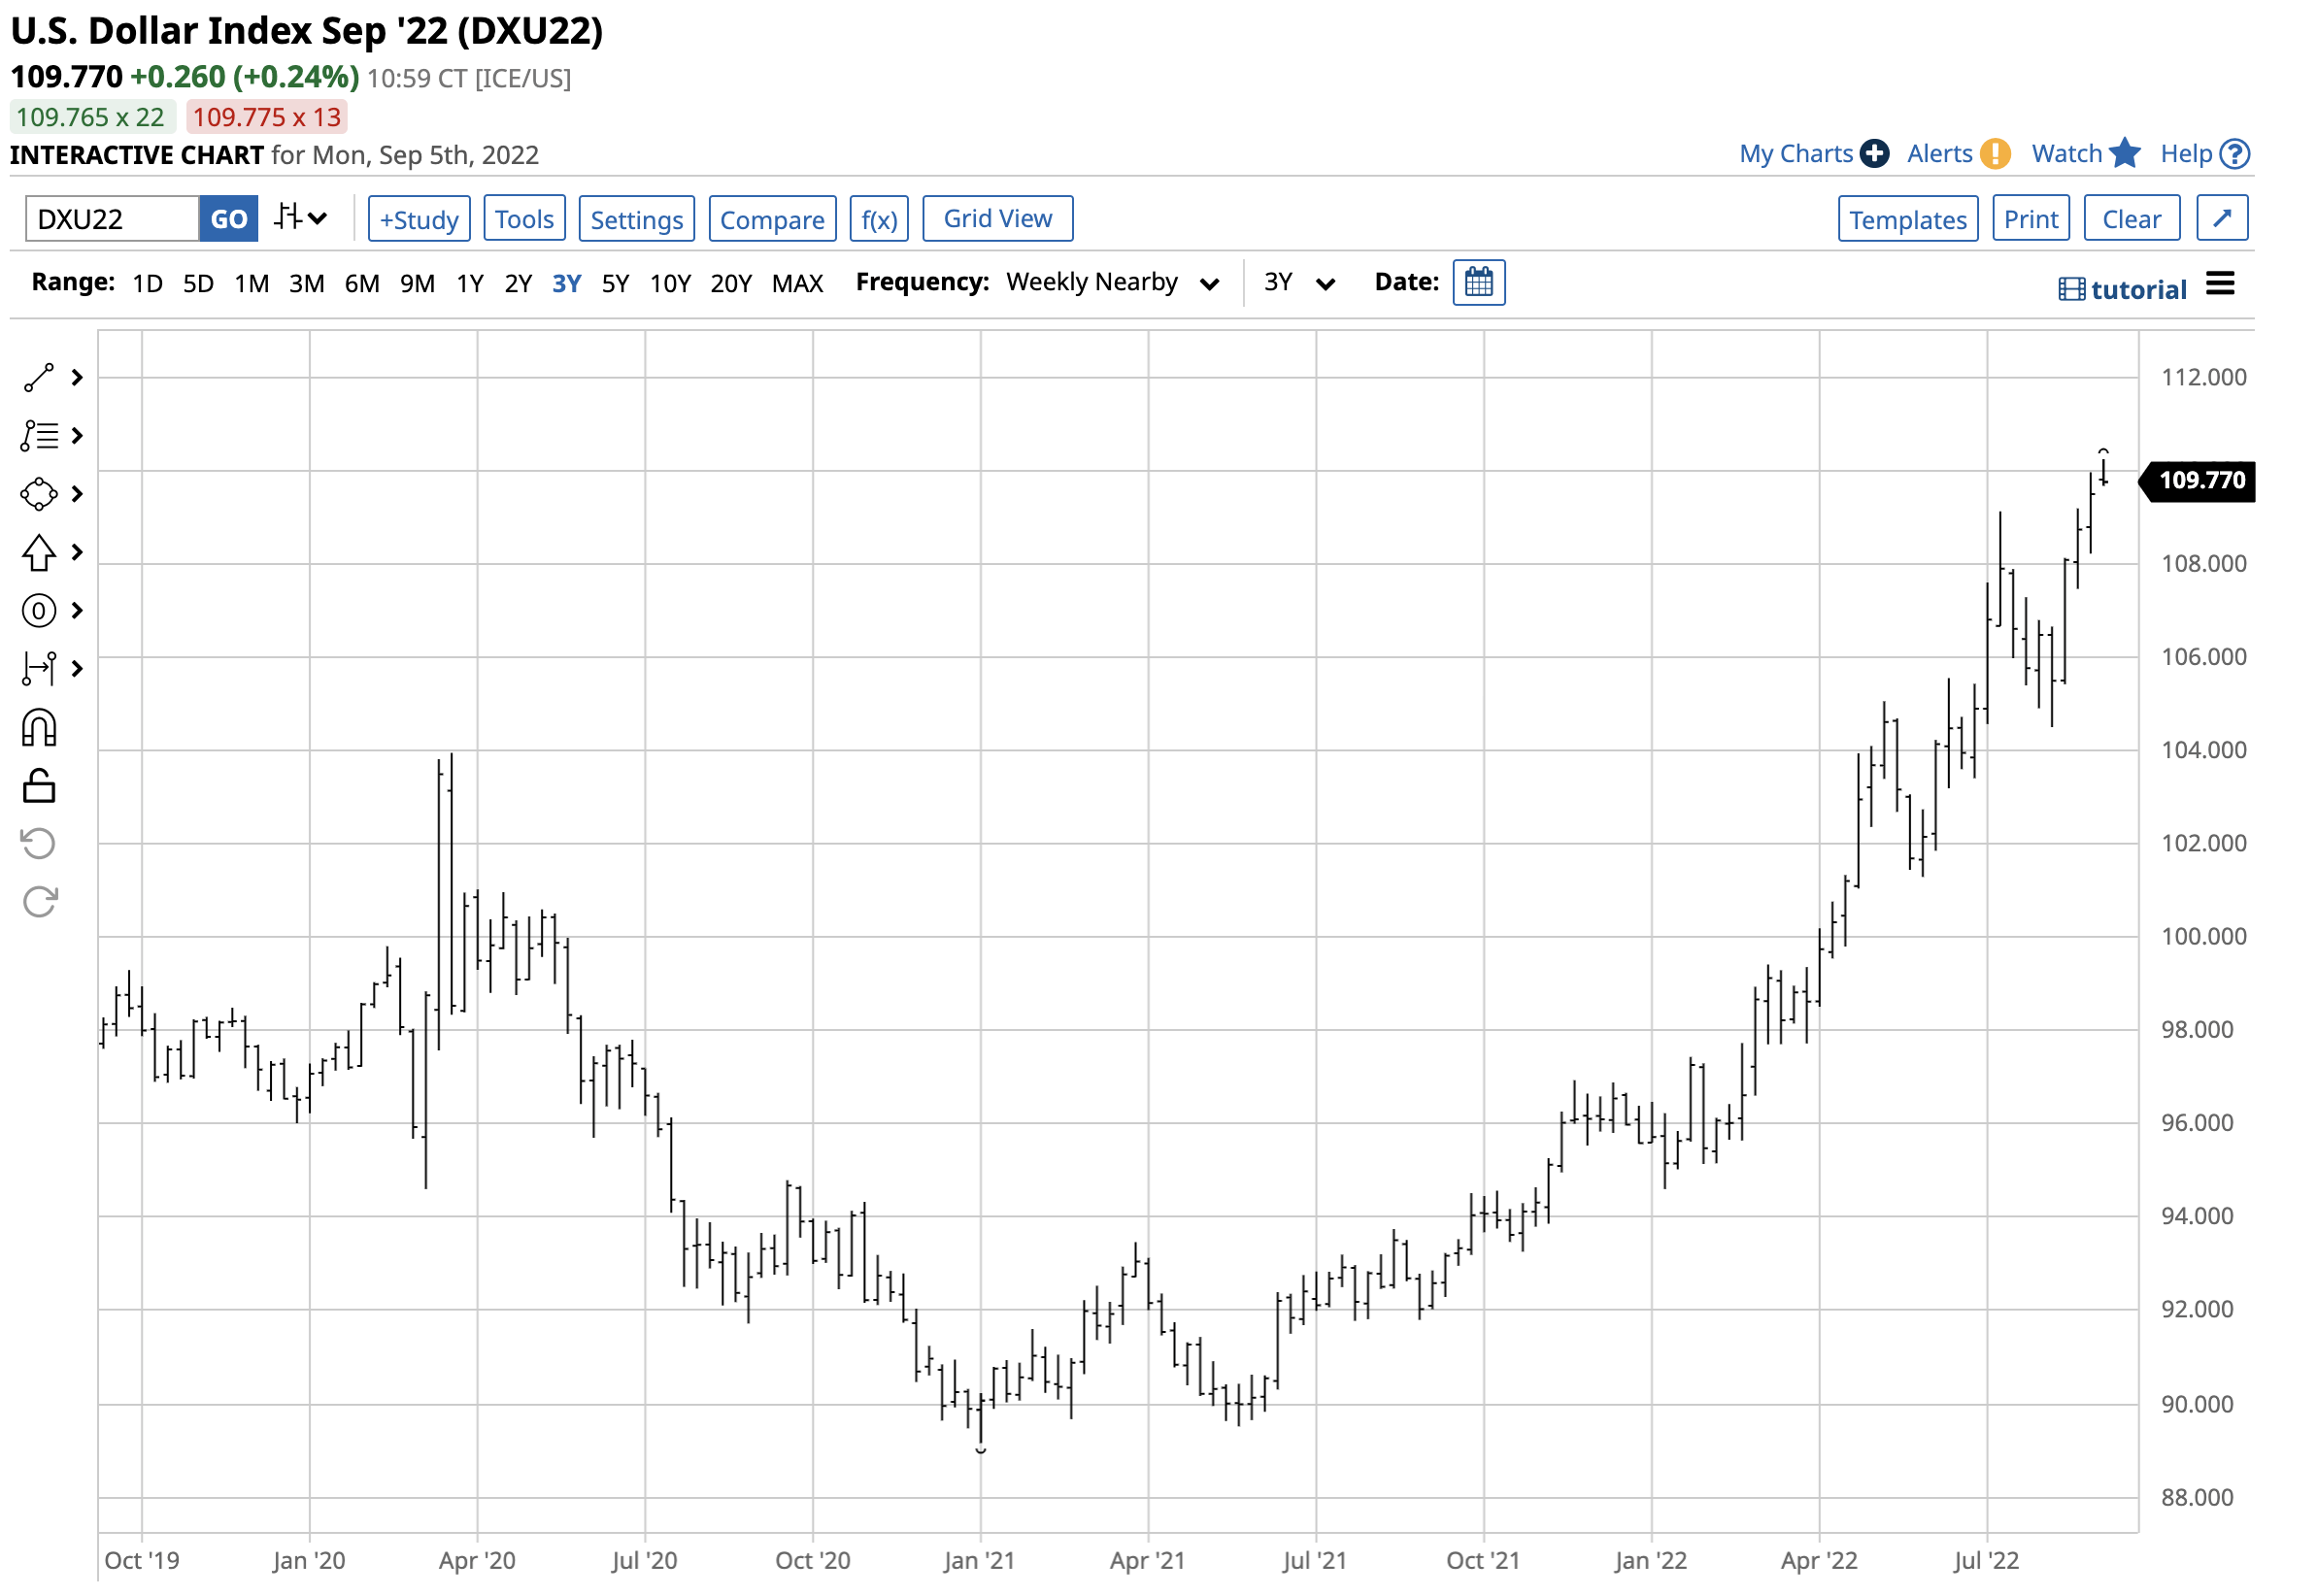
The chart highlights the technical breakout that took the dollar index to a 110.260 high on September 1. The last time the index was over 110 was in 2002. It closed at 109.510 on Friday, September 2, and made a new high on Monday, September 5.
The Fed remains committed to battling inflation
Interest rates are the primary driver of currency values when measuring one reserve foreign exchange instrument against another.
After calling rising inflation a “transitory” and pandemic-inspired event throughout most of 2021, the explosive rise in the US consumer and producer price indices caused the Fed to realize its dovish monetary policy and a tidal wave of government stimulus during the COVID-19 pandemic planted inflationary seeds that made the economic condition a structural issue. The Fed reversed course in late 2021, setting the stage for aggressive short-term interest rate hikes and initiating a program to reduce its swollen balance sheet by allowing debt securities to roll off at maturity. Quantitative easing gave way to quantitative tightening, pushing rates higher further out along the yield curve. As US interest rates rose, the US dollar strengthened as a higher yield made the dollar more attractive than the euro and other currencies in the dollar index.
Meanwhile, US GDP has experienced two consecutive quarterly declines, the textbook definition of a recession. Increasing interest rates to battle inflation chokes off economic growth. Therefore, addressing inflation with a hawkish money policy only exacerbates recessionary pressures. The Fed and Biden administration have called declining GDP an economic “transition” and run the same risk they did in 2021, characterizing rising prices as “transitory.”
At the recent Jackson Hole, Wyoming, annual conference, Fed Chairman Jerome Powell and other Fed economists reiterated their hawkish commitment to battling inflation via higher interest rates, ignoring the economic contraction. The latest August jobs data showed the unemployment rate edged higher to 3.7%, with nonfarm payrolls rising by 315,000, which was the market’s expectation. The employment data will not likely deter the central bank from increasing the Fed Funds rate by 50 or even 75 basis points at the upcoming September FOMC meeting.
The bottom line is that US monetary policy is one factor that lit a bullish fuse under the US dollar over the past months and sent it to the highest level in twenty years.
The euro’s bearish trend
Meanwhile, the war in Europe creates an almost perfect fundamental bullish case for the US dollar, which puts enormous pressure on the euro currency. It has been two decades since the euro traded at parity against the US dollar. The euro exchange rate against the US dollar was sitting below parity on September 5 after falling steadily since early 2021.
Euro versus the US dollar Currency Pair (Barchart)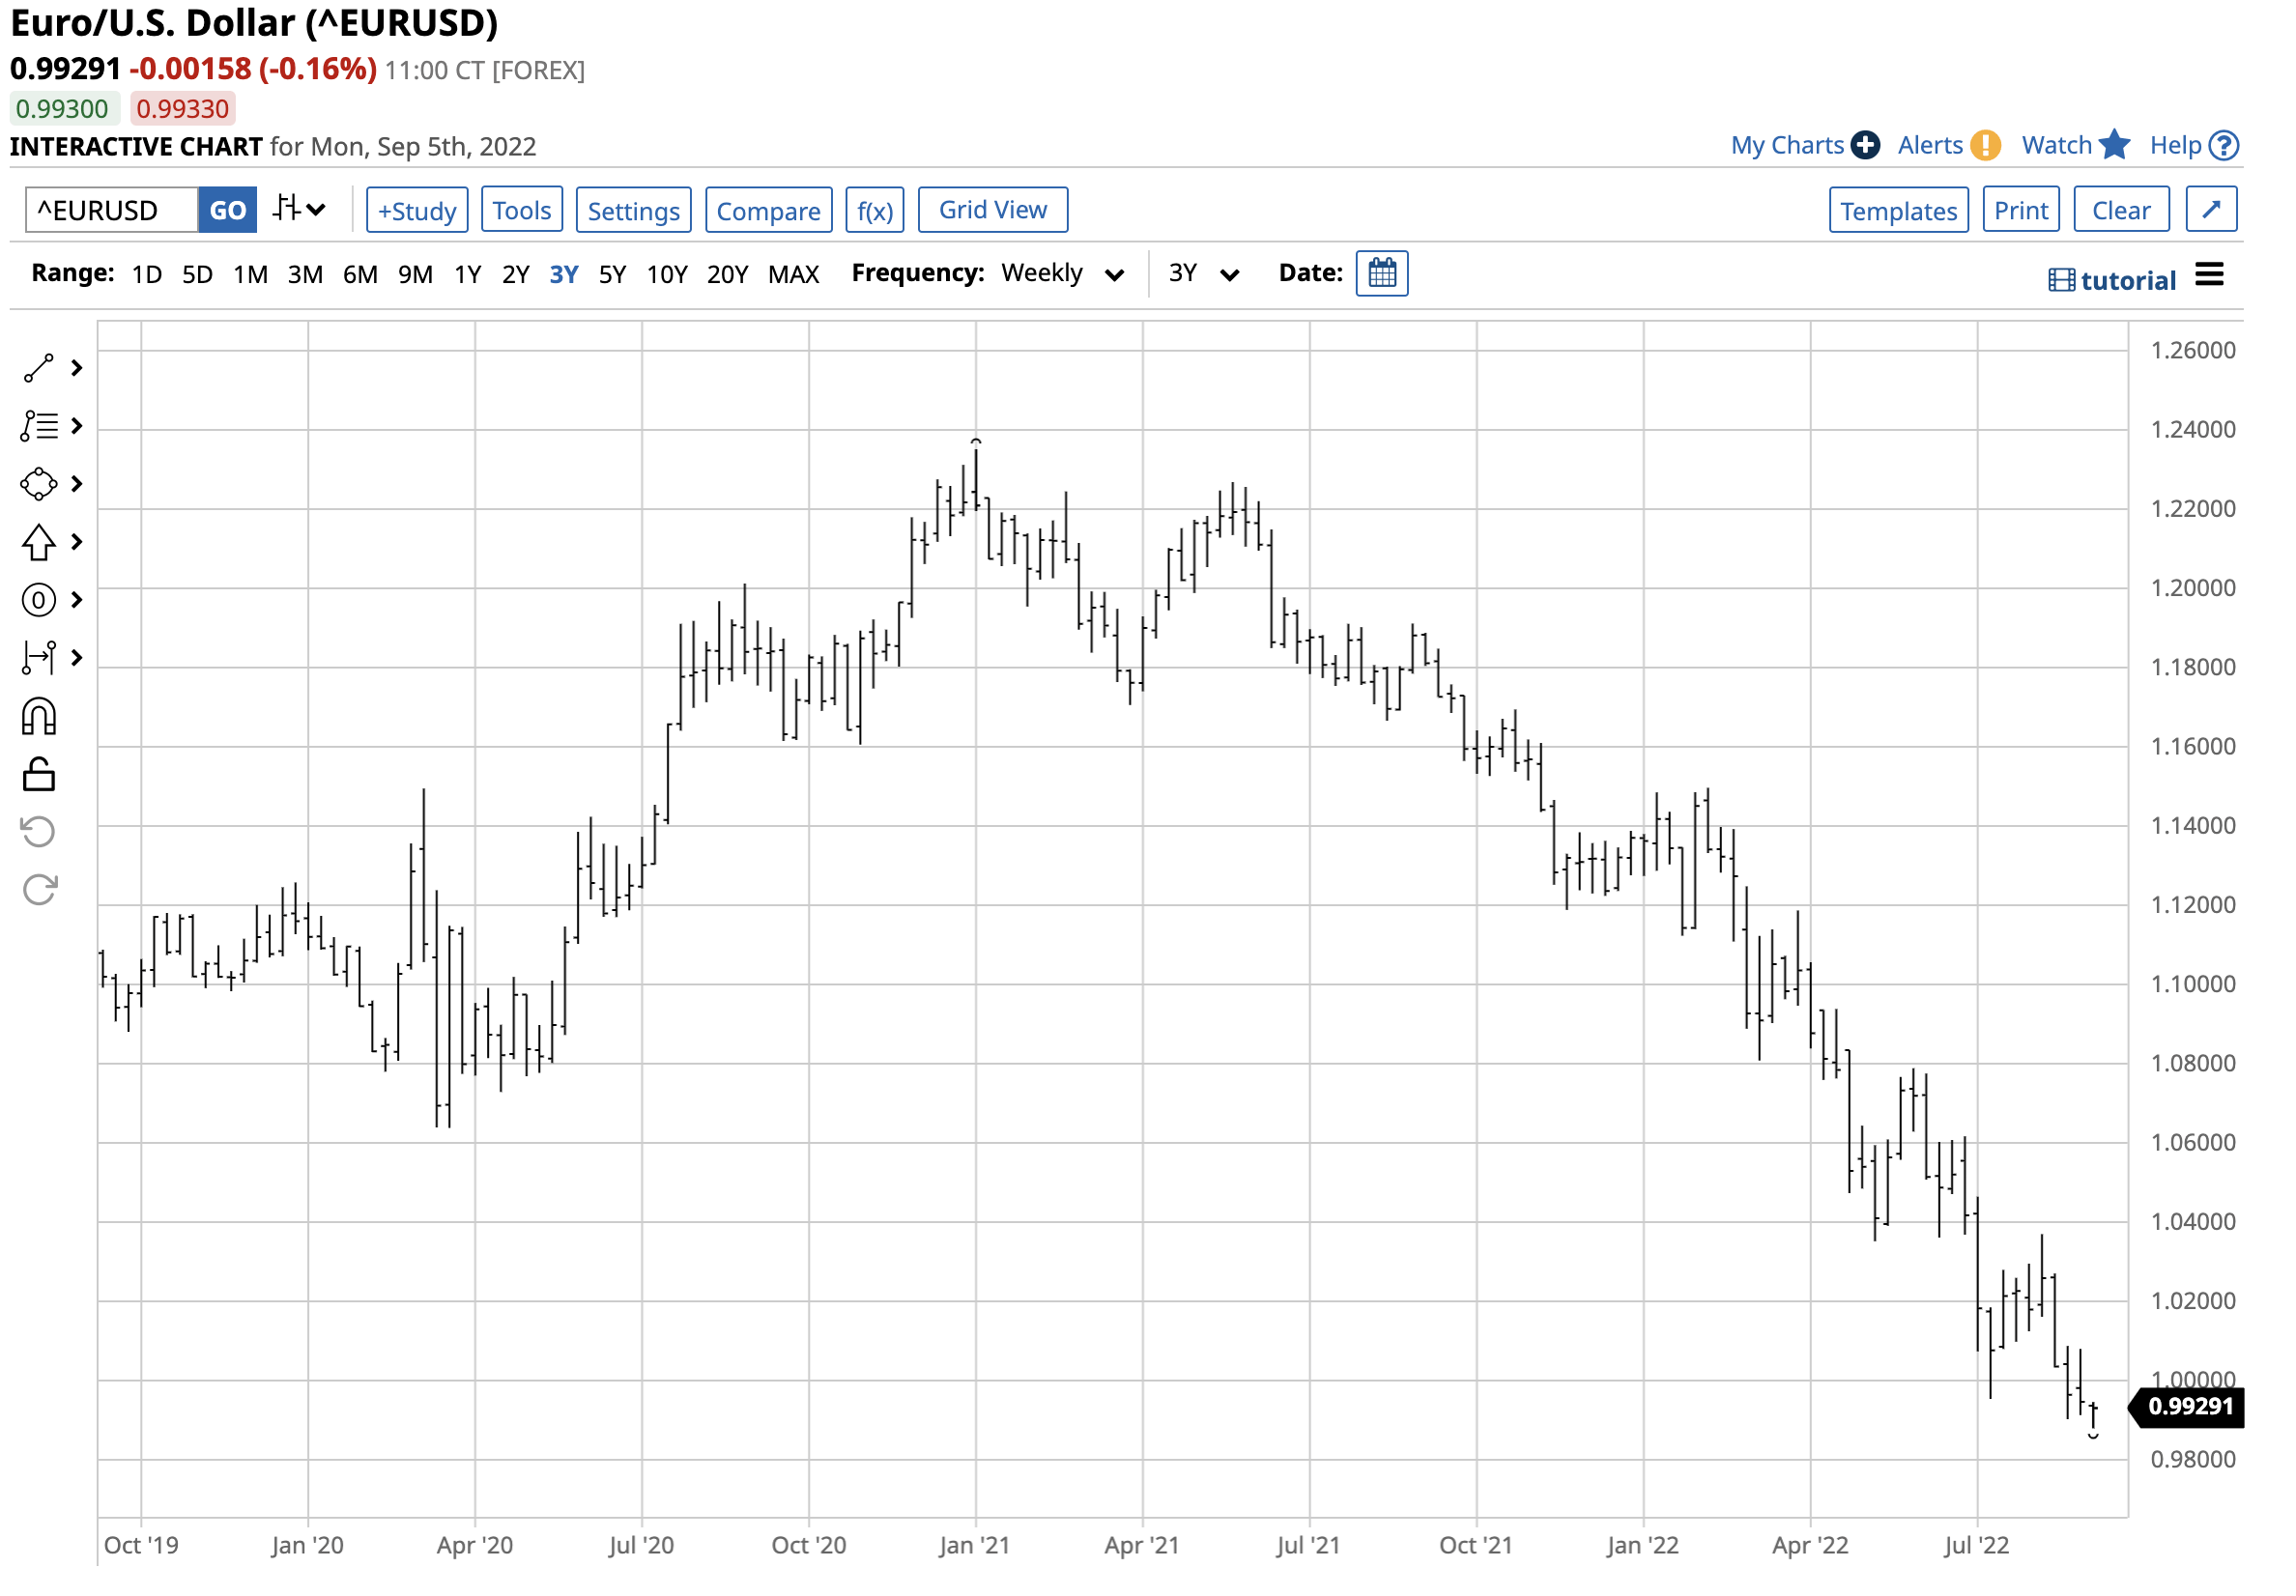
The chart shows the bearish path of least resistance of the euro versus the dollar since failing at $1.2349 in early January 2021, reaching its most recent low of $0.98785 on September 5.
The war between Russia and Ukraine is on Europe’s doorstep. With NATO countries supporting Ukraine and sanctioning Russia, the Russian have retaliated. Russia supplies Europe with traditional energy commodities, which have become a weapon in the economic war. Moreover, Ukraine and Russia are Europe’s breadbasket, impacting food supplies. In 2022, crude oil, natural gas, coal, corn, wheat, and other agricultural commodities and biofuel prices have soared. With Europe in Russia’s crosshairs and the potential for conflict crossing the Ukrainian border to the west, the euro currency has declined. Since the euro accounts for 57.6% of the dollar index, the war has only added downside pressure to the index, intensifying the impact of rising US interest rates.
Currency trends are slow and steady
The world’s governments manage currency markets to stabilize cross-border payments and the worldwide financial system. Therefore, currency volatility tends to be far lower than price variance in stocks, bonds, and commodity markets.
Weekly Historical Volatility of the E-Mini S&P 500 Futures Contract (CQG)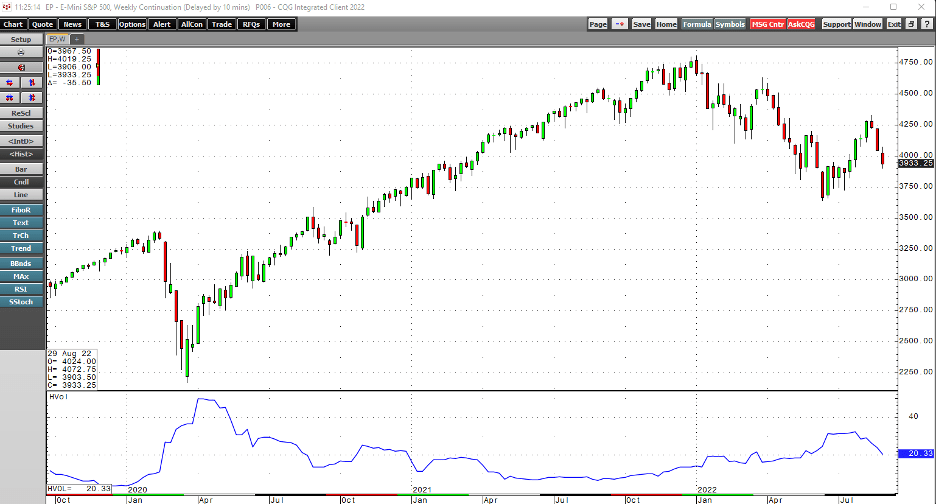
The chart highlights weekly historical volatility in the E-Mini S&P 500 futures contract stood at the 20.33% level on September 2, 2022.
Weekly Historical Volatility of the US Long Bond Futures Contract (CQG)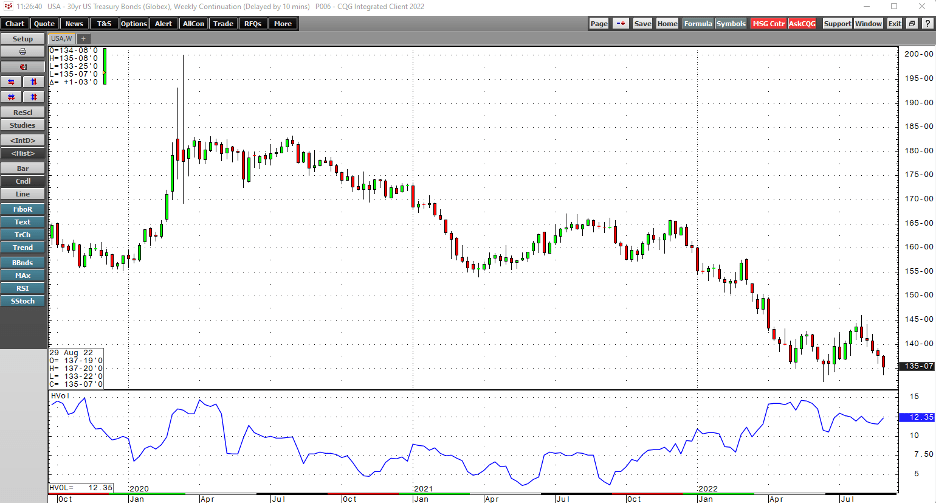
The weekly chart of the US government 30-Year Treasury bond futures illustrates a 12.35% historical price variance.
Weekly Historical Volatility of the NYMEX Crude Oil Futures Contract (CQG)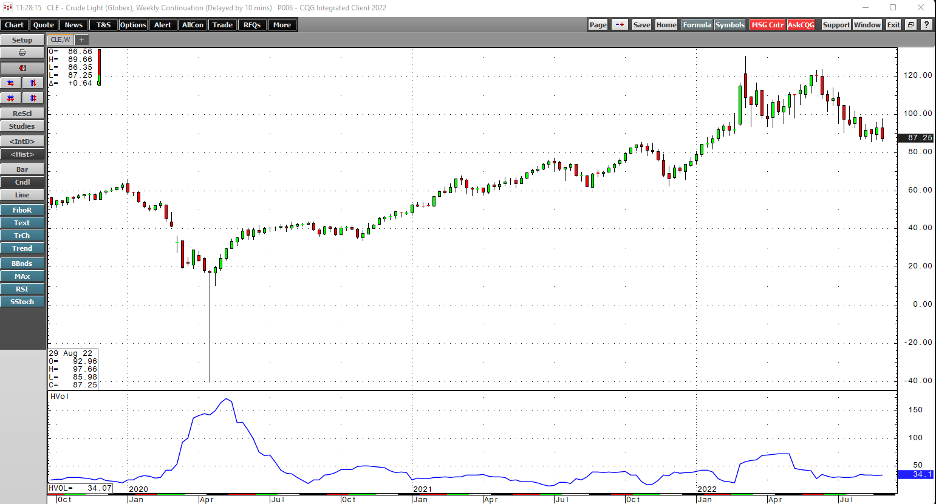
NYMEX WTI crude oil futures had a weekly historical volatility reading of 34.1% on September 2.
Weekly Historical Volatility of the ICE Dollar Index Futures Contract (CQG)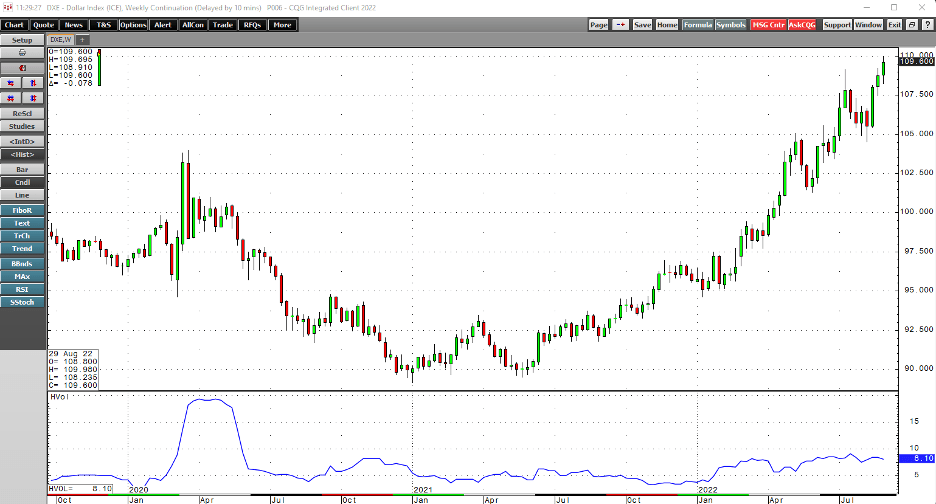
Meanwhile, the metric in the dollar index stood at 8.1%, reflecting the lack of wide price ranges in the foreign exchange arena between reserve currencies. While currency volatility is lower, currency trends tend to last for extended periods. The dollar index trended higher from 1992 through 2001 and lower from 2001 through 2008. The long-term pattern of higher lows and higher highs in the dollar index is now fourteen years old and shows no sign of running out of upside steam. Central banks, governments, and monetary authorities may look to slow the ascent of the US currency. Still, interest rate differentials and the war in Europe support the dollar against the constituent members of the index.
The UUP is the bullish dollar index ETF product
The most direct route for a risk position in the US dollar index is via the futures contracts on the Intercontinental Exchange (ICE). For those looking to participate in the dollar’s ascent without venturing into the futures market or the worldwide over-the-counter foreign exchange market, the Invesco DB USD Index Bullish Fund moves higher and lower with the index. UUP’s bearish counterpart, the UDN product, operates inversely.
At the $29.38 per share level on September 2, UUP had $2.051 billion in assets under management. The Fund trades an average of over 3.9 million shares daily and charges a 0.78% management fee. The bearish UDN product at $17.52 had $71.884 million in assets under management. UDN trades an average of 141,895 shares daily and charges a 0.77% expense ratio.
The dollar index rose from 89.165 in early 2021 to 109.980 on September 1, 2022, a 23.3% increase.
Chart of the UUP Bullish Dollar Index ETF Product (Barchart)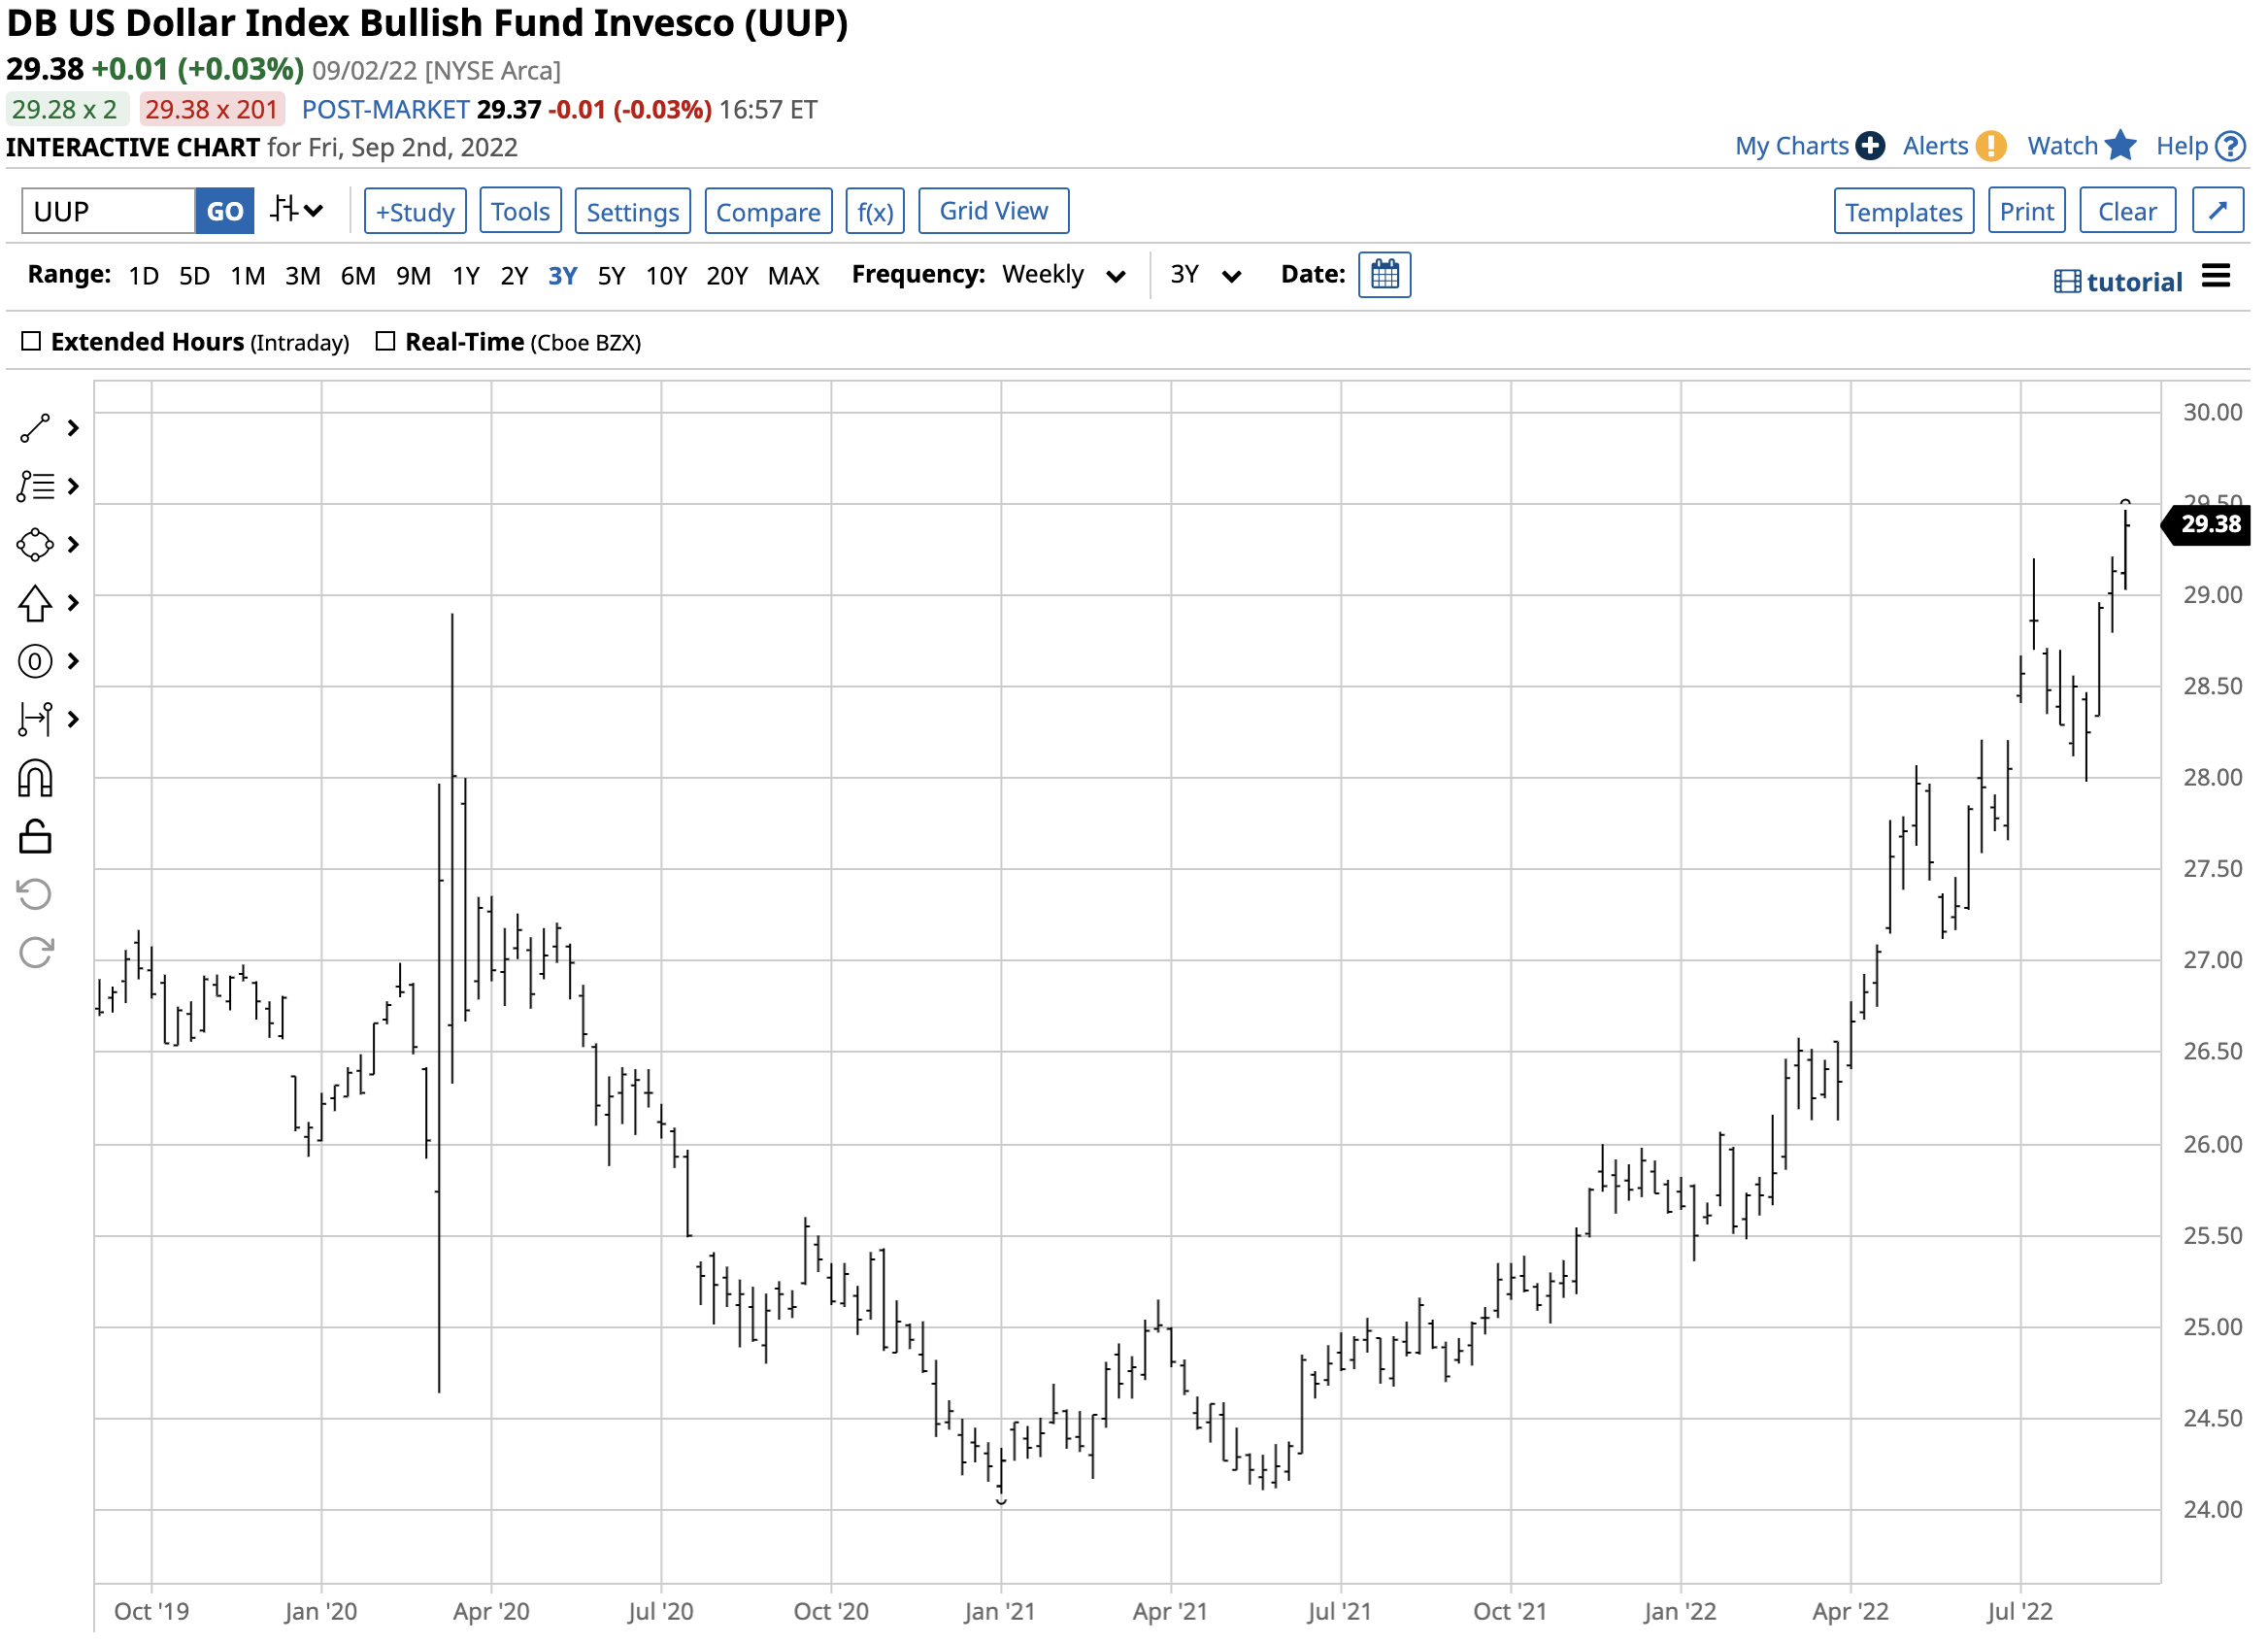
Over the same period, UUP rose from $24.09 to $29.47 per share or 22.3%.
Chart of UDN Bearish US Dollar Index ETF Product (Barchart)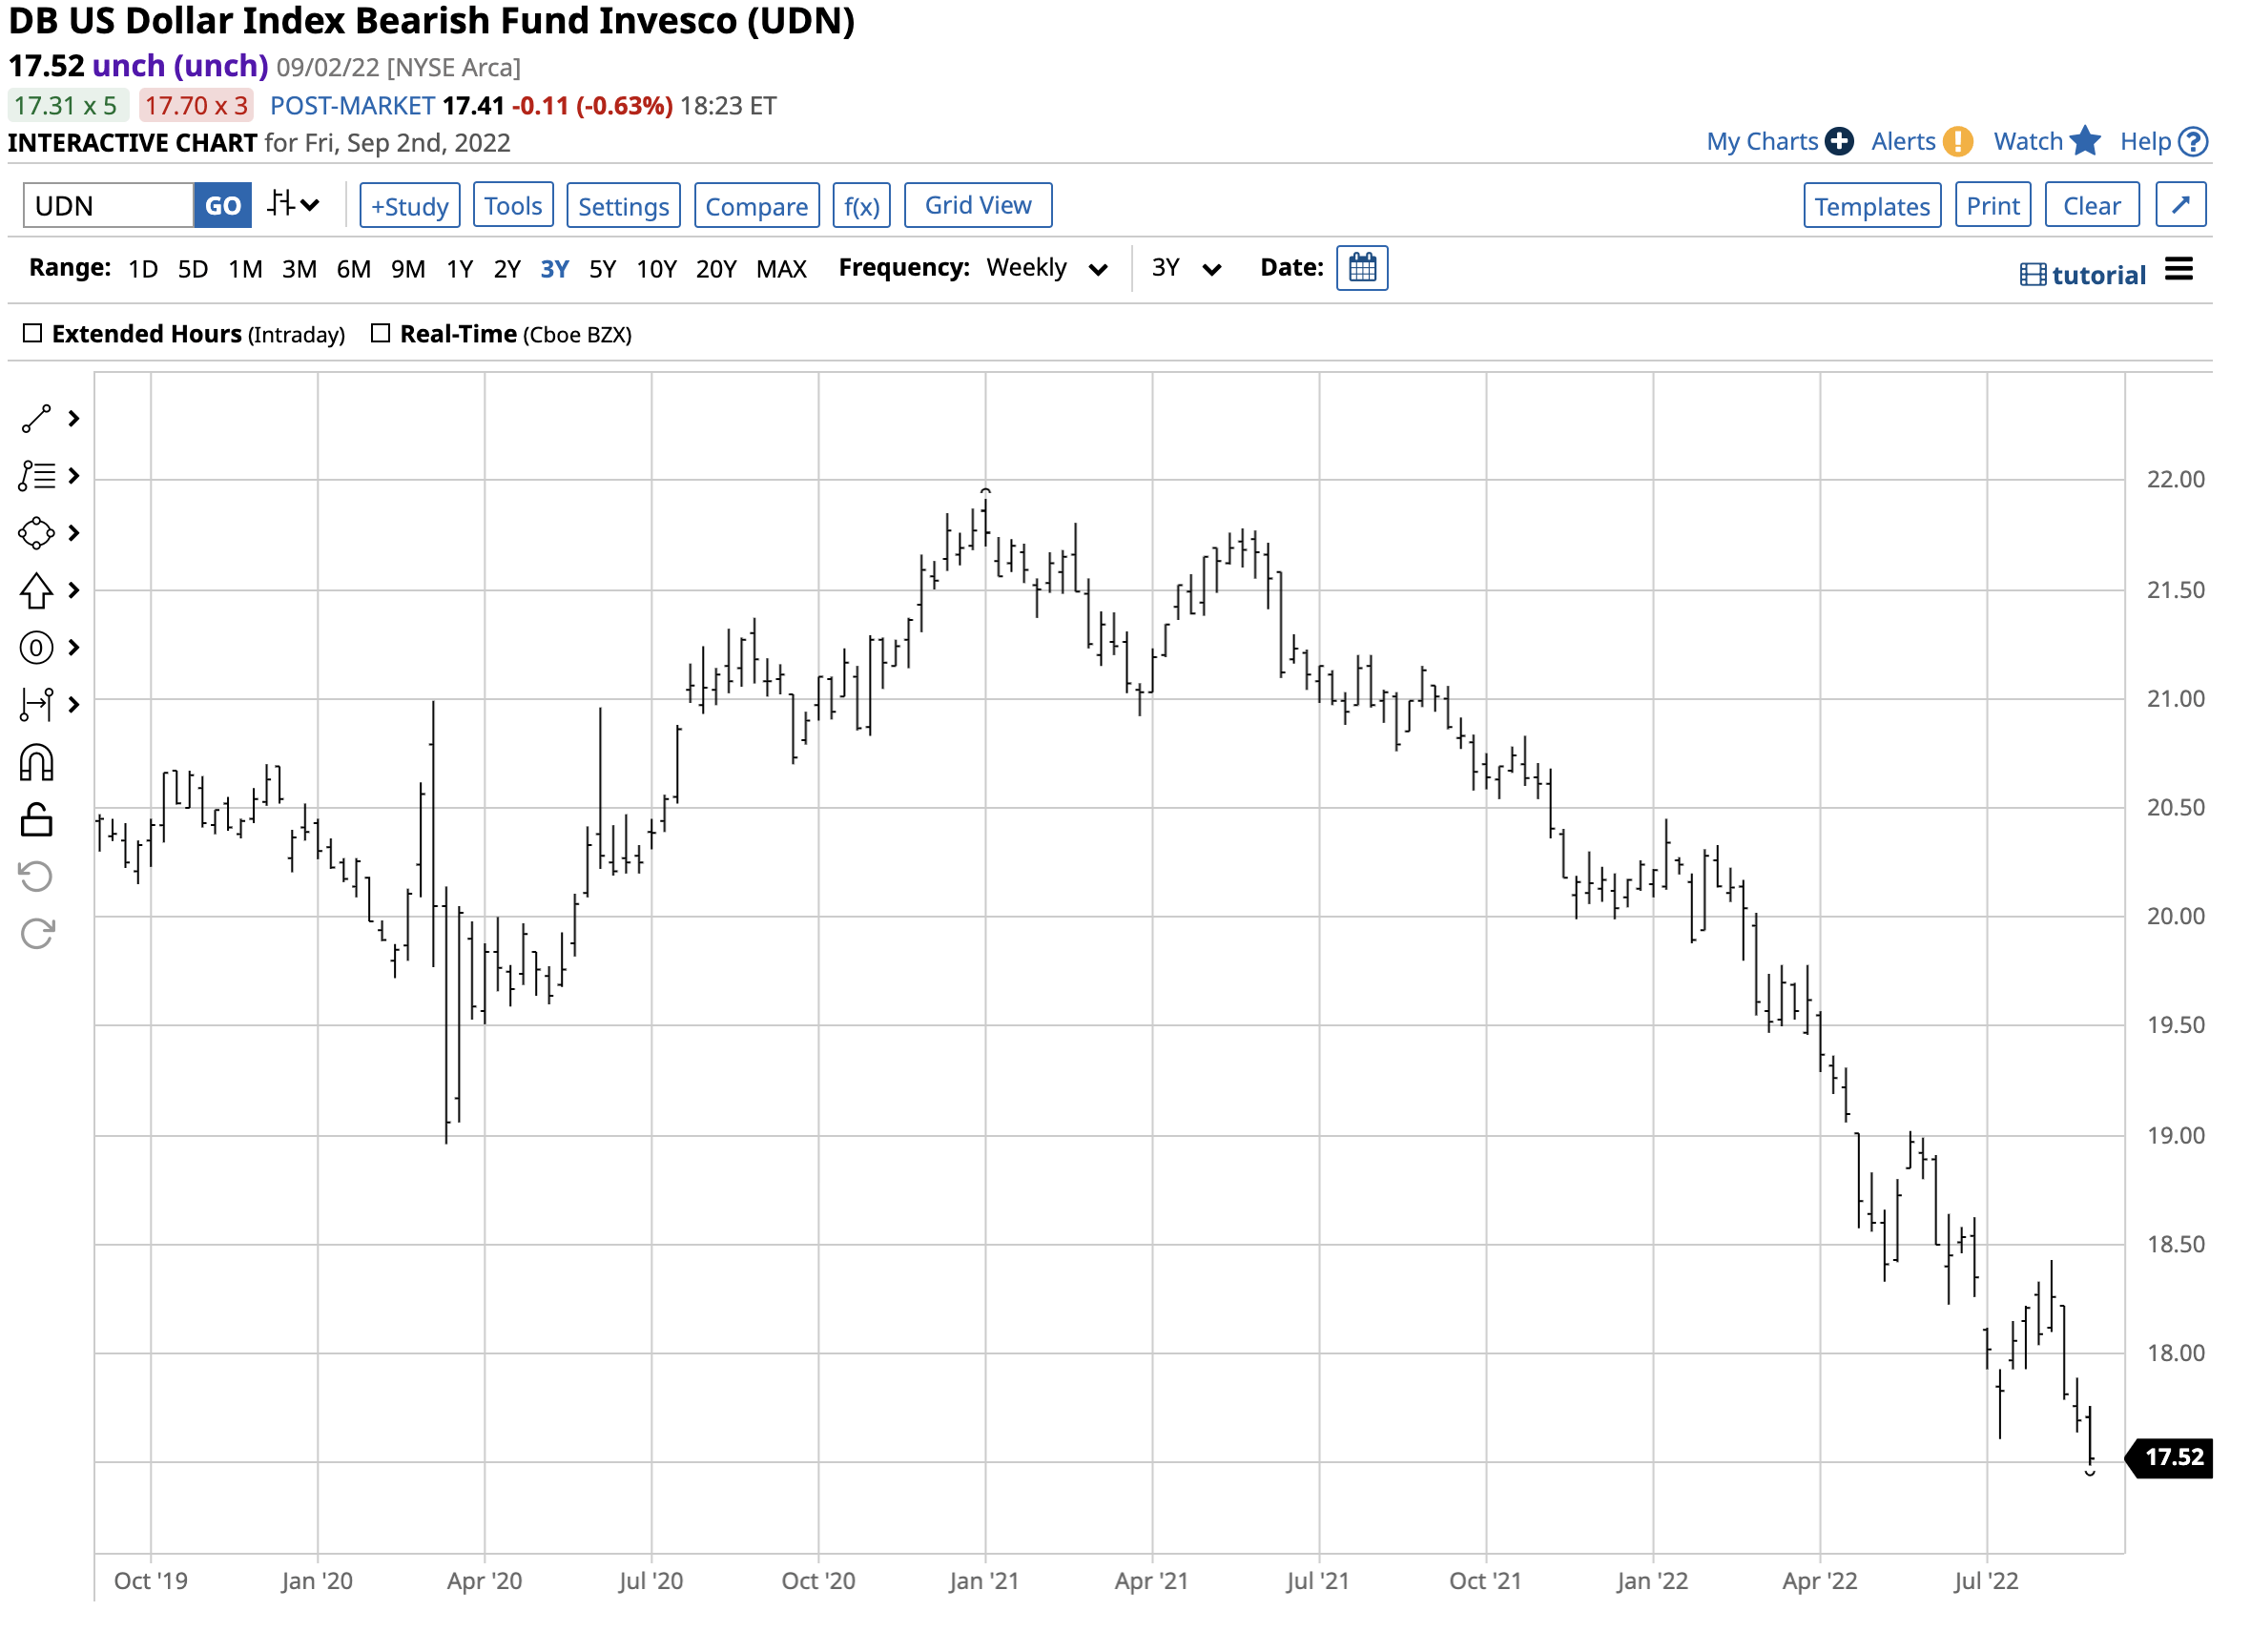
The bearish UDN product fell from $21.91 to $17.49 per share over the same period, a 20.2% decline. The UUP and UDN products do an excellent job tracking the dollar index on the up and downsides. UUP and UDN only trade during the hours when the US stock market operates, therefore they can miss highs or lows that occur outside US stock market hours. The dollar index made a new two-decade high on Monday, September 5, the US Labor Day holiday, when UUP and UDN were not available for trading.
As of early September 2022, the trend in the dollar index remains higher. While bullish trends rarely move in straight lines and the odds of occasional corrections increase with the levels, the dollar remains the world’s strongest fiat reserve currency, with rising US interest rates and geopolitical turmoil in Europe bullish wind behind the dollar’s sails.
The end of European hostilities and a shift in Fed policy to address rising recessionary pressures are potential roadblocks to higher highs in the dollar index. Still, the prospects seem low for those events any time soon.
Be the first to comment