

Pgiam/iStock via Getty Images
Investment Thesis
Discipline is an essential dimension in any investment strategy. Buy&Hold can work (at equal-to or less-than) market average performance levels. But it may lead to the “long-term” trap of technological obsolescence, particularly when coupled with age-inflexible-corporate management culture seen in IBM, GE, T, PRD, XRX and others.
Active investing, where selections are continually required to compete with alternatives, and are always subject to holding period time limitations tends to avoid this problem. And it urges the reward-compounding benefit of taking gains when they appear, as (required to be) stated at the onset of the capital commitment. Then the expanded capital starts a freshly-positioned competition for portfolio inclusion and performance.
We follow a standardized TERMD (Time-Efficient Risk-Management Discipline) performance-driven strategy. It is driven by our use of price-range forecasts derived from the way which big-volume, disruptive Institutionally-driven “block” trades must be conducted and accomplished.
They tend to put forecast time horizon limits on decisions to the 3-5 month near-term period, which requires position re-evaluations more frequently than practices followed by many individual investors.
But as this illustration shows, that can be a powerful benefit.
Description of the Primary Investment Security
Invesco DWA Energy Momentum ETF (NASDAQ:PXI)
“The fund generally will invest at least 90% of its total assets in the securities that comprise the underlying index. The underlying index is composed of at least 30 securities of companies in the energy sector that have powerful relative strength or ‘momentum’ characteristics.”
Source: Yahoo Finance, Morningstar
Yahoo Finance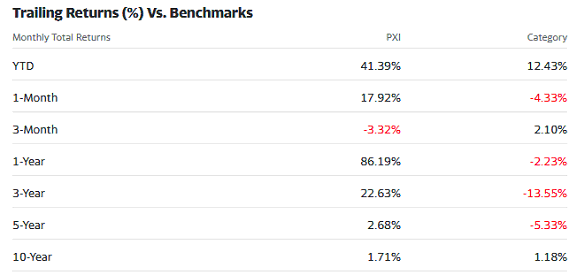
Please note: These are period returns, not annual averages or CAGRs.
Comparable Prospective Reward & Risk Forecasts
Figure 1
blockdesk.com (Image used with permission)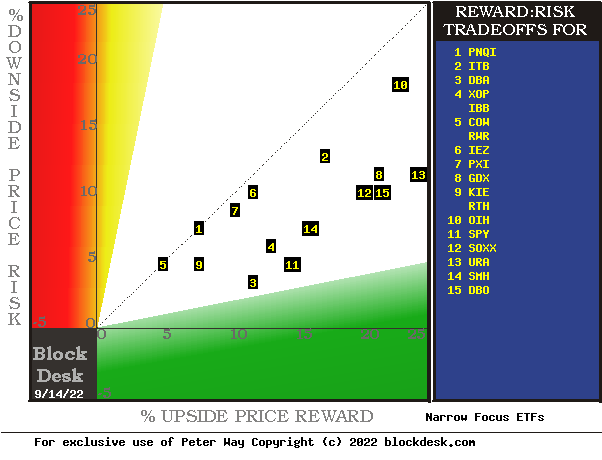
Expected rewards for these securities are the greatest gains from current closing market price seen worth protecting short positions. Their measure is on the horizontal green scale.
The risk dimension is of actual price drawdowns at their most extreme point while being held in previous pursuit of upside rewards similar to the ones currently being seen. They are measured on the red vertical scale.
Both scales are of percent change from zero to 25%. Any stock or ETF whose present risk exposure exceeds its reward prospect will be above the dotted diagonal line. Capital-gain attractive to-buy issues are in the directions down and to the right.
Our principal interest is in PXI at location [1], erroneously on the diagonal line just above [5]. A “market index” norm of reward~risk tradeoffs is offered by SPY at [9]. The most appealing (to own) by this Figure 1 view is DBO at location [7] but further examination will show why this may not be so.
Comparing features of Alternative Investment Stocks
The Figure 1 map provides a good visual comparison of the two most important aspects of every equity investment in the short term. There are other aspects of comparison which this map sometimes does not communicate well, particularly when general market perspectives like those of SPY are involved. Where questions of “how likely’ are present other comparative tables, like Figure 2, may be useful..
Yellow highlighting of the table’s cells emphasize factors important to securities valuations and to the security PXI, most promising of near capital gain as ranked in column [R]. Pink cell fills indicate inadequate proportions of essential performance competitive requirements, as in [H], [L-N] and [T].
Figure 2
blockdesk.com (Image used with permission)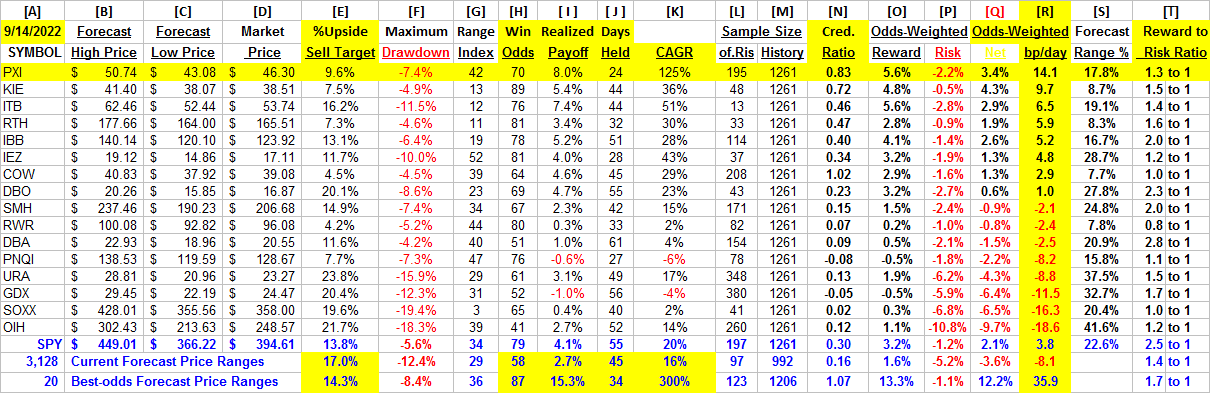
The price ranges implied by the day’s transactions activity are in columns [B] and [C], typically surrounding the day’s closing price [D]. They produce a measure of risk and reward we label the Range Index [G], the percentage of the B to C forecast range which lays between D and C.
Today’s Gs are used for each stock’s past 5-years of daily forecast history [M] to count and average prior [L] experiences. Fewer than 20 of Gs or a shorter history of Ms are regarded as statistically inadequate.
[H] tells what percentage of the L positions were completed profitably, either at range-top prices or by market close above day after forecast close price entry costs. The Net realization of all Ls is shown in [ I ].
[ I ] fractions get weighted by H and 100-H in [O,P, & Q] appropriately conditioned by [J] to provide investment ranking [R] in CAGR units of basis points per day.
The pink cell highlighting provides fatal investment evaluation conditions for several candidates, occasionally including the market-index ETF SPY. Additional market perspective is provided by the 3,000+ securities for which price range forecasts are available. They currently suggest that while market recovery is under way, it is still far from generally attractive.
On the other hand, R column scores for PXI and the top 20 forecast population support the primary candidate’s competitive capability and notes the presence of several other demonstrated prospects.
Recent Trends of Price Range Forecasts for PXI
Figure 3
blockdesk.com (Image used with permission)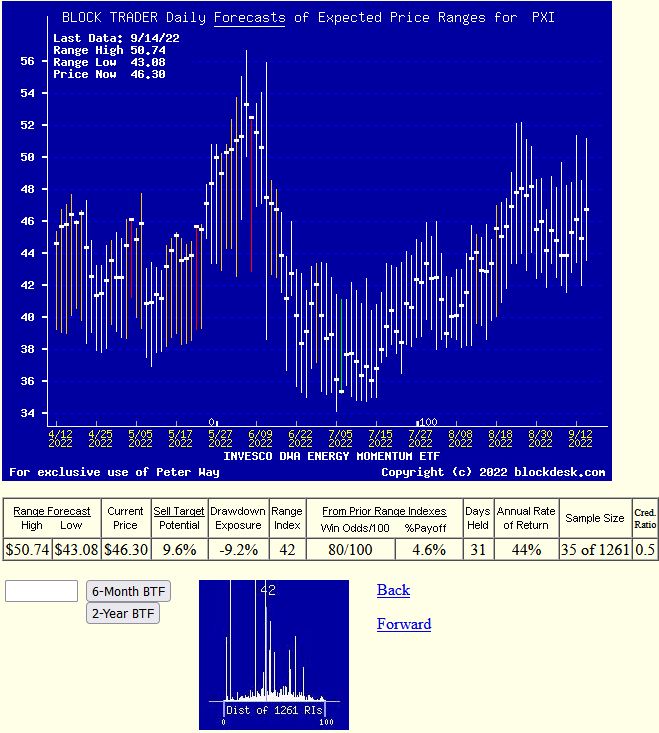
The vertical lines of Figure 3 plot the daily updated forecast price ranges for PXI in coming next few months, as implied by active hedging of the ETF’s volume block transactions negotiated among institutional investors.
The ranges are bifurcated by the closing price on the day of the forecast.
That divides them into upside and downside prospects visually.
Those forecasts are typically resolved in time horizons of less than a half year, and often in two months or shorter. This one states that of the 35 prior forecasts like today’s, most were completed in 31 market-days (6 weeks) profitably at average +4.6% profits, a CAGR rate of +44%. No promises, just fun with history.
Investor Takeaway
Comparison of the performances of near-term Market-Maker forecasts for Invesco DWA Energy Momentum ETF with similar forecasts of other technologically-active securities pursued by investor referencing, it seems clear that this stock can be an attractive investment choice for investors pursuing near-term capital gain strategies.
Be the first to comment