

Alex Wong/Getty Images News
Q2 recap and thesis
Both Intel (NASDAQ:INTC) and Qualcomm (NASDAQ:QCOM) reported their CY Q2 results last week. Add a note that for QCOM, it is the FY Q3 results. Its fiscal calendar is shifted by one quarter. The market did not respond well to either – for good reasons.
Both posted weak results and weak guidance. INTC cut its full-year topline outlook to be between $65B and $68B, an almost 11% cut compared to a previous outlook of $76B. And its share prices fell nearly 9% after the earnings report (“ER”). QCOM share prices fell after its ER too, although to a lesser degree. Its updated guidance for the bottom line is now between $3 and $3.30 per share for the next quarter, and topline guidance is between $11B and $11.8B. Both are weaker than consensus expectations, which are $3.25 EPS and $11.86B for sales.
While they are reporting their earnings, the CHIPS Act just passed the senate vote. The act is now just waiting for President Biden’s signature to become law (and the president has openly stated his support for the act before). And the CY Q2 results for both INTC and QCOM didn’t include the potential benefits of the act.
The thesis of this article is that the market did not price in these benefits either, hence creating mispricing. The impacts are summarized in the table below based on my analysis, and you will see the details in the remainder of this article. For both INTC and QCOM, the CHIPS Act is expected to boost their R&D yield by about 25% due to the tax benefits. And for INTC, the act is expected to effectively boost its reinvestment rate to about 30% due to the money earmarked to support chip manufacturing in the U.S. When these factors are considered, both stocks offer return potentials in the upper teens (around 18%).
Author
The 2022 CHIPS Act
Specifics of the act are all over the news now. Just a very quick summary of the key parts that are relevant to the remainder of this analysis.
First and foremost, it is almost certain that the act will be signed into law. As of July 27, 2022, The CHIPS Act has officially passed both the House of Representatives and also the Senate. It now sits on President Biden’s desk to be signed into law. Biden has openly stated his support for the act. He commented earlier that “The CHIPS and Sciences Act is exactly what we need to be doing to grow our economy right now” and “I look forward to signing this bill into law.”
Second, the act is substantial. Its total size is $280 billion. The main components include $52 billion for domestic semiconductor fabrication, $24 billion for a 25% tax credit, and $200 billion in grants for research. These are substantially support for the U.S. chip sector both in absolute and relative terms, as you will see immediately below.
INTC and QCOM: R&D expenses and CHIPS Act impact
Let’s first see the R&D expenditures of INTC and QCOM, so we can put the scale of the act into perspective. The next chart shows the R&D expenses of INTC and QCOM over the past few years. As seen, both have been consistently investing heavily in R&D. INTC on average has been spending about 21.5% of its total revenue on R&D efforts. The spending has been increasing gradually also. It used to be about 15% in the earlier part of the decade, then moved up to about 20% around 2019, and it is currently at 21.5%. Similarly, QCOM has been also spending on average about 20.3% of its sales in recent years on R&D.
In absolute terms, INTC’s R&D expenses are about $17.8B TTM and QCOM’s about $7.8B TTM. So the $200 billion grants for research in the act is more than 11 years of INTC’s R&D budget and more than 25 years of QCOM’s.
Author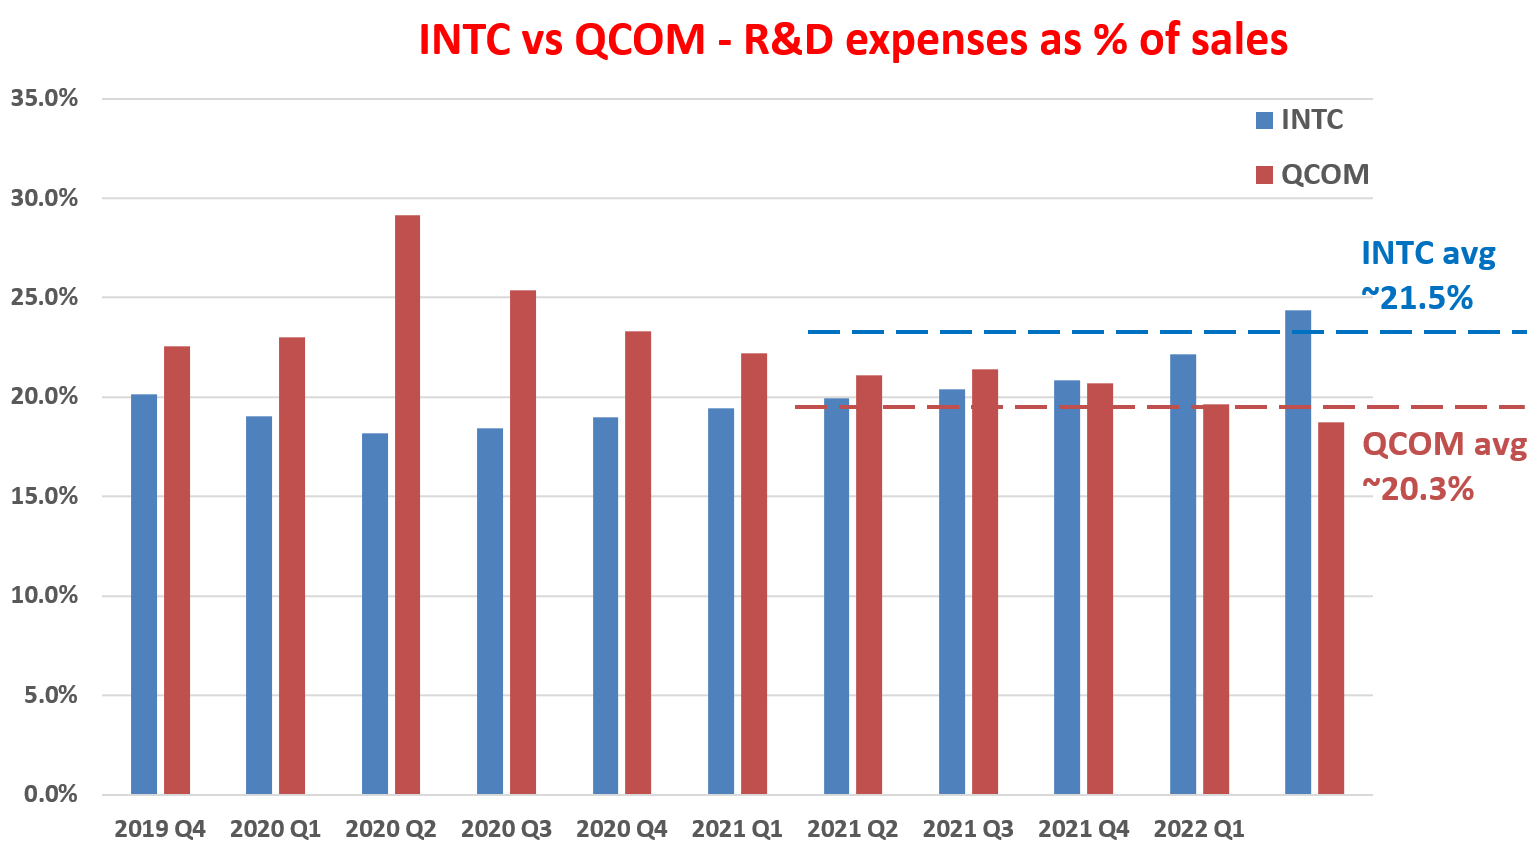
INTC and QCOM: impact on R&D yield
After contextualizing its scale, now let’s assess its impact. First, let me clarify that this is more of a scenario analysis. The management themselves do not know the precise impact yet as you can see from the following Q&A exchange during the ER (abridged and emphases added by me). But in investing, it is always better to be approximately or even just directional right than precisely wrong. Having a scenario analysis is often sufficient to profit – it prepares us to be ready to act if the scenario does materialize.
Questions from Randy Abrams (Credit Suisse): A multi-part question…. Also want to task a bit more of the CHIPS Act, how it changes your approach to the business. And for David, if the capital offsets assume some of the U.S. benefits and how it could impact the tax rate?
Answers from Dave Zinsner (INTC CFO): … we have not assumed any CHIPS Act money in 2022. Our expectation is there’ll be a process and that process will take us into 2023 before we start receiving money from CHIPS. So not assumed in 2022, although, we’re assuming that we will see some in 2023. As you point out, the CHIPS Act or the bill that was passed is a combination of grant money and in tax credits, I think it’s a little early to determine exactly how all that is administered and makes its way into our P&L. So we’ll table that until that becomes clearer to us exactly how things shake out and we’ll give you more color once we have a better assessment of that.
Against this backdrop, I will present my scenario analysis below. Here we will use a variation of Buffett’s $1 test on R&D expenses to assess the impact. The method is detailed in our earlier articles and a brief recap is provided below:
The purpose of any corporate R&D is obviously to generate profit. Therefore, it is intuitive to quantify the yield by taking the ratio between profit and R&D expenditures. This way we can quantify how many dollars of profit has been generated per dollar of R&D expenses, as shown in the next chart. In this chart, I used the operating cash flow as the measure for profit. Also, most R&D investments do not produce any result in the same year. They typically have a lifetime of a few years. Therefore, this analysis assumes a 3-year average investment cycle for R&D. And as a result, we use the 3-year moving average of operating cash flow to represent this 3-year cycle.
As you can see, the R&D yield for both INTC and QCOM has been both healthy (and superb for INTC). INTC features a long-term average of $2.17 with overall consistency over the past years. QCOM enjoys a relatively lower yield of $1.24 but with better consistency as you can see. Despite the contrast between the two of them, their levels of R&D yield are in line or even among the overachieving FAAMG group, which generates an average R&D yield of about $1.9.
And with the tax credit and research grants provided in the CHIPS Act, I am projecting their R&D yield to go up by at least 25%. The benefits will come from two directions. Firstly, the tax credit will effectively reduce their real R&D expenses without changing the outputs. Secondly, the research grants will pay for a good portion of their R&D in the coming years. And their projected R&D yield is in the range of $2.7 for INTC and $1.6 for QCOM, making them more competitive even compared to the FAAMG stocks.
Author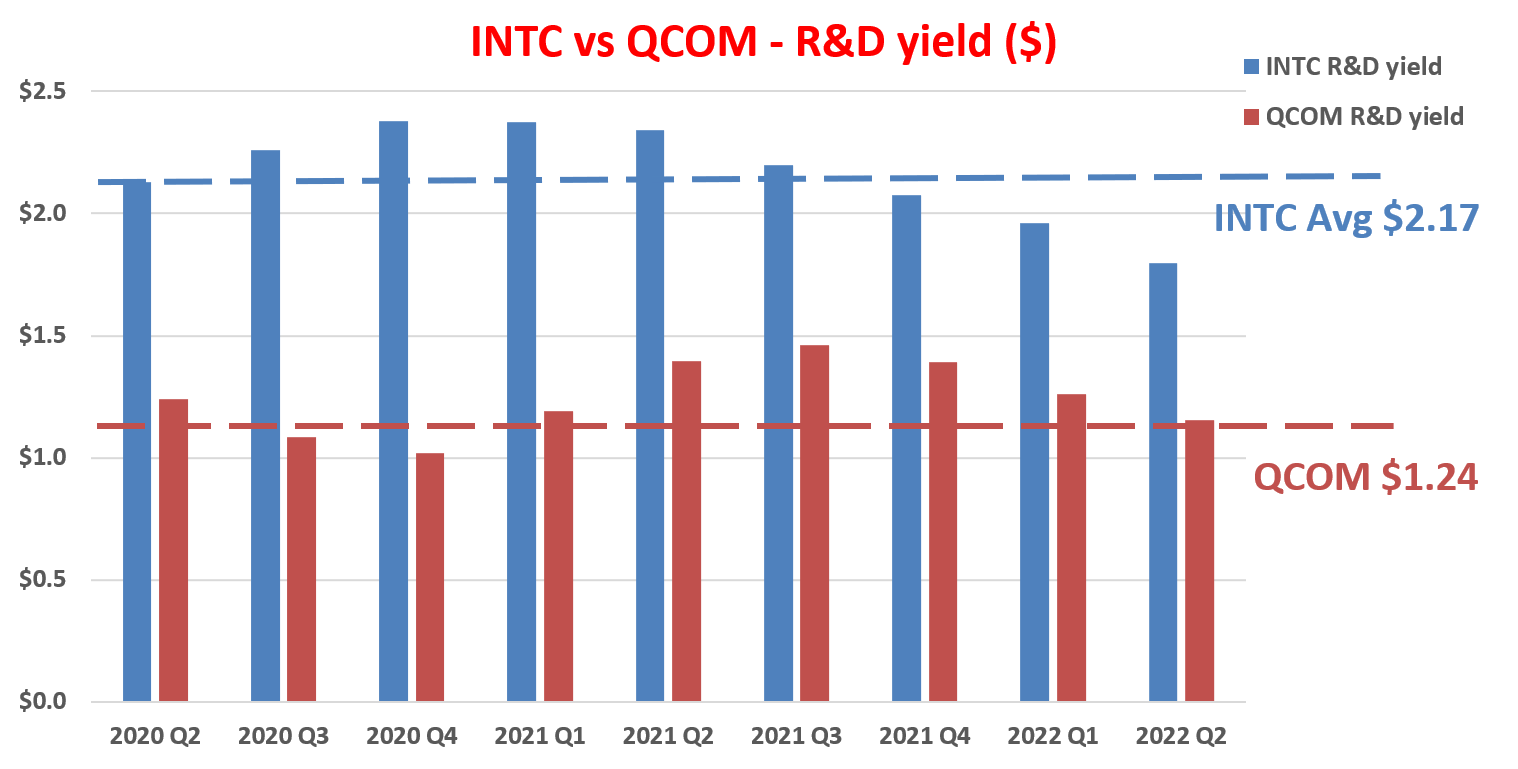
INTC and QCOM: impact on profitability
The CHIPS Act will also boost their profitability, again at least from two directions. Firstly, they will receive substantial subsidies from the act to pay for their CAPEX. Therefore, their free cash flow will expand. Especially in the case of INTC, it is expected to receive a large sum towards its foundry initiatives. The size of the subsidies is uncertain at this point and varied from $3B to $20B, but is expected to be sizable as quoted in the following report (abridged and emphases added by me). Secondly, the CHIPS Act will effectively boost their reinvestment rates and help fuel growth.
Intel has said previously it hopes to receive as much as $3 billion for each new fab it builds in the U.S. and has noted the $3 billion per fab is a cap in the legislation… Reuters quoted one unnamed person saying Intel that might get $20 billion with CHIPS Act plus $5 billion or $10 billion under the FABS Act…
To further assess the impact on profitability, I will use the metric of ROCE (return on capital employed). The metric is detailed in our earlier articles and a brief recap is provided below:
When we think of long-term growth (like in 10 years or more), the growth rate is “simply” the product of ROCE and reinvestment rate, i.e.,
Long-Term Growth Rate = ROCE * Reinvestment Rate
ROCE is the most important metric for measuring profitability because it considers the return of capital ACTUALLY employed. In this analysis, I consider the following items capital actually employed A) Working capital (including payables, receivables, inventory), B) Gross Property, Plant, and Equipment, and C) Research and development expenses are also capitalized.
Based on the above considerations, the ROCE of INTC and QCOM over the past few years is shown below. As seen, INTC was able to maintain an overall consistent ROCE over the past. Its average ROCE has been about 40% in recent years, with narrow fluctuations between 35% and 42%. And QCOM’s ROCE is even higher although more cyclical. Its ROCE fluctuated from as low as 60% to as high as 140%. On average, its ROCE has been about 104% in recent years. Against, despite the relative differences, both of their ROCE are very competitive even among overachievers like the FAANG whose average ROCE is somewhere between 45% to 55% in recent years.
With these ROCE results, we will quantify the impact of the act next.
Author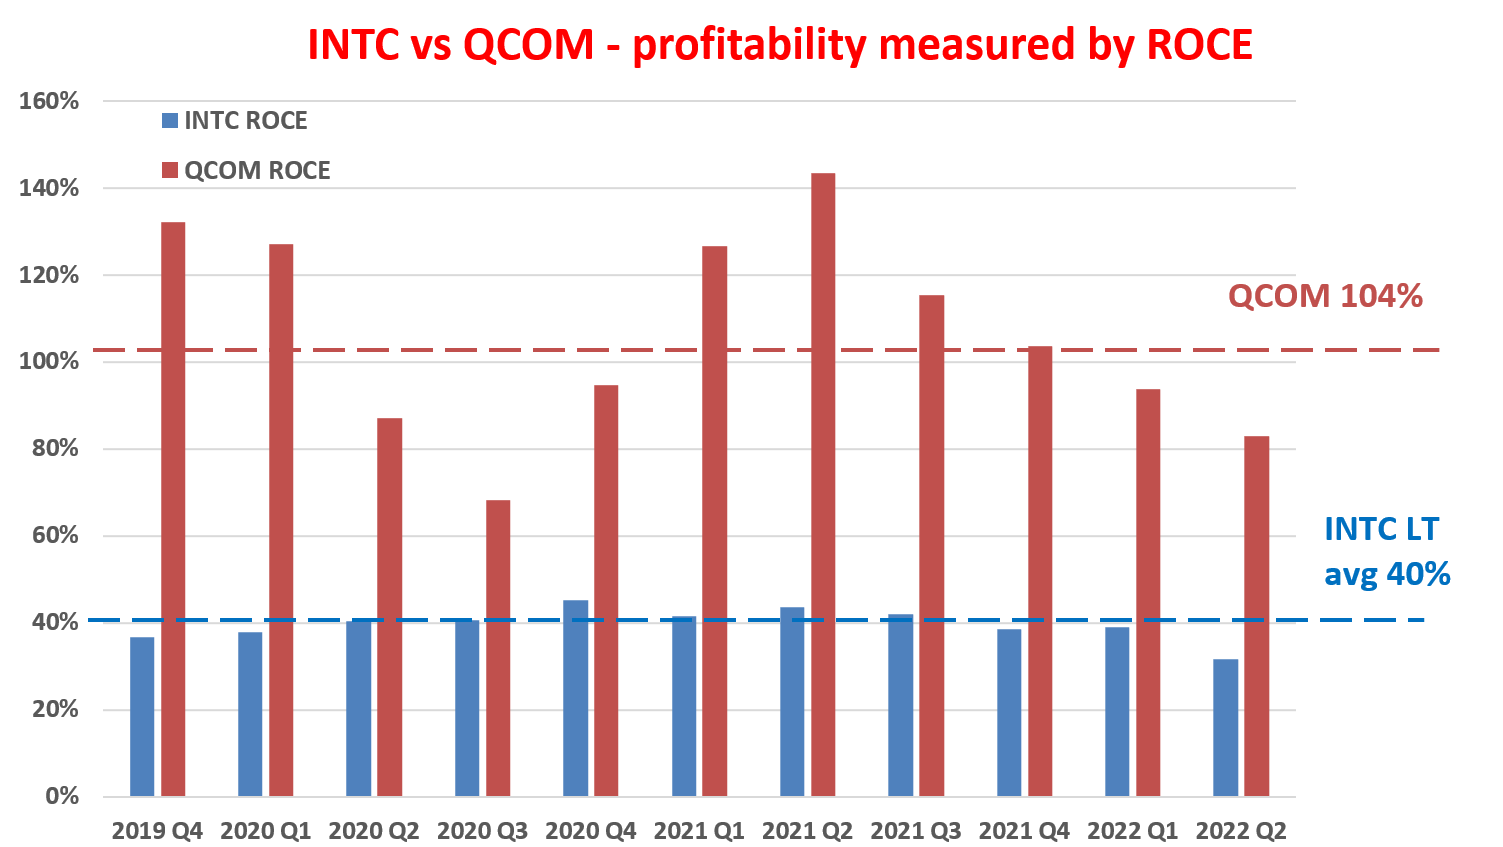
CHIPS Act – final results
As mentioned above, the CHIPS Act will boost their profitability in two directions – expansion of free cash flow or boost in reinvestment rates. Here, to avoid double-accounting and also to be on the conservative side, I will only consider one of the two benefits – the boost in reinvestment rates. INTC and QCOM have been reinvesting at a rate of 20% and 7.5% respectively before. And my estimate is that the subsidies from the act will boost their reinvestment rates to 30% and 10% respectively. The boost is larger for INTC because of the subsidies for its foundry business as quoted above.
With the above fundamentals, we come back to the table that I used to open the article. The table summarizes the anticipated impacts of the act on INTC and QCOM. As aforementioned, as long-term business owners, our long-term return on investment (“ROI”) is determined by two things. The first is the owner’s earning yield (“OEY”). And second, the perpetual growth rates.
And my key takeaways are:
- Both offer attractive OEY given their currently compressed valuation. And the CHIPS Act does not directly impact their OEY.
- The act is anticipated to boost their R&D yield as analyzed above.
- More importantly, the act is also anticipated to boost their perpetual growth rates. I anticipate an effective reinvestment rate of 30% for INTC with the subsidies in the act. As a result, its long-term growth rates are estimated to be 12% (40% ROCE * 30% reinvestment rate = 12%). And I expect an effective reinvestment rate of 10% for QCOM, so its growth rate is estimated to be 9% (90% ROCE * 10% reinvestment rate = 9%).
- And both are projected to provide a total return in the long term in the upper-teen range of around 17% to 18%.
Author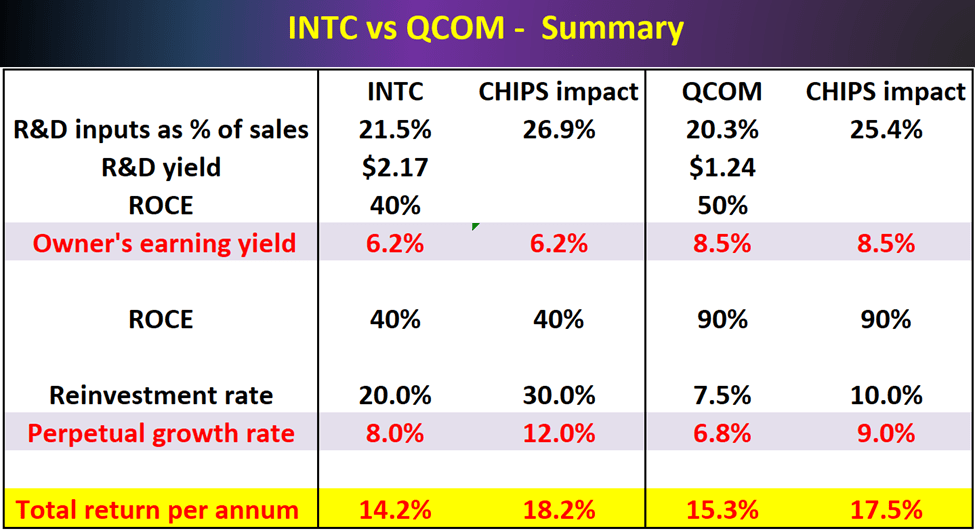
Final thoughts and risks
To sum up, the main thesis is that the market has not priced in the potential impact of the CHIPS Act on INTC and QCOM, especially the long-term impact and the higher orders effects. These effects include the $200B research grants (which will help to offset their R&D expenses for years to come) and also the subsidies (which will effectively boost their reinvestment rates and/or profitability substantially). These stocks already offer an attractive return/risk profile without the act. And now they have become even more attractive and my projected annual return is in the upper-teen range for both (around 18%).
Finally, risks. Both stocks do face some risks too. First and foremost, as emphasized upfront, my analysis here is a scenario analysis, and the actual allocation of the funds in the CHIPS Act can deviate. Secondly, there is a non-negligible chance of a recession in the near future. Leading firms like Tesla (TSLA), Ford (F), and Meta Platforms (META) have all reported hiring freezes or even layoffs recently, which could soften the demand for chips for both of them in key areas such as EVs and servers. Finally, for QCOM, the pandemic pulled forward a lot of demand for phone upgrades in general. But with the COVID benefit now going away, demand for its mobile chips will renormalize.
Be the first to comment