

FluxFactory
Although the ideal scenario for investors is to buy a stock and have that stock generate strong upside in a short timeframe, oftentimes that is not how things play out. Especially during these uncertain times, volatility is omnipresent and can result in significant downside in the short run, even for companies that seem to offer strong upside potential. One example of this can be seen by looking at Installed Building Products (NYSE:IBP), a firm that operates as one of the largest insulation installers for the residential new construction market in the US, while also providing complementary building products like waterproofing, garage doors, rain gutters, and more. Although shares have experienced a bit of downside lately, the company continues to grow both through organic means and by acquiring other assets. Fundamental performance remains robust, but the market does seem to be worried about the future as the state of the economy grows progressively more precarious. While it is likely that the company’s fundamental condition will eventually show some signs of deterioration, even a return to levels of profitability seen in prior years suggests some upside might still be on the table. Because of this, I have decided to keep my ‘buy’ rating on the firm for now, reflecting my belief that it offers upside potential that is greater than what the broader market does for the foreseeable future.
Strong performance continues
The last time I wrote an article about Installed Building Products was back in early July of this year. In that article, I talked about how shares of the company had experienced some pain that even exceeded what the broader market had in the prior few months. This pain came even as the company’s top and bottom line performance remained robust. I did not shy away from the fact that there are certain risks involved in buying into a company like this right now, given the state of inflation, interest rates, and more. But at the end of the day, I still felt as though there was some upside potential for investors moving forward. That led me to rate the company a ‘buy’. Since then, however, the market has been progressively more spooked, culminating in the company experiencing downside of 7.1%. That compares to the 0.9% decline seen by the S&P 500 over the same window of time.
Author – SEC EDGAR Data
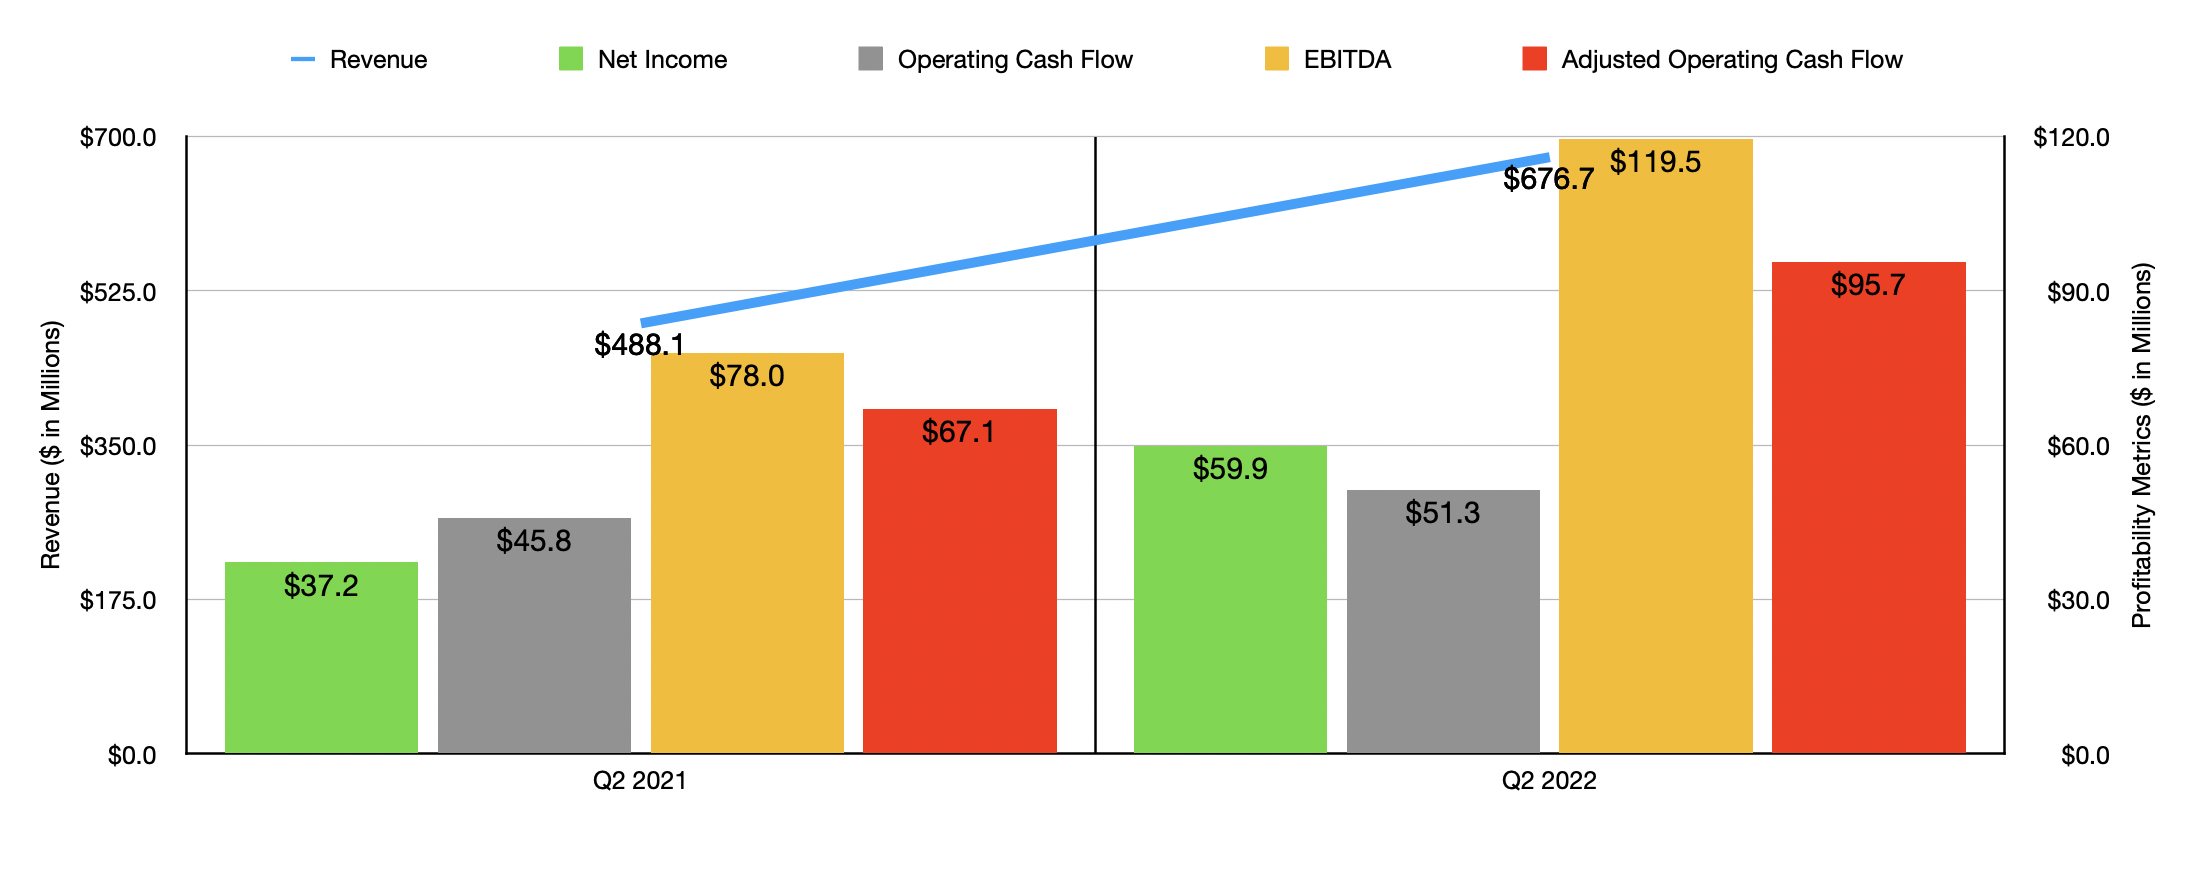
Given this return disparity, you might initially think that the fundamental performance of Installed Building Products was worsening. But that couldn’t be further from the truth. To see what I mean, we need only look at the performance of the company for the second quarter of its 2022 fiscal year. This is the only quarter for which data is now available that was not available when I last wrote about the business. During that quarter, sales came in strong at $676.7 million. That represents an increase of 38.6% compared to the $488.1 million the company generated the same time last year.
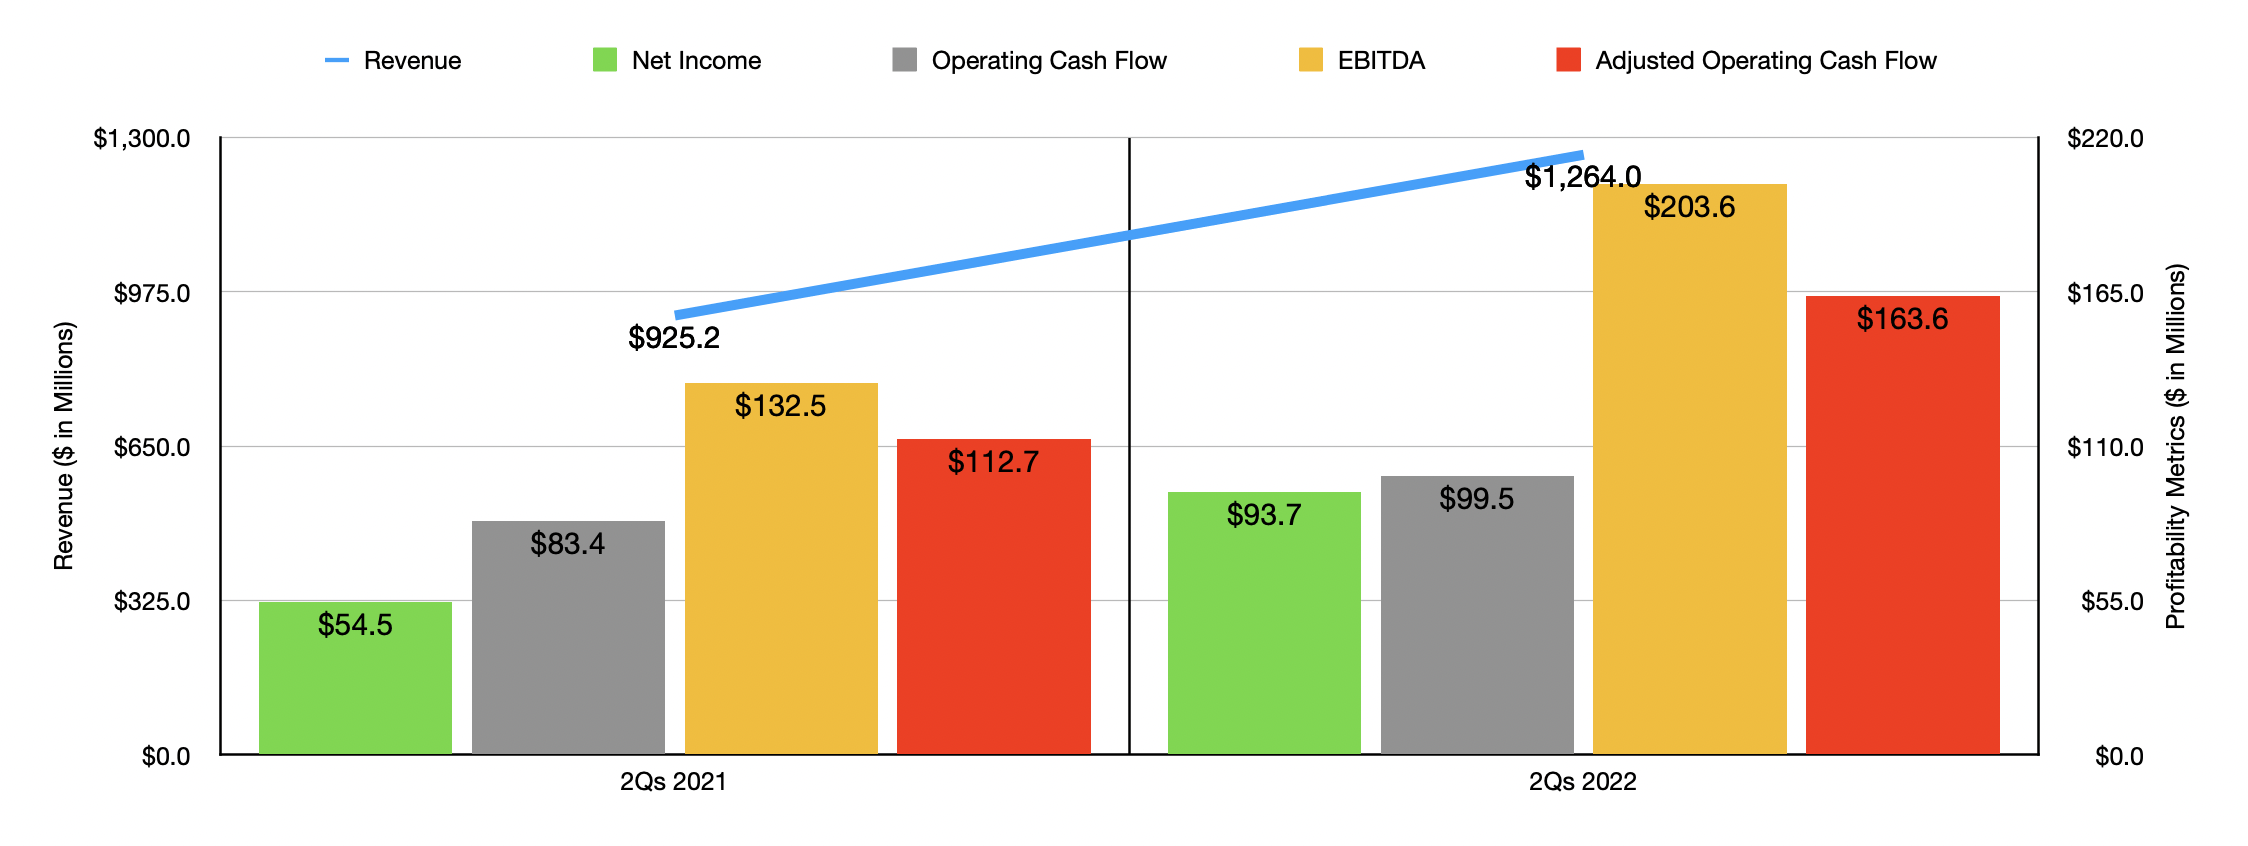
The biggest contributor for this upside for the company was a favorable change in pricing and product mix. This contributed 24.9% to the company’s same branch sales growth for installation. By comparison, volume growth helped the company to the tune of 7%. Management did not reveal exactly how much of its growth was driven by organic expansion. But we do know that they said that increased selling prices and organic growth from existing branches were the primary drivers of increased sales. But this is not to say that the company did not benefit from some acquisitions. In fact, through August 4th of this year, management made acquisitions adding $71 million in annual revenue to the company. This places the company well on its way to achieving $100 million worth of annual revenue from acquisitions by the end of this year. Thanks to this strong second quarter, revenue for the first half of the 2022 fiscal year as a whole came in strong at $1.26 billion. That’s 36.6% above the $925.2 million generated in the first half of the 2021 fiscal year.
Author – SEC EDGAR Data
With this rise in sales, the company also benefited tremendously on the bottom line. Net income in the second quarter, for instance, came in at $59.9 million. That’s 61% above the $37.2 million generated the same time one year earlier. Other profitability metrics also followed suit. Operating cash flow rose from $45.8 million to $51.3 million. But if we adjust for changes in working capital, the increase would have been greater, with the metric climbing from $67.1 million to $95.7 million. And finally, we have EBITDA, which increased from $78 million in the second quarter of 2021 to $119.5 million the same time this year. It should come as no surprise that this strong year-over-year growth in the second quarter was also instrumental in pushing total profitability for the first half of the year up compared to the same time last year.
Author – SEC EDGAR Data
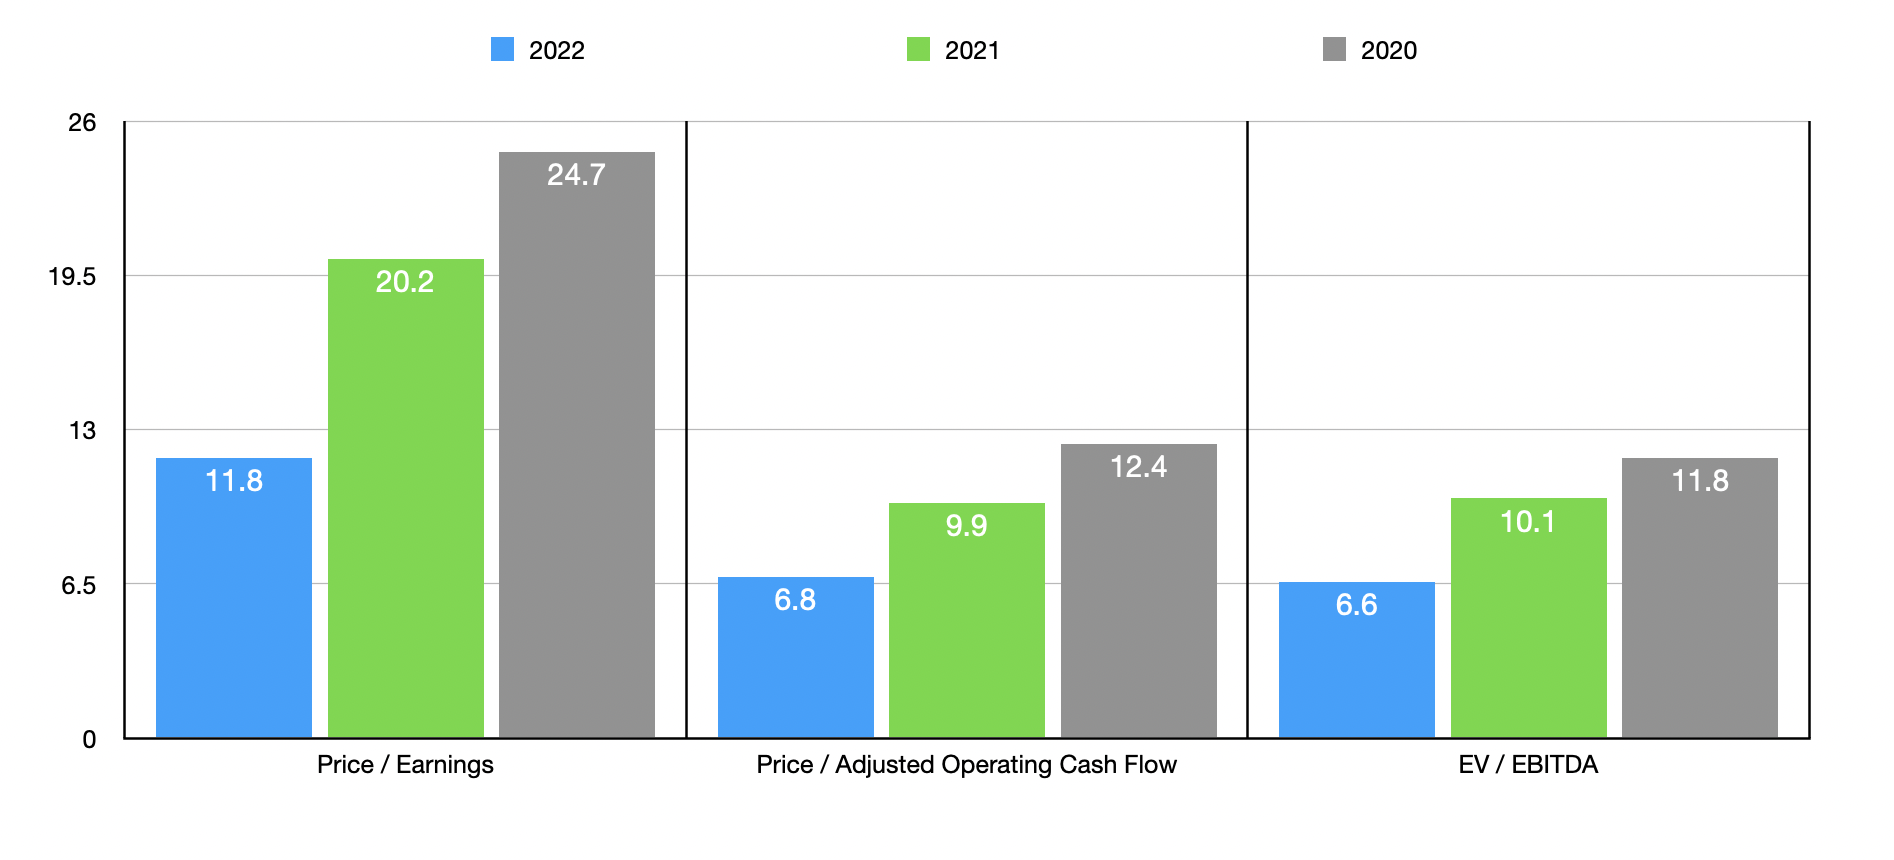
When it comes to the 2022 fiscal year as a whole, management has not provided any detailed guidance. But if we were to annualize financial performance from the first half of the year, we would get net income of $204.2 million, adjusted operating cash flow of $350.9 million, and EBITDA of $470 million. Using this data, we can calculate that the company is trading at a forward price-to-earnings multiple of 11.8. The forward price to adjusted operating cash flow multiple is substantially lower at 6.8, while the EV to EBITDA multiple of the company should come in at 6.6. As you can see in the chart above, these numbers are lower than what we would get using data from 2021 or 2020. But even if financial performance reverts back to the kind of level seen in 2020, it asked that would be hard given the various asset acquisitions management has engaged in, shares would not look unrealistically priced from a cash flow and EBITDA perspective. As part of my analysis, I also compared the company to five similar firms. On a price-to-earnings basis, these companies ranged from a low of 15.4 to a high of 33.9. And when it comes to the EV to EBITDA approach, the range was between 8.8 and 18.1. In both cases, only one of the five companies was cheaper than Installed Building Products. Using the price to operating cash flow approach, the range was between 14.8 and 104.4. In this scenario, our prospect was the cheapest of the group.
| Company | Price / Earnings | Price / Operating Cash Flow | EV / EBITDA |
| Installed Building Products | 20.2 | 9.9 | 10.1 |
| Masonite International Corporation (DOOR) | 31.2 | 18.5 | 11.7 |
| CSW Industrials (CSWI) | 33.9 | 23.4 | 18.1 |
| Griffon Corp. (GFF) | 22.1 | 104.4 | 11.7 |
| JELD-WEN Holding (JELD) | 15.4 | 14.8 | 8.8 |
| Gibraltar Industries (ROCK) | 29.1 | 95.6 | 16.5 |
Takeaway
Based on all the data provided, Installed Building Products strikes me as an interesting company that continues to generate strong performance even during these interesting and difficult times. It is also true that market conditions are worsening and that there could be a lag between when that hits and when the enterprise is impacted negatively. So far, this has not stopped management from buying back stock, including the more than 1 million shares they acquired for $99.7 million recently. Furthermore, even a return to the levels of profitability seen in prior years would not necessarily indicate that shares are overvalued compared to where they are today. At worst, they would be fairly valued. And more likely than not, they might still offer some upside potential. Because of this favorable risk-to-reward outlook, I have decided to keep my ‘buy’ rating on the company for now.
Be the first to comment