


Pgiam/iStock via Getty Images
Investment Thesis
The trade-commission-free automation progress achieved by securities markets in serving a continuing flow of individual investor internet-order small trades makes it necessary for Market-Makers to have capital at risk while handling the irregular huge-value “institutional” transactions. They protect their at-risk capital endangerment by hedging actions which reflects the coming price range expectations of the stocks involved – virtually all of the actively-traded issues.
The pricing and structure of such hedges reveal the coming-price expectations of both the MM protection-buyers and that of the MM industry protection-sellers.
Our selection of Inspire Medical Systems, Inc. (NYSE:INSP) is established by its currently-attractive stock pricing reinforced by other Seeking Alpha fundamental-analytical contributors.
Description of Subject Company
“Inspire Medical Systems, Inc., a medical technology company, focuses on the development and commercialization of minimally invasive solutions for patients with obstructive sleep apnea (OSA) in the United States and internationally. The company offers Inspire system, a neurostimulation technology that provides a safe and effective treatment for moderate to severe OSA. It also develops a novel, a closed-loop solution that continuously monitors a patient’s breathing and delivers mild hypoglossal nerve stimulation to maintain an open airway. The company was incorporated in 2007 and is headquartered in Golden Valley, Minnesota.
Source: Yahoo Finance
Yahoo Finance
Risk~Reward Comparisons of Portfolio Investment Candidates
Figure 1
blockdesk.com
(used with prior permission)
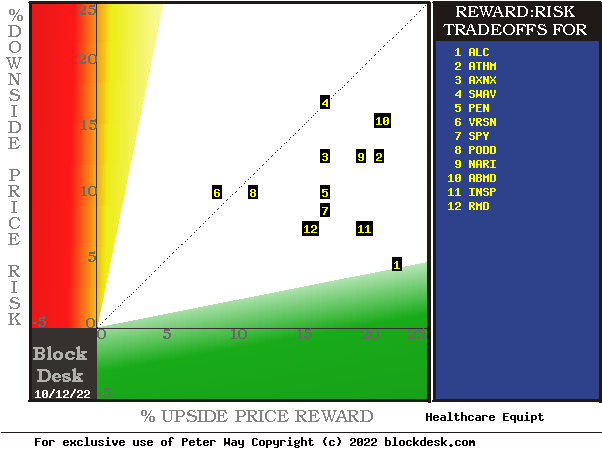
The tradeoffs here are between near-term upside price gains (green horizontal scale) seen worth protecting against by Market-makers with short positions in each of the stocks, and the prior actual price draw-downs experienced during holdings of those stocks (red vertical scale). Both scales are of percent change from zero to 25%.
The intersection of those coordinates by the numbered positions is identified by the stock symbols in the blue field to the right.
The dotted diagonal line marks the points of equal upside price change forecasts derived from Market-Maker [MM] hedging actions and the actual worst-case price draw-downs from positions that could have been taken following prior MM forecasts like today’s.
Our principal interest is in INSP at location [11]. A “market index” norm of reward~risk tradeoffs is offered by SPDR S&P 500 index ETF (SPY) at [7].
Those forecasts are implied by the self-protective behaviors of MMs who must usually put firm capital at temporary risk to balance buyer and seller interests in helping big-money portfolio managers make volume adjustments to multi-billion-dollar portfolios. The protective actions taken with real-money bets define daily the extent of likely expected price changes for thousands of stocks and ETFs.
This map is a good starting point, but it can only cover some of the investment characteristics that often should influence an investor’s choice of where to put his/her capital to work. The table in Figure 2 covers the above considerations and several others.
Comparing Alternative Investments
Figure 2
blockdesk.com
(used with permission)
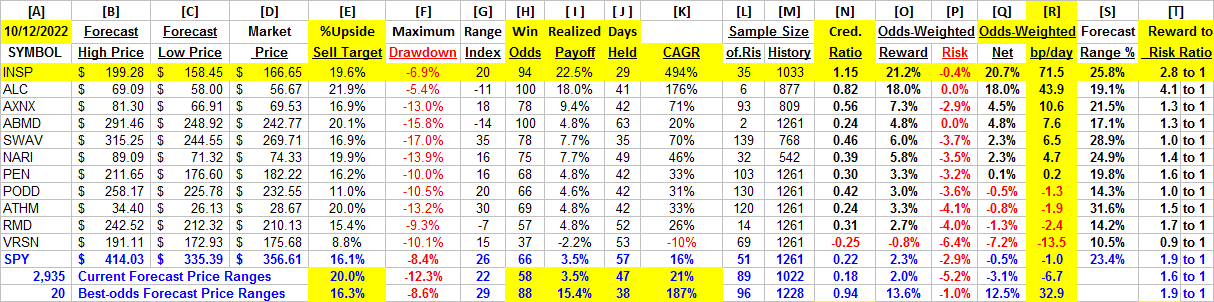
Column headers for Figure 2 define elements for each row stock whose symbol appears at the left in column [A]. The elements are derived or calculated separately for each stock, based on the specifics of its situation and current-day MM price-range forecasts. Data in red numerals are negative, usually undesirable to “long” holding positions. Table cells with yellow fills are of data for the stock of principal interest and of all issues at the ranking column, [R].
Readers familiar with our analysis methods may wish to skip to the next section viewing price range forecast trends for INSP.
Figure 2’s purpose is to attempt universally comparable measures, stock by stock, of a) How BIG the price gain payoff may be, b) how LIKELY the payoff will be a profitable experience, c) how soon it may happen, and d) what price draw-down RISK may be encountered during its holding period.
The price-range forecast limits of columns [B] and [C] get defined by MM hedging actions to protect firm capital required to be put at risk of price changes from volume trade orders placed by big-$ “institutional” clients.
[E] measures potential upside risks for MM short positions created to fill such orders, and reward potentials for the buy-side positions so created. Prior forecasts like the present provide a history of relevant price draw-down risks for buyers. An average of the most severe ones actually encountered are in [F], during holding periods in effort to reach [E] gains. Those are where buyers are most likely to accept losses.
[H] tells what proportion of the [L] sample of prior like forecasts have earned gains by either having price reach its [B] target or be above its [D] entry cost at the end of a 3-month max-patience holding period limit. [ I ] gives the net gains-losses of those [L] experiences and [N] suggests how credible [E] may be compared to [ I ].
Further Reward~Risk tradeoffs involve using the [H] odds for gains and the 100 – H loss odds as weights for N-conditioned [E] and for [F], for a combined-return score [Q]. The typical position holding period [J] on [Q] provides a figure of merit [fom] ranking measure [R] useful in portfolio position preferences. Figure 2 is row-ranked on [R] among candidate securities, with INSP yellow-row identified.
Along with the candidate-specific stocks these selection considerations are provided for the averages of over 3,000 stocks for which MM price-range forecasts are available today, and 20 of the best-ranked (by fom) of those forecasts, as well as the forecast for S&P 500 Index ETF as an equity market proxy.
Recent MM Price-Range Forecasts for INSP
Figure 3
blockdsk.com
(used with permission)
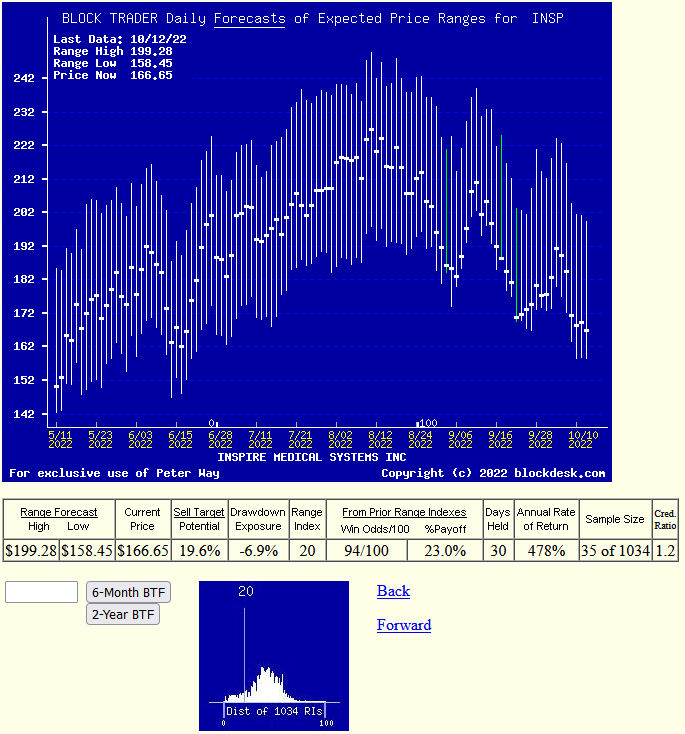
This picture is not a “technical chart” of past prices for INSP. Instead, its vertical lines show the past 6 months of daily price range forecasts of market actions yet to come in the next few months. The only past information there is the heavy dot of the closing stock price on the day of each forecast.
That data splits the price range’s opposite forecasts into upside and downside prospects. Their trends over time provide additional insights into coming potentials, and helps keep perspective on what may be coming.
The small picture at the bottom of Figure 3 is a frequency distribution of the Range Index’s appearance daily during the past 5 years of daily forecasts. The Range Index [RI] tells how much the downside of the forecast range occupies of that percentage of the entire range each day, and its frequency suggests what may seem “normal” for that stock, in the expectations of its evaluators’ eyes. A RI of 20, about 1/5th of the range leaves the other 4/5ths (80%) of the price change potential to the upside.
Here the present level is near its least frequent, lowest-cost presence, encouraging the acceptance that we are looking at a realistic evaluation for INSP. Nearly all past RIs have been above the present RI, indicating there is more room for an even more positive outlook.
Investment Candidates’ Profitability Prospects
Figure 4
blockdesk.com
(used with permission)
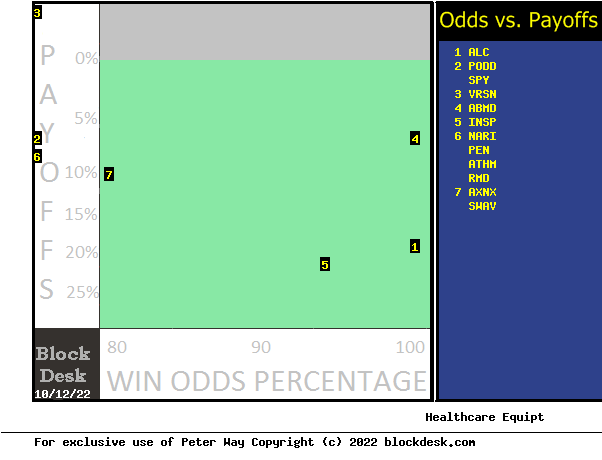
This comparison map uses an orientation similar to that of Figure 1, where the more desirable locations are down and to the right. Instead of just price direction, the questions are more qualitative: “how big” and “how likely” are price change expectations now?
Our primary interest is in INSP’s qualitative performance, particularly relative to alternative investment candidate choices. Here INSP is at location [5], the intersection of horizontal and vertical scales of +20% gain and +94% assurance [ODDS] of a “win”.
As a market norm, SPY is at location [2] with a +3.5% payoff and a 66% assurance of profitability. INSP tends to dominate all the return payoffs in this comparison.
Conclusion
Among these alternative investments explicitly compared Inspire Medical Systems, Inc. appears to be a logical buy preference now for investors seeking near-term capital gain.
Question: Is this form of comparisons more or less useful to you in your investment choice selections than one geared to industry economics or competitive actions?
Be the first to comment