

JadeThaiCatwalk/iStock via Getty Images
Investment Summary
The market has correctly priced in the impeding risks to Inogen, Inc.’s (NASDAQ:INGN) top-line growth over the coming periods, by estimate. The wind-down of Covid-19 protocols, combined with the competitive pricing environment in oxygen therapy are meaningful headwinds that we feel are set to impact INGN’s business model into the coming years.
Exhibit 1. INGN 12-month price action
Data & Image: Bloomberg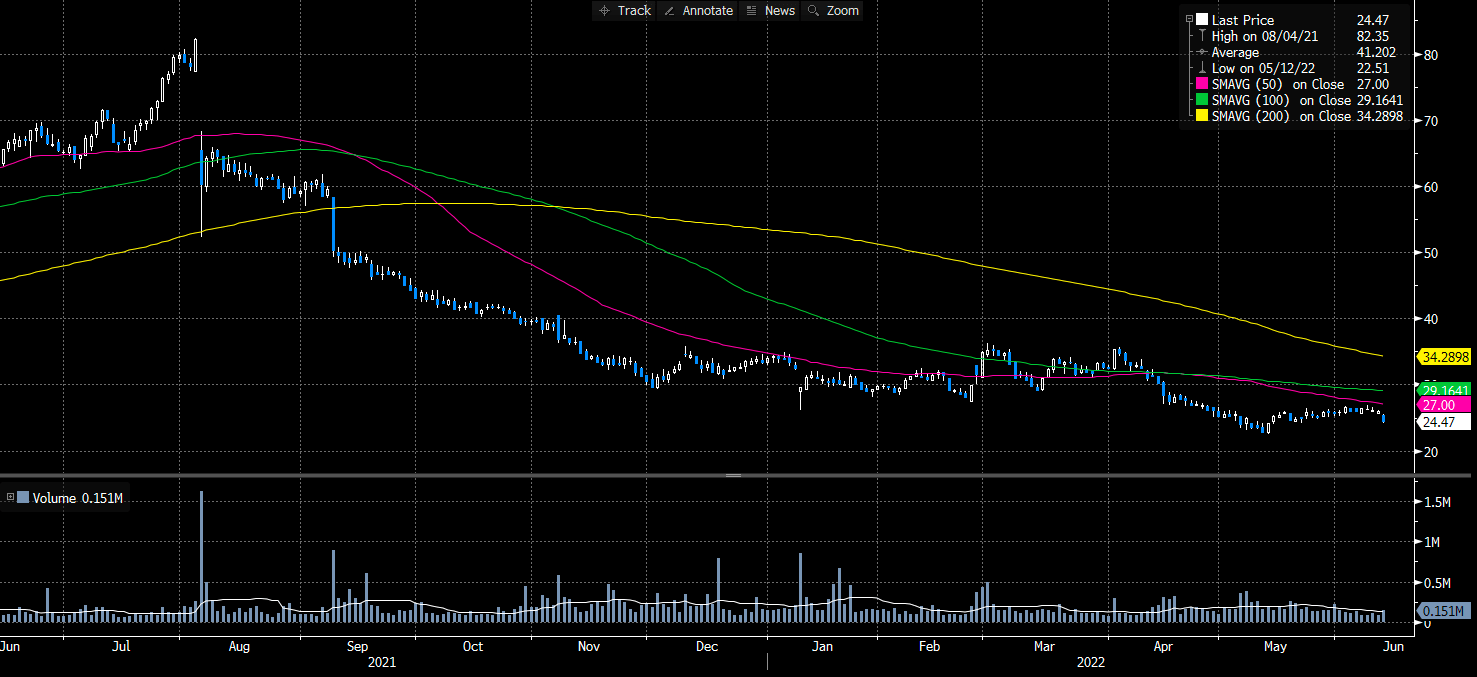
Pricing dynamics are more extreme in the portable oxygen concentrator (“POC”) market relative to others. INGN’s product mix is the most expensive option within the segment. This threatens margin growth and price elasticity to adjust for competing cost structures. Its direct-to-consumer (“DTC”) and business-to-business (“B2B”) segments have also been adversely impacted by the pandemic, after a sharp reversal in sales rep productivity.
Without clarity on each of these listed factors, there’s no flesh to put on the skeleton of the company, in our estimate. INGN has a ways to go in order to regain investor trust, as well. Longer term, it becomes a question of sales rep productivity and ability to absorb cost inflation at the margin level. Alas, INGN presents with the ‘unhappy triad’ of seasonal FCF, tightening margins and supply chain headwinds, keeping us neutral here. Here, we present a high-level view of the moving parts in the INGN investment debate.
Supply chain, cost-pressures imminent
INGN continues to realise headwinds at the supply chain level. Specifically, semiconductor chip shortages continue to put a clamp on battery supply for its POC segment, slowing output. Higher COGS were realised in Q1 FY22 compressing gross profit by ~300bps YoY. Consequently, gross margin tightened more than 700bps sequentially and ~600bps YoY. These cost pressures appear well set in stone. Our modelling suggests GMs will normalise at ~45% into Q1 FY23, with GMs stretching back up to ~50% by FY25 on an annualised basis. Whilst its supply chain continues to be constrained, the pressure from COGS onto INGN’s margins and operating leverage remains. INGN has normalised operating leverage at -3.4x, demonstrating how operating income has low sensitivity to changes in revenue. This is a risk for the company that investors must factor into the debate. It’s INGN’s ability to absorb these supply chain and cost headwinds at the margin level that will ensure it feeds quality earnings and cash flow below the bottom line – factors that are paramount in the current macro-climate.
The question is how can INGN wind up operating income if sensitivity to revenue is low, and revenue is at risk anyways. In the meantime, management has said it has started to pass through costs to try and offset further margin pressure. It’s also started to re-engineer some POC components to overcome the semiconductor issue – a current industry/sector standard. Moreover, lagging growth in its DTC and B2B segments has further dampened potential for margin growth. As a result, adjusted operating margins were 1,400bps lower YoY to -17% last spring, well below 3-year normalised operating margins of 0.33%. Sales growth has been stagnant in the 3 years to date, but was struggling even pre-Covid. Three-year sales growth has normalised to just 0.8% YoY into FY21. Profitability is equally as weak. ROA has come down markedly since peaking at 16% in FY18 to -1.7% in FY21 and -4% in Q1 FY22. ROIC has followed suit sliding from 19% to -1.8% and -5% in the same time.
Furthermore, FCF is seasonal for INGN and FCF margins have been lumpy over the last 3 years to date. Shareholders currently realise a -3.6% FCF yield whilst 3-year FCF margins normalise to just 5% in the last 3 years. It also printed a loss of $22 million in FCF in the last filing. In this sense, INGN’s share price is converging to its bottom-line fundamentals, as the market unwinds its high-beta and high growth trade in 2022. The seasonality in its FCF also dampens the predictability of its future cash flows, and FCF leverage has been equally as soft for the name like its operating leverage. The trend in FCF appears to remain in situ for INGN as well, with our estimates in line with consensus on FCF into the coming years.
Exhibit 2.
Data: Bloomberg, INGN SEC Filings FY18–date. Image: HB Insights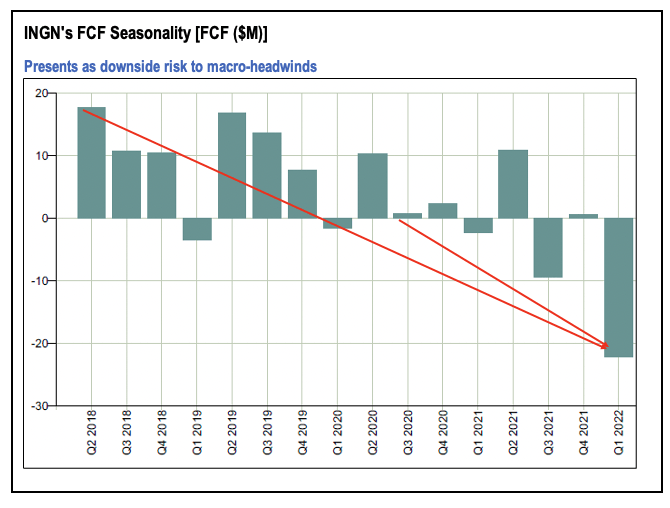
Exhibit 3.
Data: Bloomberg, INGN SEC Filings FY18–date. Image: HB Insights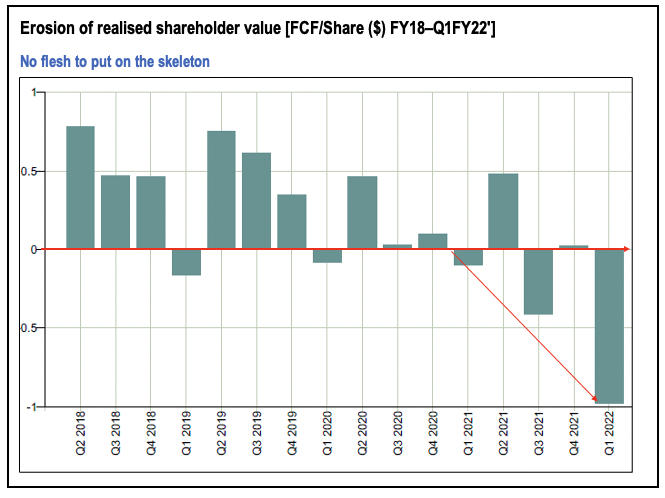
We model INGN to print a loss of FCF of -$23 million in FY22 and just ~$600,000 in FY23. Cash from operations has also slipped from $60 million in FY17 to just $24 million in FY21, whilst revenue increased and gross margins have gyrated in the same time. There’s accounting reasons for this that are beyond the scope of this report, but in short, we feel the pattern of cash conversion is a risk to be taken seriously. With that in mind, there’s a lack of realisable shareholder value in the near term for this company.
Exhibit 4. Share price converging to bottom-line fundamentals
Data & Image: Bloomberg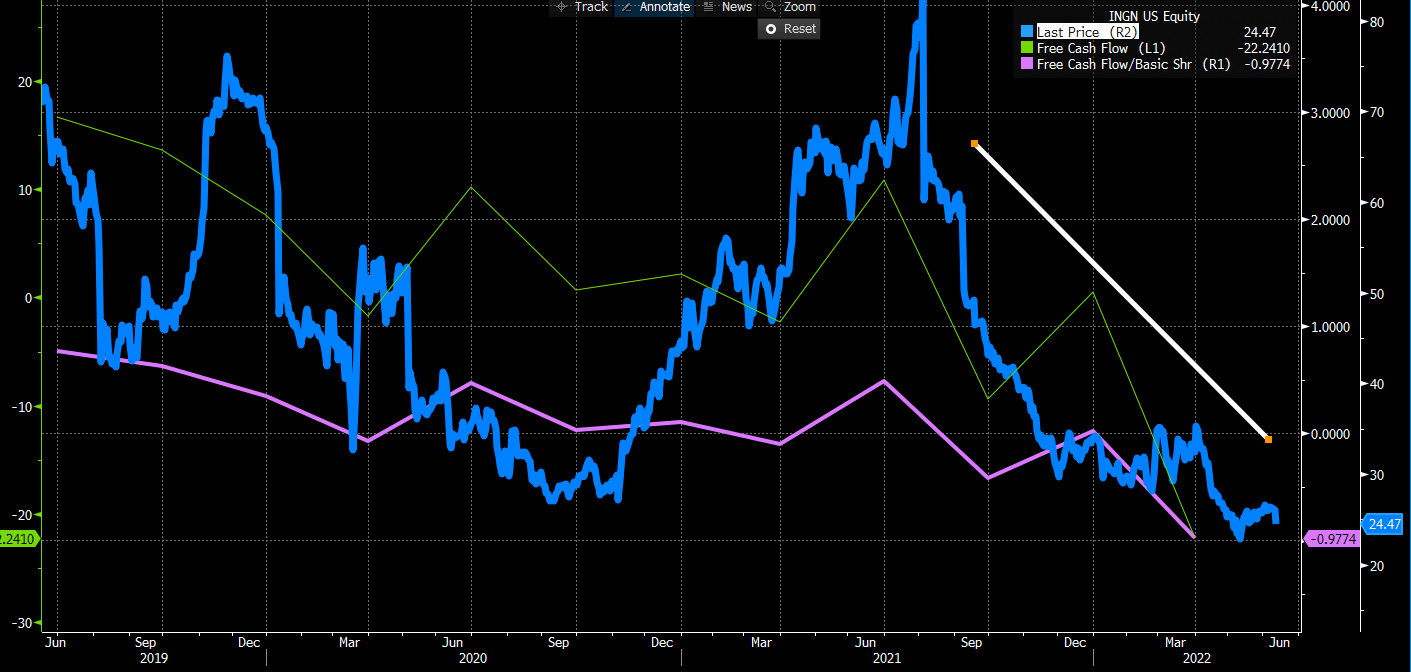
Balancing factors in the investment debate
Despite its poor cash conversion, INGN’s balance sheet remains robust, and its capital structure is noteworthy. It left the quarter with just over $220 million in cash, and $24 million in LT debt made up of operating leases and recorded under IFRS 16/ASC 842. Even with these marked on the balance sheet, total debt to total capital is just 7%, whereas the debt ratio is only 5%. Hence, rates sensitivity is low. The question then is how well it has managed working capital and liquidity amid current supply chain headwinds. The answer is, reasonably well. Short-term liabilities are 5x covered from liquid assets and 3.7x from cash. It has a cash runway more than sufficient to last over the next 2 years, whilst its cash conversion cycle has come down from 78 days to 67 days in the past 2 years, whilst inventory turnover has increased to 5.95x. Total inventory has also increased in this time, particularly since 2021 amid supply shortages, so not surprising.
Moreover, INGN put its new salesforce to the test last quarter. It has a new, physician focus. If anything is to drive its DTC business, it’s the productivity of its rep headcount. Noteworthy is INGN has an agreement with Ashfield Healthcare, seeing it add another 19 reps to the headcount, building the total to 54. It also added 12 ‘concierge’ reps to support productivity. The focus is on the DTC rental business, as this is where patients are actually prescribed treatment and have this covered by Medicare. Management are also confident on instilling somewhat of a regime shift to providers in helping patients convert to POC’s from tanks earlier in their protocol. Perhaps most importantly, is the reps will be strategically targeting high-volume O2 prescribers. The aim is to stretch prescriber coverage from 40% up to 65%.
However, there is a lot of assumption in this optimism that requires an awful lot to go perfect. First, is the assumption that all the reps will be productive, and equally as productive as each other. Those familiar with our Zynex (ZYXI) coverage will note this isn’t the case – its attempt to build a 500 strong headcount were marred by this very issue.
Second, is rep productivity. Before the new 19 additions, this would have been 35 reps, meaning a revenue per rep of $140,000 in Q4 FY19 and $1.3 million in FY21 total in its DTC rental business. For DTC total, it’s $4 million/rep for FY21. Just 6% and 13% of the sales mix was attributable to DTC rentals in Q1 FY22 and FY21 respectively. Keeping these as forward assumptions, with the new 54 headcount, this calls for a revenue per rep of $111,000 in Q2 FY22, and $902,000 for FY22 to meet guidance.
These are lower targets vs. FY21, and there is good chance the company can meet this should everything go according to plan. Although, numerous systematic and macro-specific risks are plaguing the prospect of this happening, so we are cautious on this outlook. Nevertheless, $111,000 per rep in its DTC rentals business is a key litmus test for the company in Q2 FY22.
In short
Supply chain pressures only add further downside risk in the INGN investment debate. Investors will expect to pay ~1x forward sales for seasonal FCF performance and lumpy forecasts. One has to question if this is a fair pricing point for INGN. In our estimation, there appears to be little to no upside momentum in the investment debate. We rate neutral on these grounds.
Be the first to comment