

Cylonphoto
Investment Summary
After its latest numbers we are back to reiterate our hold thesis on InfuSystem Holdings, Inc. (NYSE:INFU). Management are more pessimistic about FY22 full-year numbers and have averaged down FY22 guidance from previous estimates. The company’s Q3 results were also behind internal expectations. The market has definitely taken notice of this, with the stock moving nowhere since it posted Q3 earnings, whilst many comparable names rally alongside broad equities. Net-net, we rate INFU a hold and revised our target down to $3.50.
See our previous publication’s on INFU here:
- InfuSystem: Strength in Core Business Hedges Covid headwinds
- InfuSystem: Profitability, Earnings Trends Justify Valuation Discount
Key upside risks to this price target include [also found at end of publication]:
- Bear-rallies in the INFU share price that are swift and spectacular in nature, resulting in short-term upside beyond the current market price.
- Reversal in macroeconomic data resulting in broad market rally in equities.
- INFU comes in with tremendous upside price at its next earnings print for Q4 FY22 or for FY22 total.
- These risks would result in investors pushing the INFU share price higher beyond our price target by estimation.
INFU 2-year weekly price evolution
Data: Updata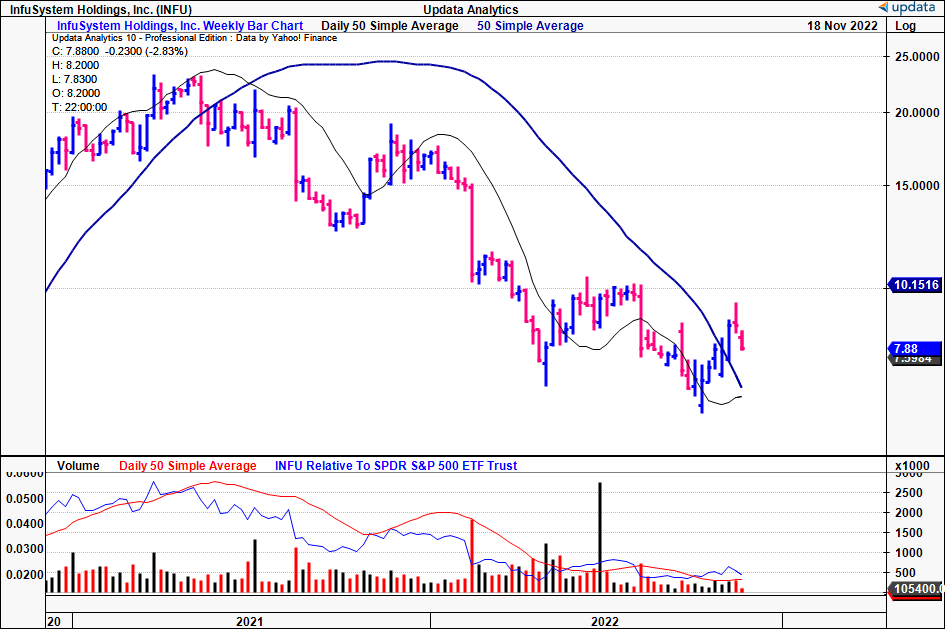
INFU Q3 earnings behind expectations
Touching firstly on the 3rd quarter results, we note the company booked a record quarter in revenue, with a 3% YoY growth to $27.3mm. Although, we’d also note these numbers fell “well short of [its] expectations” according to management.
Growth was underscored with a 400bps YoY net gain in the IPS division, and 37% YoY growth booked in its pain management business. Gross profit of $16.2mm – also a quarterly record for INFU – pulled to core EBITDA of $4.38mm.
Whereas net CFFO was down both YoY and sequentially to $3.46mm for the quarter. For the 9 months to date, INFU’s realized $12.95mm in net CFFO, down from $14.6mm by the same point in FY21. INFU also clipped $0.02 in quarterly EPS, a turnaround from the $0.02 loss per share a year ago.
Switching to divisional highlights, our takeouts are as follows:
1). The DMA segment contracted 41% from this time last year on lower equipment sales volume. This was due to seasonality management says. Upsides in the rental and biomedical services unit[s] of 13% each respectively offset this decrease.
2). Importantly, INFU booked first revenue under its agreement with GE Biomedical Services. As a reminder, the agreement involves INFU performing maintenance and repairs both on-site at hospitals and off site at its service centres.
It has now onboarded ~27,000 devices, just under 15% of the devices needed “to reach the midpoint of our annual revenue goal of $10 million to $12 million under the contract”, per management. The next evolution of the contract is set to involve GE’s asset management system using RFID tracking, INFU said on the call. This is the first program outside of preventative maintenance under the GE contract and a definite step in the right direction by our estimation.
Management believe that it can boost the revenue potential above the $10-12mm original estimate. However, just as with this quarter, the company has a history of missing both internal guidance and Wall St estimates [Exhibit 1]. Hence, this must be factored into all future projections in our belief.
Exhibit 1. Wide variance in quarterly EPS consensus vs. actuals FY21 to date [Note: chart/date axis to be read from RIGHT to LEFT]
Note: Dates are in ascending order from RIGHT to LEFT respectively. (Data: Refinitiv Eikon, Seeking Alpha, HB Insights)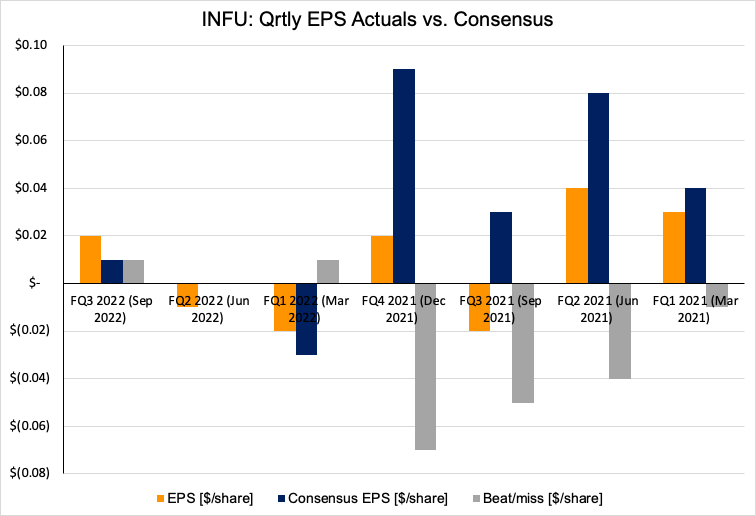
3). Despite a 37% YoY growth, the pain segment was also an under-performer according to management. Expectations were in fact for much higher growth percentages. It expects a lower trending growth rate into Q4 FY22 as well, due to the slow onboarding of new customers.
We should also note the company’s partnership with Ventis Pharma became effective in Q3. This will see INFU combing its infuBLOCK standalone treatment with Enduracaine for pain management, and could be a mid-term growth driver for the company in our estimation.
Guidance numbers less encouraging
Speaking of guidance, management see 10% YoY growth or ~$112mm at the top-line for FY22. This rests at the bottom end of range, with adjusted EBITDA projected to $22mm, or ~19% or turnover.
We think INFU will hit these kind of numbers at the top in FY22, stretching up to $123mm the year after at its current run-rate. This is driven by its key collaborations and the potential for the GE partnership to widen up further [like with RFID, etc].
Despite a reasonably strong revenue curve, we can’t foresee the same for INFU at the bottom-line looking ahead [Exhibit 3]. OpEx continues to pressure margins vertically down the P&L. The company is only managing $1-$1.5mm in quarterly operating income since December FY20.
This is coupled with very lumpy core EBITDA growth and equally turbulent EPS growth to date. We estimate these trends will continue into the coming two years, with macroeconomic headwinds [inflation, rates, etc] playing a key role in our assumptions.
These flat EPS growth estimates are supportive of a neutral view.
Exhibit 2. INFU Forward Revenue Bridge FY22-24′ [Qrtly, Annual]
Data: HB Insights Estimates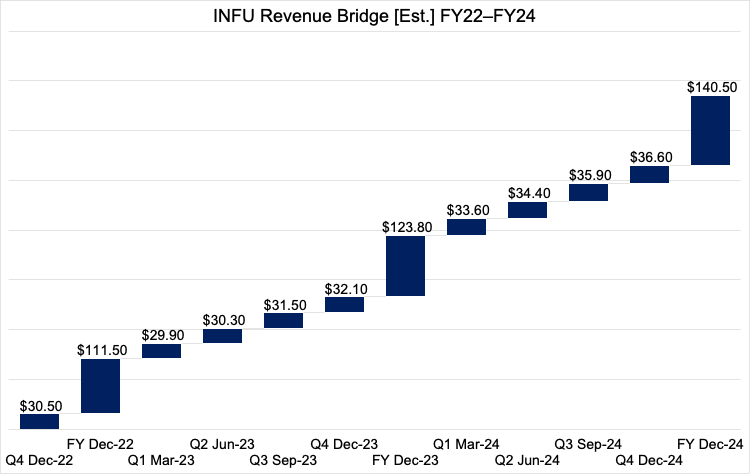
Exhibit 3. INFU Forward EPS estimates FY22-24′ [Qrtly, Annual]
Data: HB Insights Estimates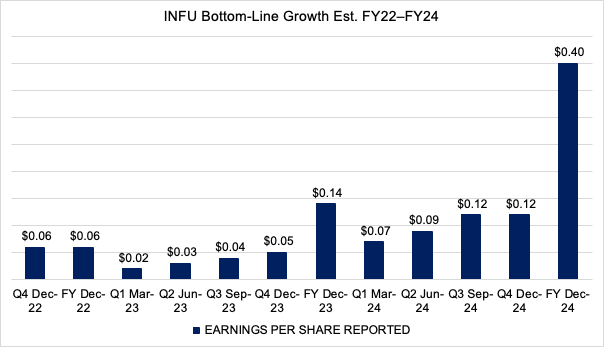
Valuation and conclusion
Shares are more than richly valued at 13.8x trailing EBITDA and nearly 3.5x book value. Consensus has INFU valued at 56x forward earnings, quite the premium in our opinion. For contrast, consensus estimates for the S&P 500’s forward P/E are ~18.18x, hence, consensus expects INFU to outperform the benchmark.
However, we’d note The Street’ also has INFU to print just $0.04 in non-GAAP EPS for FY22. We estimate $0.06 per share. These are hardly grand totals to be working off, especially with the stock trading at such a high forward earnings multiple.
With management less optimistic on the sales ramp looking forward, it’s difficult to see INFU trading fairly at a multiple 130% higher than the sector median of 25.5x. We believe INFU should instead trade in-line with its peers.
Looking ahead to our FY23 EPS estimates of $0.14 [Exhibit 3], and applying the sector multiple of 25.5x derives a price target of $3.50, off our previous target of $4.40 [25.5 x 0.14 = 3.50]. This confirms our hold thesis.
Net-net, we rate INFU a hold on the premise there are more selective opportunities right now and that the company needs to pick up its game and drive revenue and EPS upside beyond its current growth percentages. Until then, it’s difficult to see the market rewarding INFU with tremendous upside in our opinion. We revise our price target down to $3.50 and look forward to providing additional coverage.
Key upside risks to this price target include:
- Bear-rallies in the INFU share price that are swift and spectacular in nature, resulting in short-term upside beyond the current market price.
- Reversal in macroeconomic data resulting in broad market rally in equities.
- INFU comes in with tremendous upside price at its next earnings print for Q4 FY22 or for FY22 total.
- These risks would result in investors pushing the INFU share price higher beyond our price target by estimation.
Be the first to comment