

Dr_Microbe
Investment summary
We are sharing our thoughts and reasoning behind a position we have entered for Inari Medical, Inc. (NASDAQ:NARI) on July 19 FY22. We are long NARI shares and are seeking a near-term 25% return objective to an ending target of $98.5-$100. Several of our indicators have indicted there is near-term alpha to be harvested from this name.
We define near-term as four months. We demonstrate that market and technical factors, plus valuation, underscored this decision. We’d first just like to stress before continuing that this is not an investment recommendation nor do we advocate you follow this placement at all. The report instead focuses on our reasoning behind the trade, to help investors in their own investment reasoning.
Trade thesis:
BUY 2,530 NARI SHARES at $79.05/SHARE for 2,500bps [$200k principal] // 70bps value asymmetry- PAY $74 at 9.35x book value; 28% return objective to $100
NARI shares have caught a bid since May FY22 amid a sector rotation back into health care. The stock has tested support once and crossed above both exponential and simple moving averages (“MA”s) in May and then again in June. As seen in Exhibit 1, it tested both MAs in July again before bifurcating upward in a narrow distribution.
The market is starting to recognize NARI. Buyers have been attracted to its exposure to the alternative risk premia underscoring equity returns in FY22. For instance, low-beta, low-volatility plays have outperformed in FY22. In fact, that is where the alpha is positioned in this trade, is in NARI’s exposure to these and other idiosyncratic factors. It isn’t beta, as reduction in equity beta is one of the very factors.
In that vein, we’ve identified several points in confluence that look to separate NARI from peers looking ahead. The key differential is NARI is shifting its covariance structure down relative to the benchmark, reducing equity beta. More so, it presents with technical factors that are supportive of near-term price action. We are seeking a return of ~28% to a price objective of $100.
Alpha/Return period: July 19 – November 30 FY22. NARI set to report Q2 earnings on 03 August FY22, baking in an EPS surprise to the upside as a near-term catalyst. Should it re-rate, we estimate the post earnings announcement will drift to the upside into November. Research corroborates this time-length post surprise. Plus, the market is rewarding of bottom-line fundamentals in FY22, and we believe our findings are indicative of this picture.
Exhibit 1. NARI breakout from inner-support ranges, trades above MA’s
Data: Updata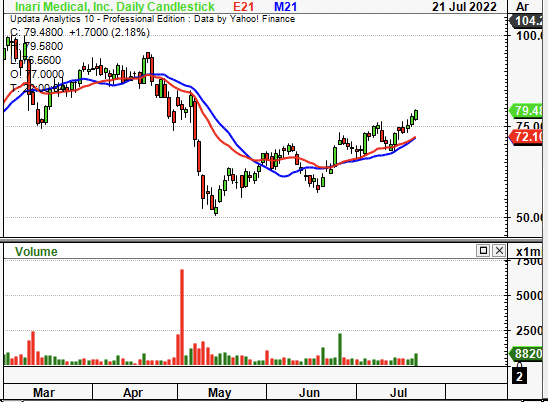
Risks
The major downside risk to our strategy here is thesis drift, whereby the investment proposition effectively dries up. Firstly, NARI could come in well behind with earnings and investors will price this into the downside. Although, if it comes in-line, this is bullish too, by estimate. There’s also risks the company could incur macroeconomic headwinds, and it is not immune to the systematic risks investors will continue pricing in, on any whisper of geopolitical tension.
Market volatility is still around and can impact our markets at any stage. Whilst we run effective hedges just out of the money, ideally, they stay there. Moreover, there is chance the market will disagree entirely and punish the stock more than 8% below our entry price of $79.05.
Thesis backdrop – market factors
The high-beta growth trade has unwound itself in FY22. Central bank tightening and inflation dominate the narrative whilst price action in markets has whipsawed. As such, low-beta, strong-performing names have delivered outsized returns this YTD.
On that, NARI has caught a bid since May, and is pushing back towards range. The company is strengthening against the benchmark, all whilst its equity beta is shifting down. These are desirable characteristics that investors are paying a premium for in FY22, and look to continue doing so moving ahead. As seen in Exhibit 2, the divergence in equity beta to share price and relative strength is abundantly clear from May.
Exhibit 2. Down-shifting covariance structure and is gaining against benchmark
Investors are paying a premium for these characteristics and look set to continue this trend into the coming periods
Data: Updata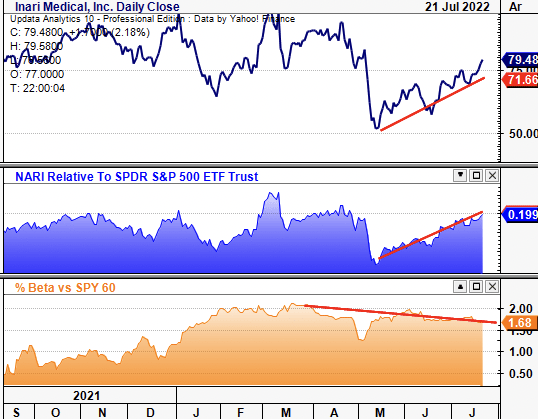
As a clear indication of NARI’s differentiated strength, it has also been gaining against the medical devices and health care equipment sector since May. As seen below, it has rallied again once the NARI share price found a bottom, it immediately began to outstrip peers on the chart. With investors rewarding idiosyncratic risk premia over beta this year, this illustrates a high-alpha setup by our estimation. Combined, these factors display the market criteria required for NARI’s potential upside capture.
Exhibit 3. NARI has gained against the sector and is now outstripping its peers
Provides solid bedrock to budget risk towards the name
Data: Updata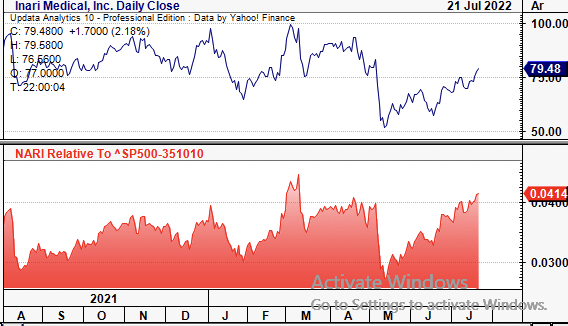
Fundamental factors
Impressively, both sales and gross profit have grown markedly over the past 3 years to date. However, operating profit has lagged on a quarterly basis, as has FCF conversion, seen in Exhibit 4. In its most recent filing, both were compressed and NARI printed a loss of FCF. Investors have shied away from top-line growth in FY22 and are rewarding bottom-line fundamentals, we’ve found. We estimate operating expenses of $370 million in FY22 and see this growing to around $400 million in FY23. We also see NARI printing an operating loss of ~$30 million this year and then operating profit of $9.2 million the year after. This actually sits above the sell side, who forecast sales of $365 million and an operating loss of around $38 million in FY22.
Exhibit 4. Sales and gross profit continue to widen whilst FCF has been lumpy of late
Data: HB Insights, Refinitiv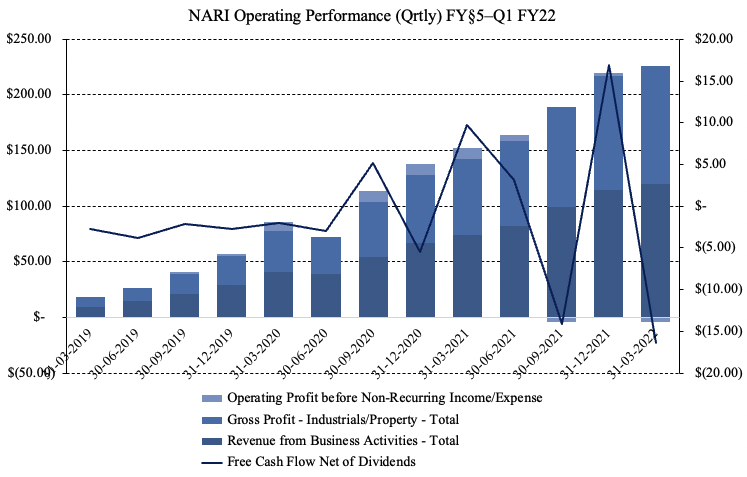
Profitability trends are on our side and have been growing throughout the pandemic. Whilst FCF has been lumpy and was last at a loss of $16 million in Q1 FY22, in FY21, the company became free cash positive with a $15.78 million result. Investors currently realize a -0.2% FCF yield from Q1 FY22. We’ve forecasted it to deliver FCF of ~$17 million in FY22, providing solid backdrop for investors to reward the name come earnings time.
Exhibit 5. FCF positive in FY21 and trends look to continue
Data: HB Insights, Refinitiv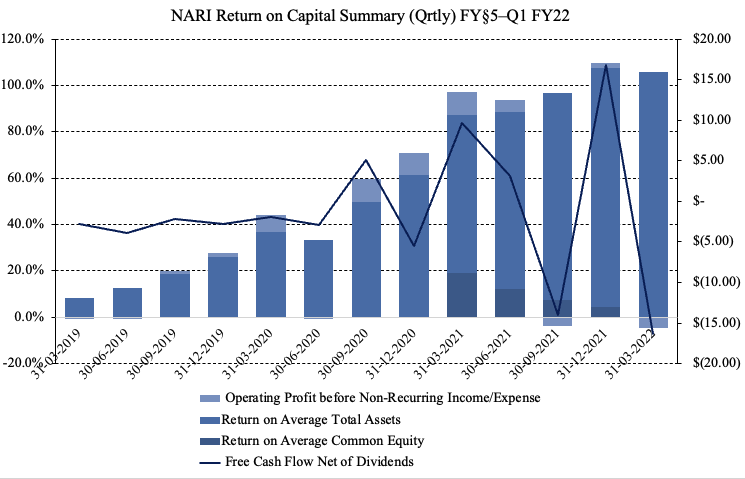
Where the long-term investment case weakens for NARI is valuation. It is currently trading at 16.7x book value, and around 9.3x EV/book value. These are well below historical averages, but still lofty. However, the stock has shown signs of re-rating this year and has reverted towards the mean. As we discuss below, this is supported by technical price action. As seen in Exhibit 6, the stock has pushed north since mid-2022 and could potentially revert to its 2-year average. Question is, how pricey is the average at 16.7x for NARI?
Exhibit 6. Trading below historical averages relative to book value, showing mean-reverting behavior
Data: Refinitiv Datastream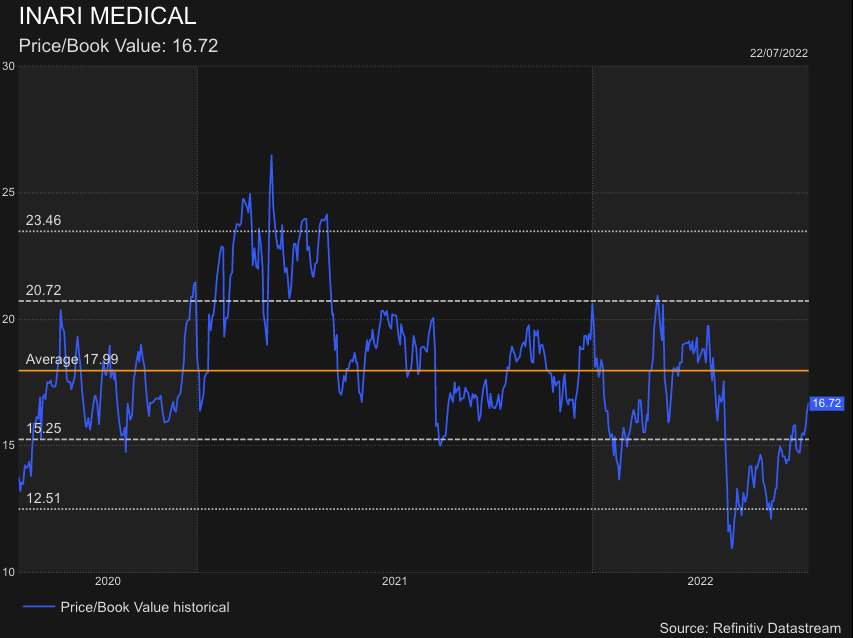
To answer how ‘expensive’ NARI is or not in terms of value, we will price the stock and examine it in absolute terms (instead of using comparison to peers). NARI is trading on a 9.35x EV/book value, whereas shareholders currently own $418 million in equity in the company. On these figures, if we were to pay 9.35x book value there’s a mispricing showing a $6/share differential, based on what we’d theoretically ‘pay’ (Exhibit 7).
Next, as seen below, we calculate conventional return on our equity (“ROE”) and FCF return on equity (“ROE[FCF]”). NARI recorded a ROE of 4.48% last quarter. Using FCF as a measure of profitability instead, there’s a 68bps decrease to 3.8%. However, that is NARI’s ROE/ROE[FCF], not our return on equity as shareholders. For us, we paid 9.35x book value, meaning we overpaid [the only way we could say we got a “fair” price is at 1x (maybe 2x) book value]. Hence, adjusting for this, we notice our ROE and ROE[FCF] drop substantially to just 0.48% and 0.4% respectively. The equity duration on our conventional ROE[FCF] equals around 18 years. However, for us at ~0.4% is negligible.
Exhibit 7. ROE and ROE[FCF] measures on investor equity are thin and offer little long-term upside- near-term thesis far more compelling
Data: Refinitiv, HB Insights Estimates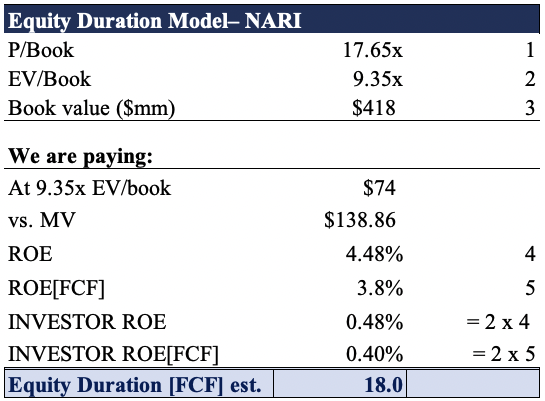
Alas, the long-term case for compounding capital is weakened for NARI, and therefore the near-term investment thesis remains far more compelling. This adds further weight to our view that we can harvest double-digit upside in the coming months.
Technical factors
In that vein, technical studies are supportive of near-term upside. Point and figure charting reveals price action has broken above an outer resistance trend and is now sending off price objectives to $97. Price action has turned bullish and we see this as confirmation of a reversal and look to the $97 level as one key cluster zone, as seen below in Exhibit 8.
Exhibit 8. Multiple upside targets, broke above outer resistance amid reversal to upside
Data: Updata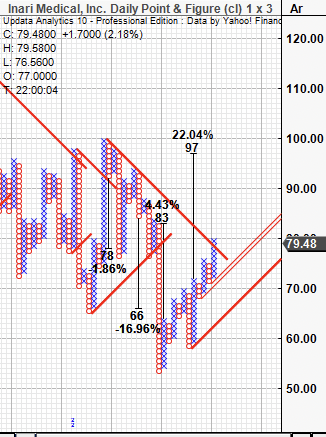
Moreover, tracing the fibs down from its previous high in March, we note the stock has already retraced back above 50% of the downward leg and is now testing the 61.8% tab. The 50% tab is a key level, as seen via the red-dashed line below, whereby NARI has garnered support 3-4x at this level back in December-February.
Exhibit 9. It now looks to test ~$80 at the 61.8% and we look to bullish upside targets at $89 and then at $99.89 based on this chart presentation.
Data: Updata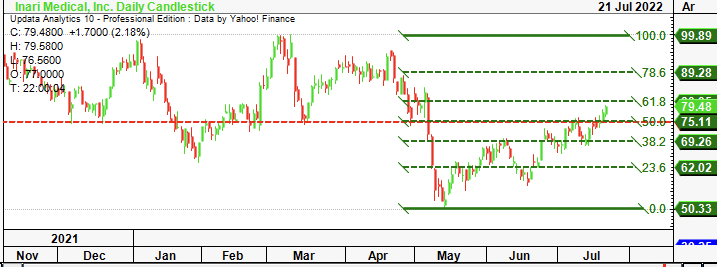
Adding weight to our directional thesis here is the respect and validation NARI has displayed to the fibonacci retracement drawn. As seen below, it has attracted buyers (sellers) at key fibonacci levels and at each nudge of a new zone either reverses or extends its rally. With this in mind there looks to be good confluence it is adhering to behavioral trends this indicators seeks to exploit. We’ve set stops at $72 for now as seen in the red line below the candles below. We will look to move these up to $80 if we get a move past that point.
Exhibit 10. High confluence with various markets on the fibonacci retracement drawn from March high to May low
Data: Updata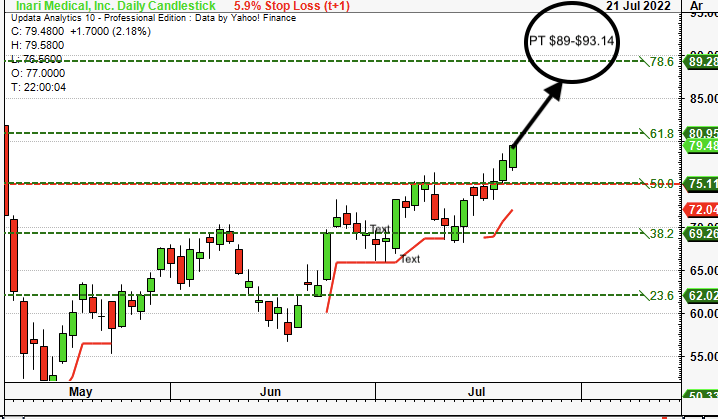
On the cloud chart, we believe this could be a key inflection point or the stock. It is now broken back up through cloud support and the lag line is testing the cloud and this is bullish confirmation if it passes through. OBV has shown a reversal and is beginning to curl up as well whilst momentum has joined suit when the stock found a bottom in May. These trend indicators look to have shown a trend reversal and are curling up to suggest the latest uptrend in the NARI share price is being validated, by estimation.
Exhibit 11. Above cloud support with lag line testing the cloud. Key inflection zone and will run bullish if line breaks through, by estimation.
Data: Updata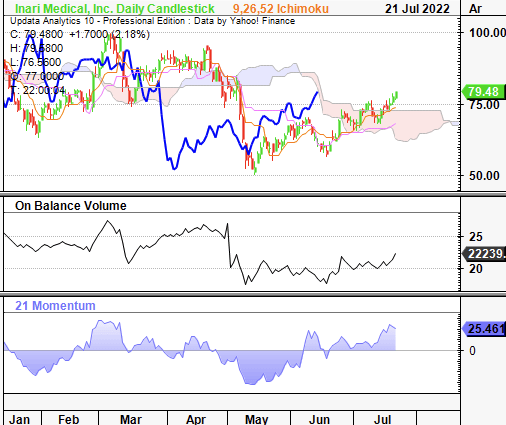
Again, these studies are supportive of bullish price action with a near-term horizon in mind. If the lag line breaks through the cloud, then we believe this is firm confirmation the uptrend has started, and should be a key indicator that investors look out for, for sizing, entry and exit requirements. Net-net, we’ve priced the stock at $98-$100 in the near-term based on these technical price targets and are seeking ~28% return objective in this time.
Summary
We have a bullish near-term view on the NARI share price and believe there is actionable alpha to be captured in the name over the next 4 months, before its Q3 earnings. This report outlines our reasoning behind the trade thesis, and whilst we don’t advocate investors copy at all, hopefully there is some insight derived into the systematic investment selection process. In turn, we hope to help investors with their own investment reasoning.
We are seeking a ~28% return objective for short-term upside capture over the next 4 months. We hope to re-evaluate or exit the position by November towards the stock’s next earnings. In that vein, we rate NARI a buy.
Be the first to comment