


skynesher
Investment Thesis
Two ETFs dominate the mid-cap blend segment of the U.S. equity market: the iShares Core S&P MidCap ETF (NYSEARCA:IJH) and the Vanguard Mid Cap ETF (NYSEARCA:VO), with $67 billion and $145 billion in assets under management, respectively. Long-term performance slightly favors VO, but IJH closed the gap on both returns and risk-adjusted returns in recent years. With expense ratios of 0.05% and 0.04%, you may assume they’re equally attractive. However, this article aims to describe how they have substantially different investment characteristics. One is the clear winner, and that’s IJH.
IJH’s constituents have superior earnings growth, cheaper valuations, and stronger earnings momentum. Notable negatives include increased volatility and somewhat questionable quality. However, style purists will appreciate how there’s no overlap with S&P 500 Index ETFs, and I think it’s a more straightforward way to diversify by size. I look forward to explaining how each ETF is designed and how they compare fundamentally in this article.
ETF Overview
Strategy Comparison
IJH tracks the S&P MidCap 400 Index, a collection of 400 securities selected by an Index Committee with market capitalizations ranging from $3.7 billion to $14.6 billion. As part of the S&P 1500 Composite, the Index requires constituents to have positive trailing twelve-month GAAP earnings and positive GAAP earnings in the most recent quarter. However, there is no reconstitution date, as the Index Committee makes changes on an as-needed basis. According to the Index brochure, deletions “may occur due to bankruptcy, mergers, acquisitions, significant restructuring, or substantial violation of one or more of the eligibility measures.” The approach aims to keep portfolio turnover low and suitable for long-term holding.
VO tracks the CRSP US Mid Cap Index, selecting companies that fall between the top 70-85% of U.S. market capitalization. This selection universe is more comprehensive than S&P’s (approximately 6%). As a result, VO appears better diversified, at least at the sector level. Since its market capitalization breakpoints are dynamic, there’s a 17% overlap by weight with the S&P 500 Index. Investors should be aware of this inefficiency, but unfortunately, VO overlaps similarly with the Vanguard Large Cap ETF (VV). S&P Indices are more appropriate for style purists, as there is no overlap with its size indices.
Sector Exposures and Top Ten Holdings
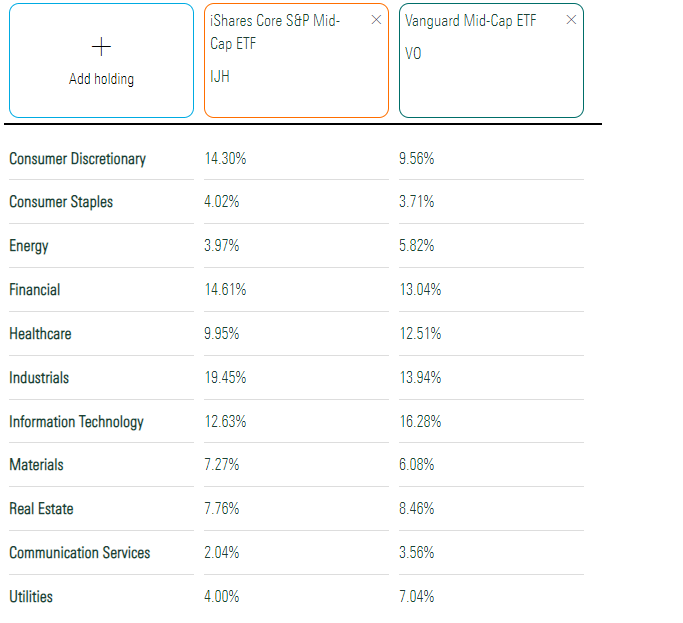
Sector exposures for IJH and VO are in the table below. It’s our first clue that although both aim to represent the mid-cap segment of the U.S. equity market, they do so in different ways. For example, IJH favors Consumer Discretionary and Industrials by 4.74% and 5.51%. In contrast, VO overweights Technology and Utilities by 3.65% and 3.04%, with minor differences occurring in the remaining seven GICS sectors. Neither ETF is particularly defensive or a great inflation hedge, with Consumer Staples and Energy exposures only 4-6% each.
Morningstar
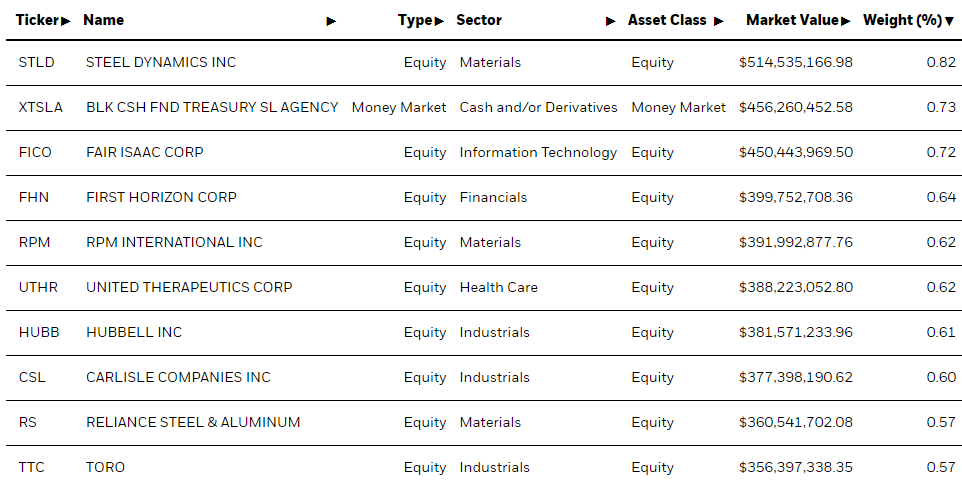
IJH’s top ten holdings are below, led by Steel Dynamics (STLD), Fair Isaac (FICO), and First Horizon (FHN). These holdings total just 6.50%, a consequence of not including any large- or mega-cap companies. Diversification is a selling point for these smaller indices.
iShares
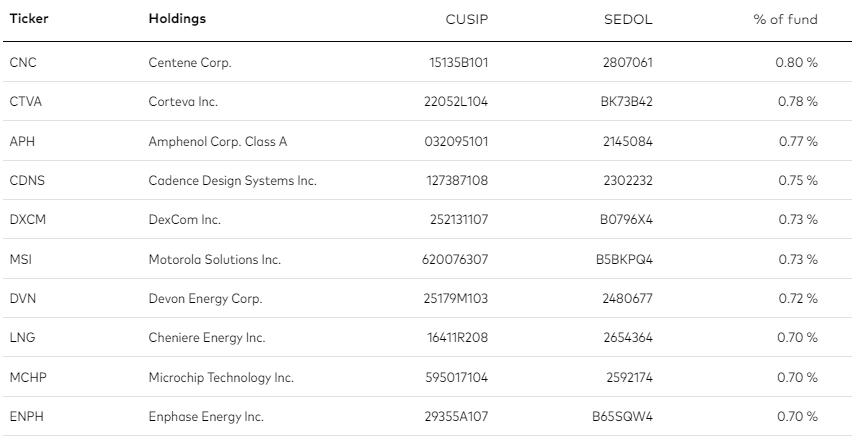
VO’s top ten holdings are below, led by Centene Corp. (CNC), Corteva (CTVA), and Amphenol Corp. (APH). Again, this list isn’t too representative. Also, please note that Vanguard only updates its holdings once per month, and these weightings are as of November 30, 2022.
Vanguard
Performance
IJH launched on May 22, 2000, while VO launched nearly four years later on January 26, 2004. Fortunately, we can compare apples-to-apples by backfilling VO’s results with the Vanguard Mid Cap Index Institutional Shares (VMCIX).
Portfolio Visualizer
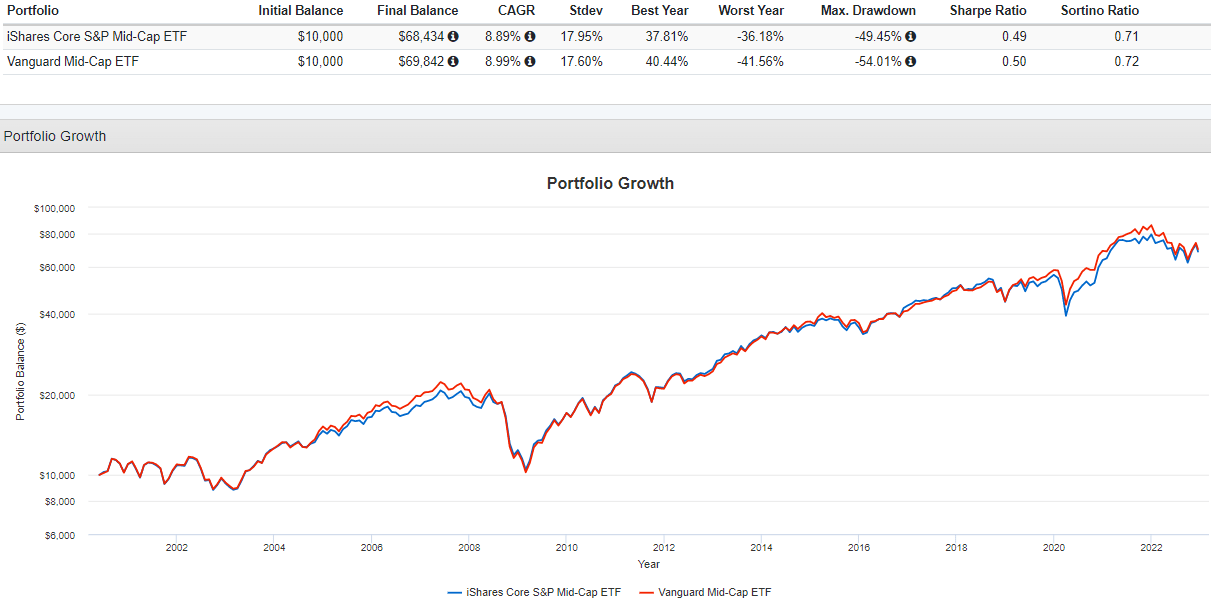
IJH and VO gained an annualized 8.89% and 8.99% over the last 22+ years with nearly identical volatility, measured by standard deviation. The log chart does an excellent job highlighting the strength of returns after the Great Financial Crisis ended around February 2009. Both ETFs were underwater in the early 2000s because of the dot com bubble crash.
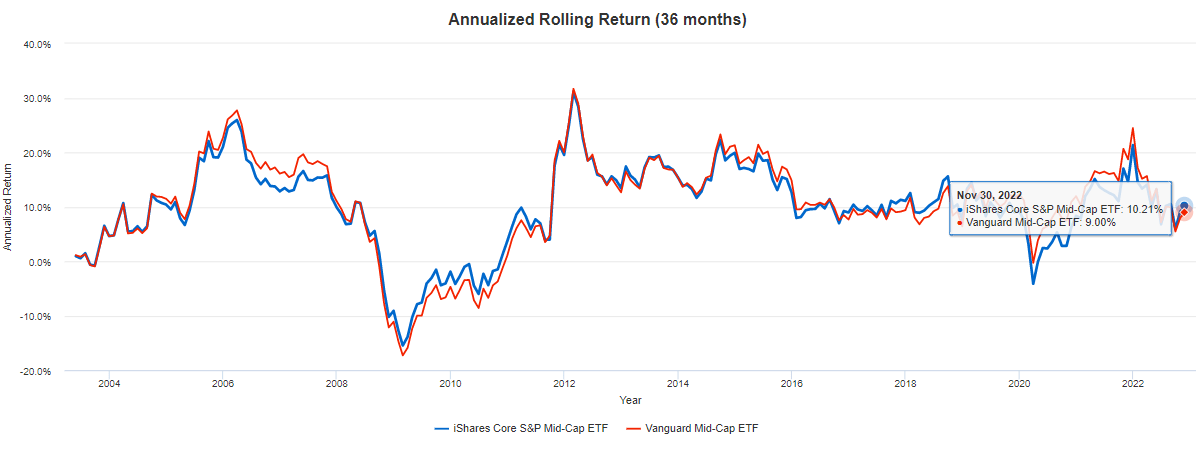
Still, this long-term chart doesn’t make our decision process any easier. Instead, let’s look at rolling three-year returns to understand better when each ETF performed well.
Portfolio Visualizer
As of November 30, 2022, IJH returned an annualized 10.21% vs. 9.09% for VO over the last three years. Interestingly, in March 2020, IJH’s annualized returns were 3.86% worse, so it made quite a significant comeback recently.
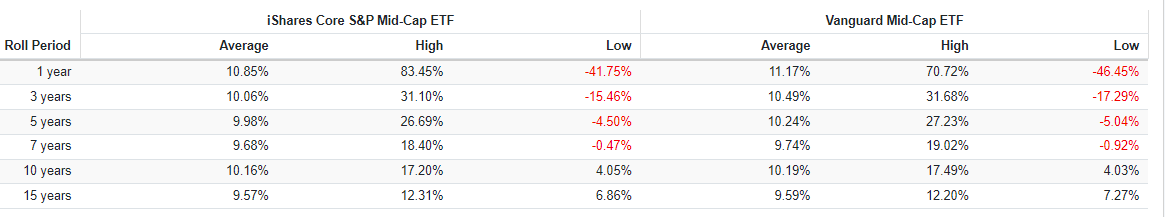
This last table highlights additional roll periods, demonstrating that VO was the better bet. Its average returns for all periods listed are superior.
Portfolio Visualizer
Fundamental Analysis
IJH Top 25 Industries
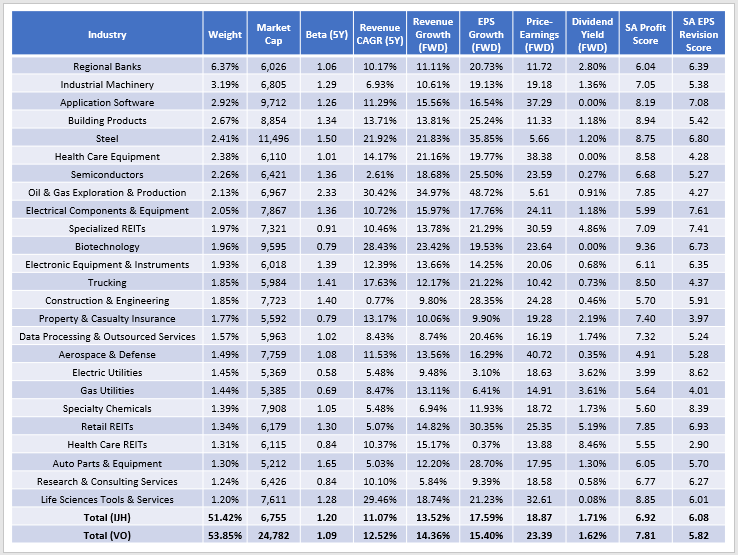
The following table highlights selected fundamental metrics for IJH’s top 25 industries, totaling 51.42%. Regional Banks is the largest industry at 6.37%, including First Horizon National (FHN), Cullen/Frost Bankers (CFR), Webster Financial (WBS), and 24 others.
The Sunday Investor
IJH has a five-year beta of 1.20, indicating higher market volatility than VO. I link this to the lower market capitalization figures ($6.8 billion vs. $24.8 billion), as smaller companies are often more volatile. Interestingly, VO holds 217/349 stocks with market capitalizations above the $14.6 billion threshold set for IJH. These companies total 80.57% of the portfolio, so the two ETFs appear similar in name only.
I like IJH’s growth and valuation metrics. Current constituents have grown sales at an 11.07% rate over the last five years and are estimated to be 13.52% over the next twelve months. Earnings growth is estimated at 17.59%, superior to VO’s 15.40%, and is diversified across the board. 20/25 of IJH’s top industries have double-digit estimated earnings growth, and they’re trading much cheaper than the larger mid-caps in VO. IJH’s 18.87x forward earnings valuation is 4.52 points less than VO, and although not shown above, IJH trades 2.75 points less on trailing cash flow and 1.27 points less on trailing sales. There’s no question that from a growth-at-a-reasonable-price perspective, you can benefit when diversifying by size.
VO Top 25 Industries
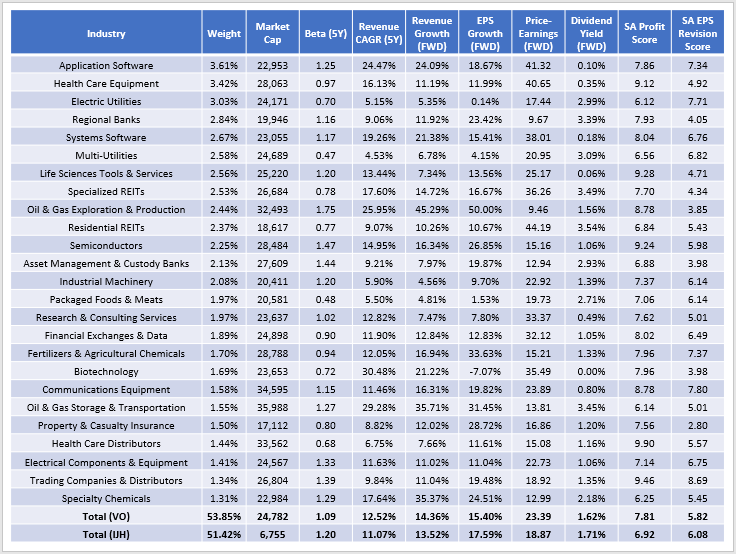
The following table highlights these same fundamentals for VO’s top 25 industries. No industry stands out by weight, but the concentration is similar to IJH: 53.85%. Conservative investors will appreciate the lower 1.09 five-year beta, but as discussed, it’s because of the overlap with the large caps. Nearly all industries have weighted-average market capitalizations above $20 billion.
The Sunday Investor
Like IJH, VO’s sales and earnings growth are solid, estimated at 14.36% and 15.40% over the next twelve months. However, it’s not as consistent. Several industries, including Electric Utilities and Multi-Utilities, have growth in the low single-digits. Utilities is one area I don’t want to diversify by size. I take a “bigger is better” approach, as I enjoy the superior profitability of the large caps. Also, this link highlights how a large-cap Utilities ETF has outperformed an equal-weight version over the last ten years with less volatility.
VO’s 23.39x forward earnings valuation is also high, which isn’t helpful in the current environment. YTD, VO is down 18.65% compared to 13.72% for IJH, and investors have targeted richly-valued companies. VO’s lower 5.82/10 EPS Revision Score supports this reaction, indicating analysts aren’t as bullish on its holdings. Still, the score is 5.23/10 for the SPDR S&P 500 ETF (SPY), so VO may be considered a bridge investment between mid- and large-cap stocks. You’ll retain reasonable quality and safety but may not participate as much in a market rebound.
Investment Recommendation
IJH and VO are two leading mid-cap blend ETFs with significantly different profiles. Style purists will appreciate IJH because, by design, there’s no overlap with the S&P 500 Index. It’s an inexpensive, efficient way to diversify by size and has excellent valuation and growth metrics. Furthermore, its higher EPS Revision score suggests stronger sentiment on Wall Street. The disadvantages are that IJH is a lower-quality, more-volatile ETF, and you can solve that by selecting VO instead. However, the valuation difference is too much, and since markets are still a bit uncertain about highly-valued stocks, IJH looks like the more thoughtful play.
Be the first to comment