

David Ramos
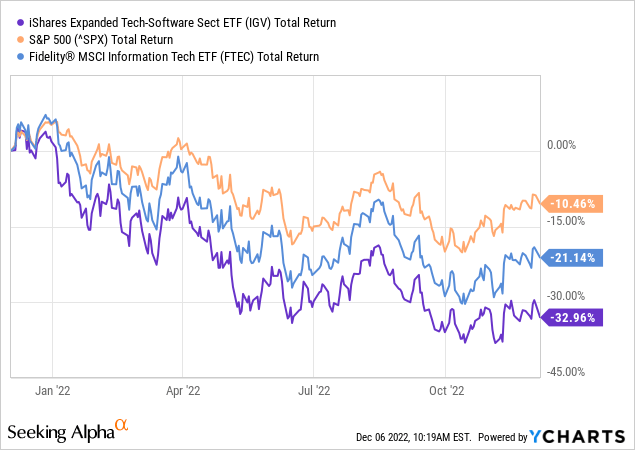
As mentioned in the bullets, the iShares Expanded Tech-Software ETF (BATS:IGV) has had a miserable year and has significantly under-performed the broad S&P 500 and even the broad technology sector as represented by the (FTEC) Fidelity MSCI IT ETF (see below). And while the software sector and the IGV ETF still trade at rich valuation levels, the pullback this year could be a good entry point for those investors under-weight in software and/or technology stocks. Today, I’ll take a close look at the IGV ETF and see if it would be a good addition to your portfolio.
Investment Thesis
As most of you know, the global pandemic – and the resulting digital transition for many companies, governments, and individual consumers – was a boon to the software sector. The move to “work from anywhere,” a transition from on-site to the cloud, and the requirement for strong cyber-security were all strong tailwinds for the sector. New business models incorporated software-as-a-service (“SaaS”) and were able to market themselves based on strong ARR (annual recurring revenue) growth. The market fell in love with the business model, and – in the era of “free-money” (near zero interest rates) – investors paid-up for discounted cash-flow years into the future.
That all came to an abrupt halt in the 2022 – at least the multiple paid on future discounted cash-flow. However, the SaaS-based business models and ARR themes are still fully intact in my opinion.
Today, I’ll take a look at the IGV ETF to see if it – after diving ~33% over the past year – now represents a compelling addition to your portfolio. Let’s start by taking a look at the portfolio.
Top-10 Holdings
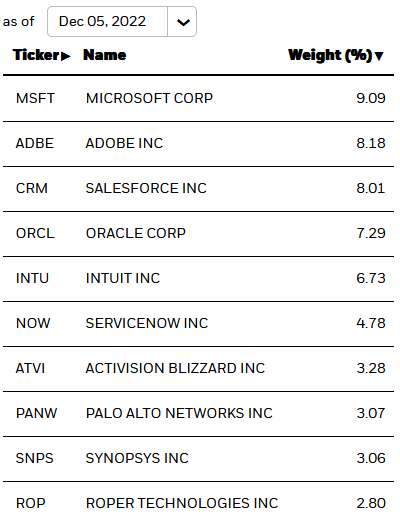
The top-10 holdings in the IGV ETF are shown below and were taken directly from the iShares IGV ETF homepage. The top-10 holdings equate to what I consider to be a relatively concentrated 56% of the entire 114 company portfolio:
iShares
Unsurprisingly, the No. 1 holding is Microsoft (MSFT) with a 9.1% weight. Microsoft stock is down 24% over the past year yet still trades at an above market multiple with a P/E=26.6x. Morgan Stanley put out a note this week touting Microsoft as being “strong and durable” with a $307 price target (at pixel time, the stock is trading at $247). And why not? After all, MSFT’s Q1 FY23 earnings report was relatively strong. Highlights included:
- Revenue of $50.1 billion was +11% yoy (up 16% in constant currency)
- Net income was $17.6 billion, -14% yoy (down 8% in constant currency)
- Diluted EPS was $2.35, -13% yoy (down 7% in constant currency)
- Intelligent Cloud revenue was $20.3 billion (+20% yoy)
Yes, revenue and earnings were down year-over-year. However, cash from operations of $23.2 billion led to continued strong free-cash-flow generation that enabled MSFT to pay-out $4.6 billion in dividends and buyback $5.6 billion in stock. The company ended Q1 with $22.9 billion in cash – or an estimated $3.06/share.
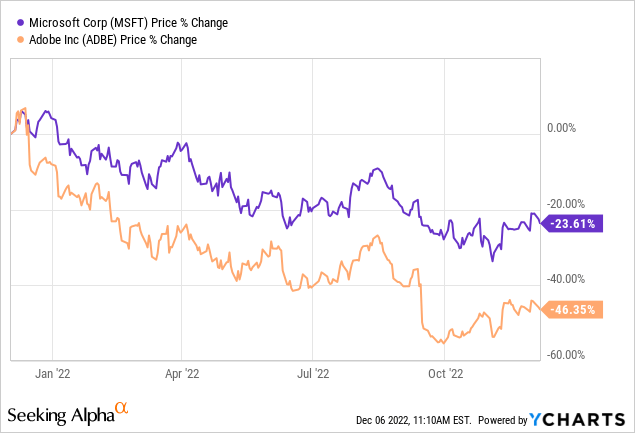
Adobe (ADBE) is the No. 2 holding with an 8.2% weight. Adobe has crashed 46% over the past year (see above), much of it do to the market’s view that the company is vastly over-paying for its planned $20 billion purchase of Figma, which has moved into the antitrust review stage by the Dept. of Justice. Adobe shares immediately plunged 17% on the announcement of the Figma deal in mid-September. Despite that headwind, note that Adobe’s Q3 EPS report was strong:
- Record revenue of $4.43 billion, +13% yoy growth (+15% in constant currency).
- Diluted earnings per share was $2.42 on a GAAP basis (down $0.10 yoy) and $3.40 on a non-GAAP basis.
Cash flows from operations were $1.70 billion – enabling the company to buyback 5.1 million shares during the quarter.
The No. 3 holding is DJIA component Salesforce.com (CRM). Salesforce has had two top executives leave within a week and the market punished the company by pushing its stock down ~6%, to a new 52-week low. Despite that, the Q3 EPS report was a strong beat on both the top and bottom lines. Q3 revenue was $7.84 billion (+14.3% yoy).
Cybersecurity expert Palo Alto Networks (PANW) is the No. 8 holding with a 3.1% weight. PANW stock has bucked the software sell-off this year and is flat over the past 12 months. The stock trades with a forward P/E = 49.8x, which reflects its quality reputation in the field and its strong demonstrated growth rate: Its Q1 report was a monster quarter and, according to Wedbush’s Dan Ives, was “a testament to the company’s ability to deliver in this accelerating cyber backdrop.”
The No. 9 holding is Synopsys (SNPS) with a 3.1% weight. Synopsys makes automated chip-design software for the semiconductor sector. The stock has held-up well this year and its Q4 EPS report was a top line beat and full-year FY22 was a record. Better still, the company’s FY23 outlook was “surprisingly strong”. FY 2023 Guidance: Revenue expected between $5.78-$5.82 billion vs. consensus of $5.65B; non-GAAP EPS of $10.28-$10.35 vs. consensus of $10.04.
Performance
As mentioned earlier, despite the 2022 bear-market mauling, the IGV ETF still has an admirable 10-year average annual return performance track-record:
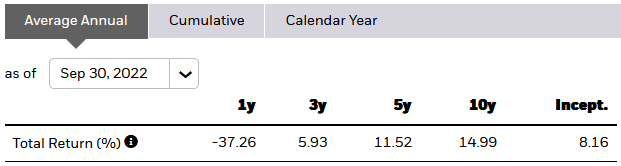
iShares
The following graphic compares the three-year total returns of the IGV ETF with some of its software oriented peers: the Fidelity Select Software & IT Services Portfolio (FSCSX), the SPDR S&P Software & Services ETF (XSW), and the Invesco Dynamic Software ETF (PSJ):
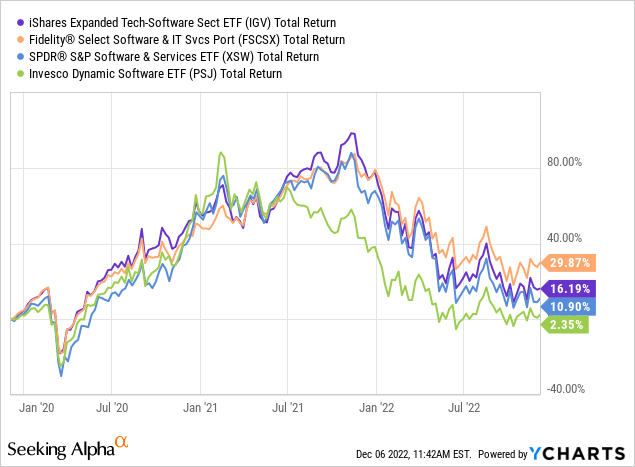
Note the Fidelity Select Software ETF has outperformed IGV by ~13.7% over the past three years despite having a significantly higher expense fee (0.67%)
Valuation
Overall, the IGV portfolio has the valuation metrics shown below (taken from the previously reference IGV homepage):
- Price-to-book: 6.3x (S&P 500 P/B = 4.0x)
- P/E Ratio: 45.4x (S&P 500 P/E = 20.6x)
- TTM Yield: nil (S&P 500 Yield = 1.65%)
As you can see, the IGV ETF – despite the big drop this year – is still quite richly valued in comparison to the broad S&P 500.
Risks
The IGV ETF is certainly not immune to the macro-environment risks. These include higher-interest rates, high inflation, and the uncertainty due to Russia’s horrific war on Ukraine that has broken the global energy and food supply chains that have dampened the global economy.
Also, as can be seen by Microsoft’s quarterly results, FX risks due to the strong U.S. dollar continue to be a headwind for those software companies that get a considerable portion of their revenue from overseas.
Lastly, based on the valuation metrics shown earlier, there is certainly more room to the downside should the software sector contract more than anticipated in 2023.
Summary And Conclusion
The IGV ETF holds some high-quality companies that continue to deliver strong free cash flow that enables them to keep buying back shares at much lower prices than they were doing one-year ago. However, the ETF’s expense fee is relatively high (0.40%) and growth is certainly slowing for the majority of these companies. Meantime, the valuation level of the portfolio is still quite rich. That said, I don’t think now is the time to give up on the software sector. For those investors that already own shares, I rate the fund a HOLD. For those wishing to establish a position in IGV, I recommend taking advantage of market volatility to scale-in over time on dips.
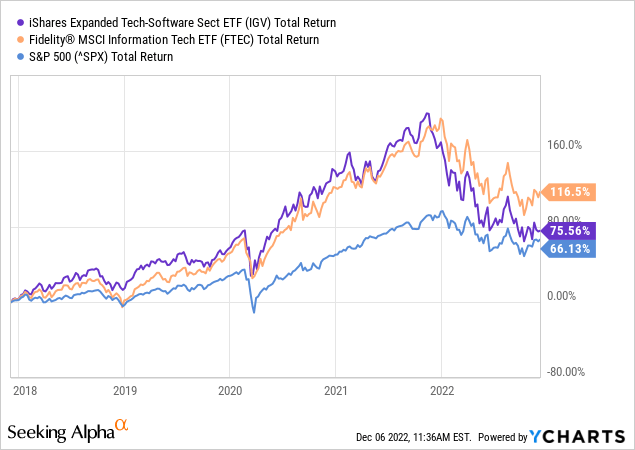
I’ll end with a five-year total returns comparison of the IGV ETF vs. FTEC and the S&P 500 and observe that FTEC ( No. 1 holding Apple (AAPL) with a 20.7% weight and No. 2 Microsoft with a 17.7% weight) is the superior option that sports a much more efficient expense fee of only 0.08%:
Be the first to comment