

cemagraphics
Written by Nick Ackerman, co-produced by Stanford Chemist. This article was originally published to members of the CEF/ETF Income Laboratory on September 18th, 2022.
Voya Global Advantage and Premium Opportunity Fund (NYSE:IGA) has been holding up relatively well compared to the broader market this year. This would have been helped by the fund’s more value-oriented portfolio. The fund’s options writing strategy could also contribute to gains. Overall, that has led to sharp underperformance over the years, but since growth is taking a breather, the opposite has been working out this year.
IGA also continues to trade at an attractively deep discount, about where it was earlier this year when we previously took a look. Since the fund has a global tilt, we should still be a bit weary of European exposure due to Russia’s invasion of Ukraine. That has only seemed to intensify since the last time we touched on the fund. With Russia being pushed back some, escalation on the Russian side to some extreme measures could occur.
The Basics
- 1-Year Z-score: -0.87
- Discount: 11.50%
- Distribution Yield: 9.30%
- Expense Ratio: 1.09%
- Leverage: N/A
- Managed Assets: $165.267 million
- Structure: Perpetual
IGA’s investment objective is “a high level of income; capital appreciation is secondary.” They intend to write “call options on indexes or ETFs, on an amount of equal to approximately 50-100% of the value of the Fund’s common stock holdings.” Typically, this is an important metric to look at. This can help gauge how bullish or bearish the fund may be leaning.
The more overwritten the portfolio, then the more that would indicate they are bearish. They would not want to be overwritten significantly if they felt the indexes could reverse and head higher. With the latest 2Q 2022 strategy brief, the fund showed that 50.18% of the fund was overwritten.
Being on the lower end of their target would suggest that they are leaving more open to take advantage of a rebound. While we’ve sold off, it can make sense to be less aggressive with being overwritten. However, this was a similar level to where they were in March too. So it seems they aren’t being too tactical with this strategy.
With no leverage, that has also helped the fund in a couple of ways through 2022. The most obvious would be that downside wasn’t amplified, as we’ve seen in other funds. Additionally, though, with interest rates rising, other leveraged funds also have to contend with rising leverage expenses. That isn’t the case for IGA; it also generally equates to a rather low expense ratio. At 1.09%, we are certainly higher than what we see in ETFs, but for an options CEF, this is fairly standard.
On the other hand, the fund is quite small. That means the trading volume tends to be rather low too. That can cause issues for a larger investor trying to enter or exit a position all at once.
Performance – A Relatively Better 2022
With the superpower of hindsight, IGA was well set up to enter 2022. Of course, investing entirely in energy or utilities would have worked out even better. IGA hasn’t provided positive results but has outperformed the broader market meaningfully, as measured by the SPDR S&P 500 (SPY).
I’ve also included Eaton Vance Tax-Managed Buy-Write Opportunities Fund (ETV). That is one of the most popular index writing funds, but it is more growth-oriented. ETV is also a U.S.-based investment, so I’ve also included the Eaton Vance Tax-Managed Global Buy-Write Opportunities Fund (ETW). ETW also has a global tilt similar to IGA.
We can see that IGA, on a total NAV return, has smoked these three funds. On a total return basis, we see that ETV has still leaped ahead of IGA, but that was purely from premium expansion alone.
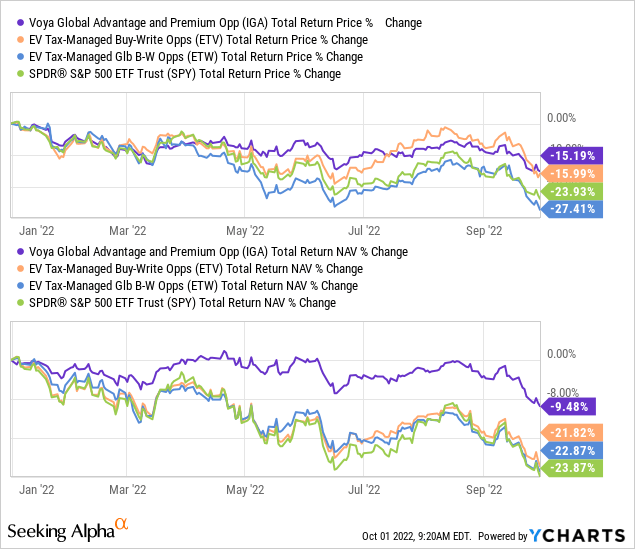
SPY and ETV aren’t necessarily appropriate benchmarks, but they do provide us with some context on how IGA is performing. Both SPY and ETV are going to be focused on U.S.-based investments. ETW is a closer peer but still isn’t exactly either because it targets a higher allocation to growth. So it really helps show how growth has been a big drag for 2022.
The value-oriented portfolio has been helping IGA out considerably. That’s a stark contrast to where the fund was performing. Historically speaking, in most of the last decade, growth/tech has outperformed value. Therefore, we see that IGA had lagged significantly over the longer term. Interestingly though, the fund has outperformed ETW over the longer term. However, this was a more recent development, with 2022 mostly contributing to this divergence.
YCharts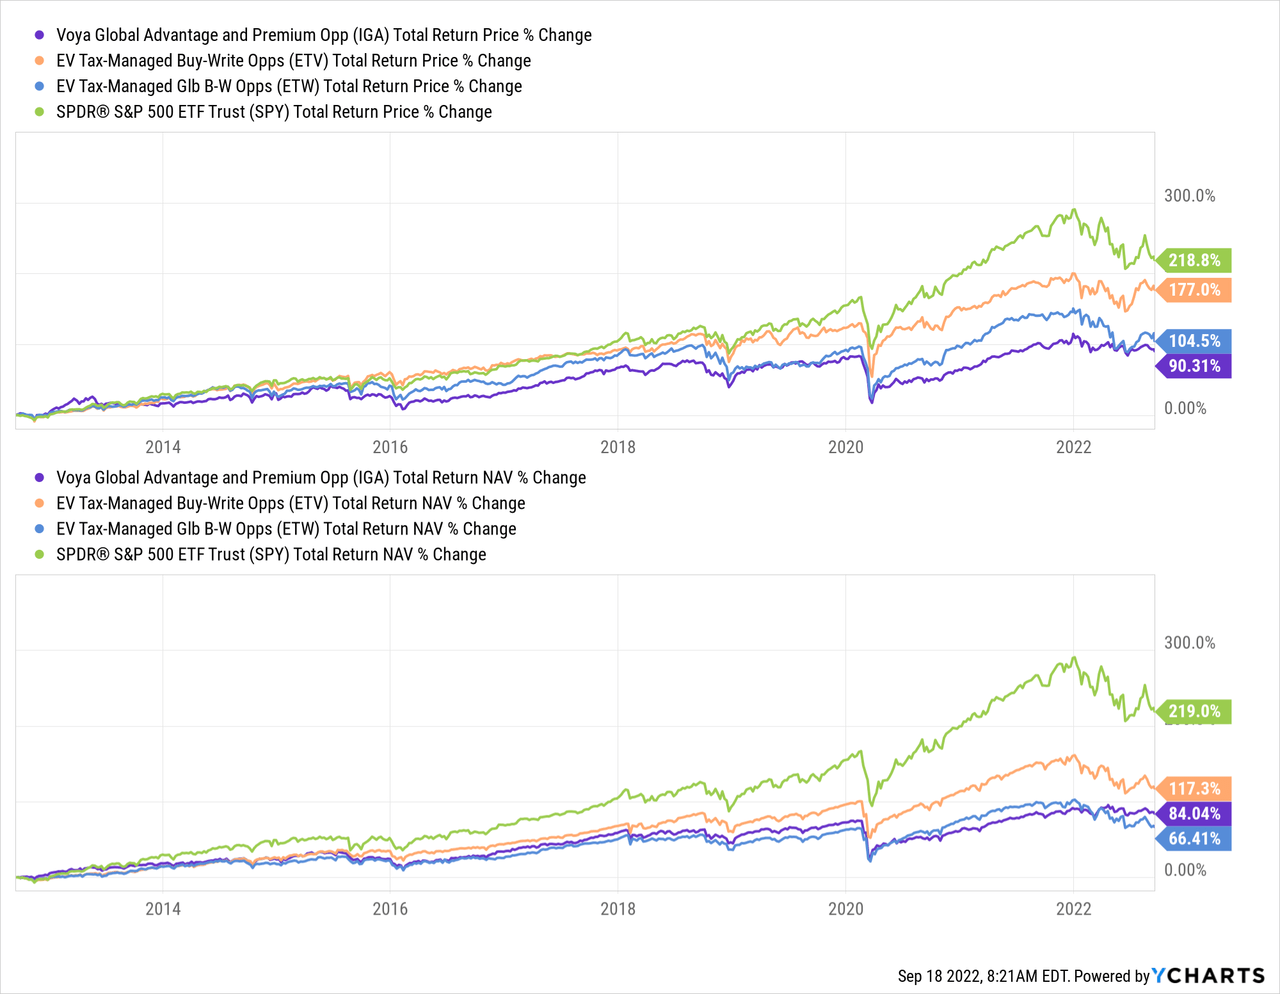
Despite the fund trading at a deep discount, the 1-year z-score is catching up. For that, I mean that the z-score had been -2.18 the last time we looked at the fund. This had contracted down to -0.87 when the discount went from only 11.76% to the latest 11.50%. Since we’ve been trading at this deep discount for some time now, this is starting to become a normal trading range. That would be at least in the 1-year period.
Going back a bit further, we can see that this is still near the bottom end of the decade-long average. That doesn’t mean it can’t continue to trade at this level (or even go deeper), but it is why I’m comfortable with adding to this fund at these levels.
YCharts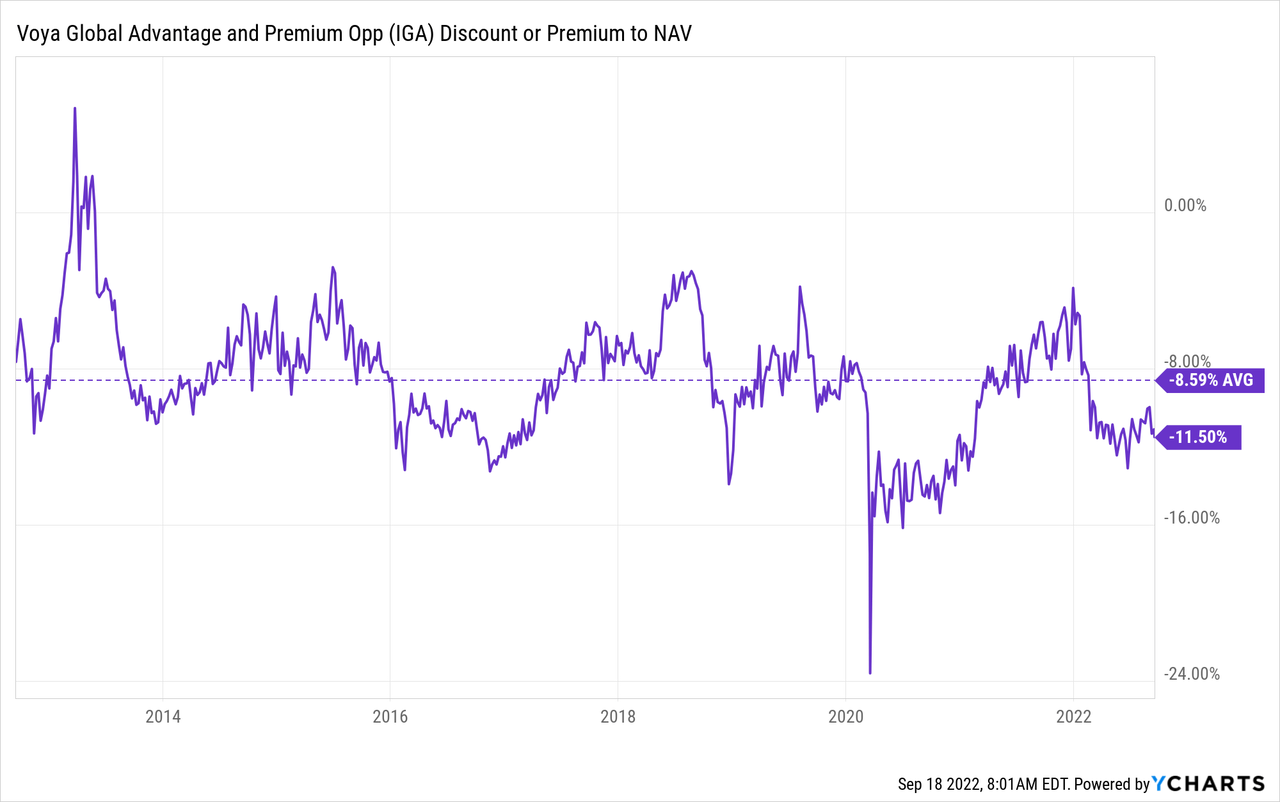
Distribution – Attractive 9.30% Rate
IGA’s distribution history shows a similar trend as ETW. This makes sense as both of these funds have a tilt towards global positions. Global positions are another area that had underperformed massively compared to a U.S.-based focused investment.
IGA Distribution History (CEFConnect)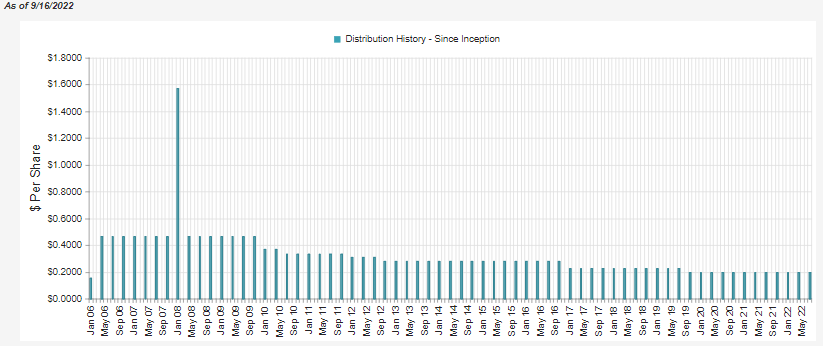
Now, since the fund has been holding up relatively better, it should be less likely to cut. At an 8.22% NAV distribution rate, I think we are at a reasonable level. Thanks to the deep discount, the actual distribution yield investors collect is 9.30%.
This is the opposite of ETV, where investors collect 9.09%, but the fund has to earn 10.42% now. I think ETV is at risk of a distribution cut.
At this point, we have a fairly dated annual report from IGA to look back on for what the fund was earning. We should get a semi-annual report sometime in November, which is light years away in this volatile market. For that reason, we are flying a bit blind.
What we do know is that the fund generates some net investment income. That can help keep a distribution more stable as it tends to be more predictable. 23.2% NII coverage isn’t too bad for an equity fund. We also know that the fund had realized enough gains in the prior fiscal year to cover the payout easily.
IGA Annual Report (Voya)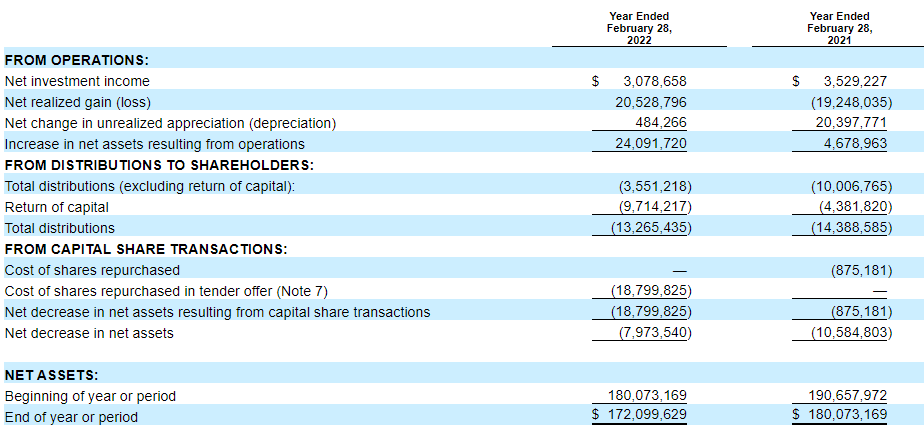
Where we could see more gains come through is the options strategy. Since they write index options, these are presumably expiring worthless as the market goes lower. That means they get to pocket the premium and, thus, realize a capital gain. However, in the prior fiscal year, it had still generated a loss of around $3.476 million.
I believe this is the case because it was for the twelve months that ended on February 28th, 2022. Meaning most of the reporting period was still in a time of relative calm in the market. The losses were only beginning to accelerate later in the reporting period. Therefore, I suspect the next semi-annual report should show a positive contribution from written options.
IGA Realized/Unrealized Losses/Gains (Voya)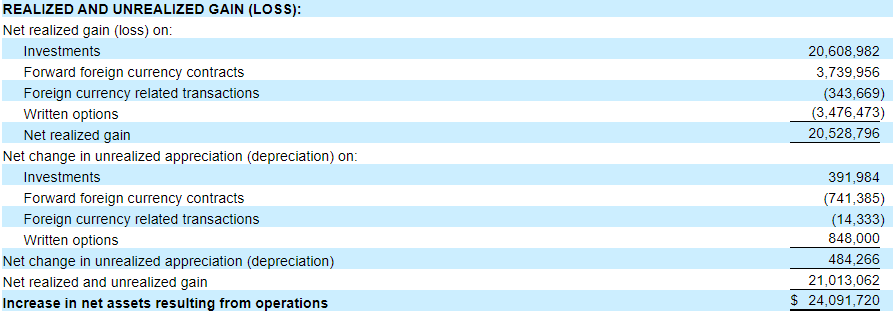
With all this being said, I believe that the fund’s distribution shouldn’t be cut at this time; it should remain stable.
The fund has reported the distribution classifications as ordinary income, long-term capital gains, and/or return of capital in various amounts over the last two fiscal years.
IGA Tax Character (Voya)
For tax purposes, that can be welcomed as long-term capital gains are tax-friendlier. ROC is a way to defer tax obligations. Of course, you don’t want destructive ROC for too long, which would have been the case in 2020. 2021 showed more ROC, but that appears to have been simply carryforward losses from 2020.
IGA’s Portfolio
They are fairly active with their portfolio. In the last fiscal year, they reported a turnover of 66%. However, this had been as high as 130% in 2020. That means when we look at what they have listed for the portfolio now, there is a good chance some of this has shifted already. CEFs are generally opaque as they aren’t required to report daily or even monthly holdings. IGA is a fund that updates its holdings monthly for investors. So it can give us a better idea of what we are holding.
At this time, they hold 241 positions, with 67% of the positions being weighted in U.S. holdings. We have some European exposure, which should be considered with the events there. Germany is the most at risk due to their dependence on Russian gas.
IGA Country Weighting (Voya)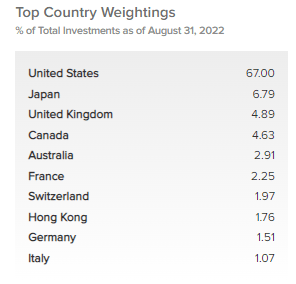
When looking at the sector weightings, we see that the top exposures are all to value-oriented sectors. We have financials, healthcare, industrials, consumer staples, energy, and utilities. Financials should be performing better this year, but the market is looking more toward what economic havoc can be done rather than the benefit of higher interest rates. Higher interest rates contribute to higher net interest income for banks.
Healthcare is naturally defensive no matter the economic environment; people will typically continue to spend on healthcare. Industrials and energy can be cyclical sectors, but energy has benefited massively from the price of crude oil. We also have utilities, another natural defensive sector. With energy and utilities as the only positive sectors for the year, it is no wonder why IGA has been holding up a bit better.
IGA Sector Weighting (Voya)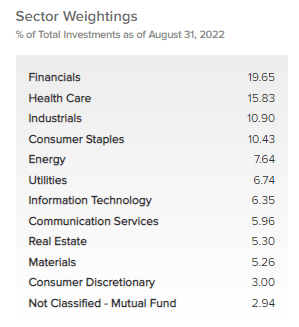
This weighting is fairly similar to the last time we looked at their portfolio at the end of February 28th, 2022. Perhaps not too much of a surprise, given the top ten holdings are also showing up once again.
IGA Top Ten (Voya)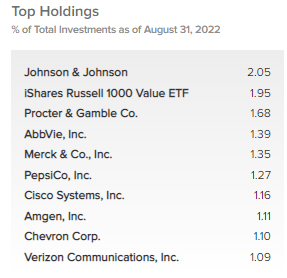
iShares Russell 1000 Value ETF (IWD) is now the second largest position in the fund. It had previously been the fifth largest position. Johnson & Johnson (JNJ) has retained its top spot in the fund. The weighting had even increased a touch from 1.95% previously.
Procter & Gamble (PG), AbbVie (ABBV), Merck & Co (MRK), Cisco Systems (CSCO), and Verizon (VZ) all also make another appearance. New names include PepsiCo (PEP), Amgen (AMGN), and Chevron (CVX). Looking back at the annual report, we can see that these three were all previous positions.
Market gyrations would have contributed to the change in allocations. Although some additions to CVX certainly helped as they held 1499 shares and bumped that up to 11,303 at the end of May 31st, 2022. AMGN had 7483, and that was a small increase from the 7400. PEP went from 9872 to 12,001 shares being held.
Conclusion
The value-oriented tilt of IGA has meant the fund has outperformed the broader markets and growth-oriented peers. That is a divergence from the chronic underperformance the fund had produced previously as growth and U.S. investments outperformed easily. It is a good reminder of why diversification can help an investor navigate through all investing periods. The distribution would appear secure at this time, and the deep discount is attractive for this fund. I believe that makes it a worthwhile candidate for adding to one’s portfolio.
Be the first to comment