

vasantytf
Gold has been hit hard lately by rising real yields. It was sort of the 2022 theme that was temporarily cast aside last quarter and to kick-start 2023, as rates fell amid easing inflationary pressures.
Now, though, a hot U.S. labor market likely means the Fed will keep its foot on the economic brake pedal through the next few FOMC meetings. The Fed’s Terminal Rate is now seen above 5.1% – about a quarter point jump from just a week ago before the Fed meeting and the gangbusters January jobs jolt – which was more than double economists’ expectations for total employment gains.
Fed Funds Futures Pricing In Higher Yields
The Daily Shot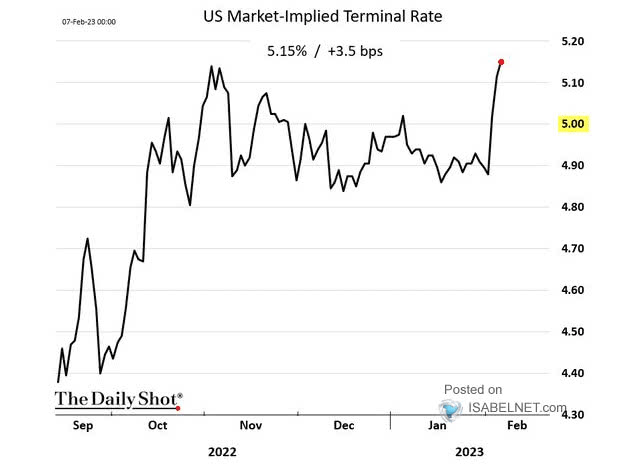
Also, negatively impacting the spot price of the yellow metal is a rebounding U.S. dollar. Notice in the chart below that the greenback has bounced off key support around the 101 level – that’s where it troughed during the middle of last year. A further increase in the USD would no doubt be a headwind for gold so long as the move was not driven by geopolitical fears.
A rise in Russia/Ukraine tensions or uncertainty about what China might do with respect to Taiwan, or even the U.S., could spark rallies in both the DXY and gold. But I expect a negative correlation between gold and the dollar this year, so paying close attention to valuation changes in the USD is important.
US Dollar: 101 Key Support, Bouncing Here
StockCharts.com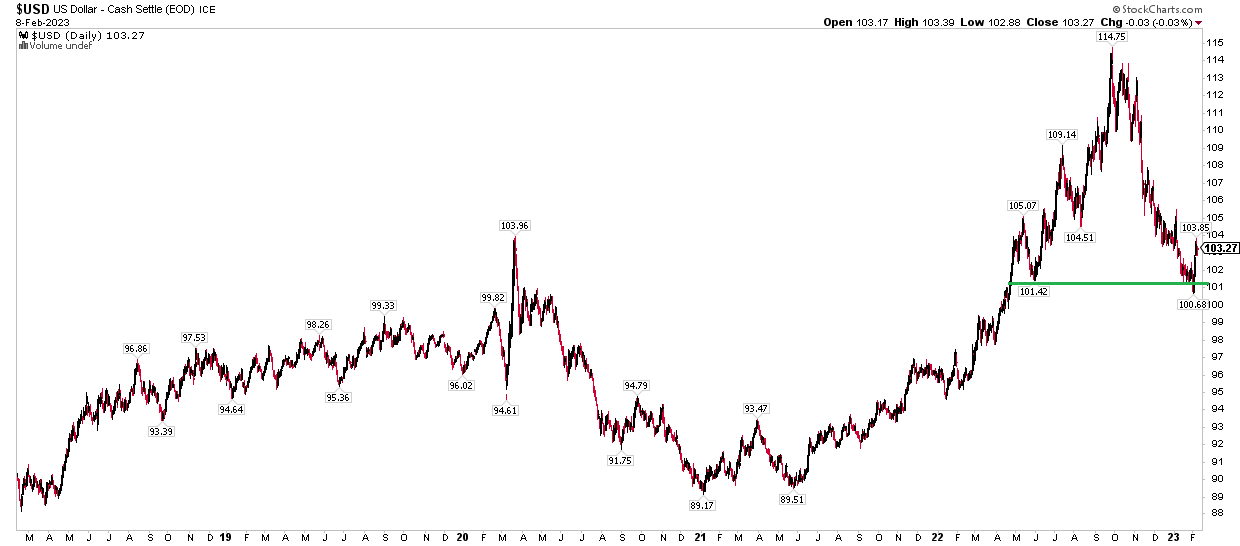
A way to play movements in gold is through two solid ETFs: the SPDR Gold Shares Fund (GLD) and the iShares Gold Trust (NYSEARCA:IAU). IAU tracks the spot price of gold very well and is liquid, with just a 0.03% 30-day median bid/ask spread. It costs 0.25% annually through a sponsor fee and can help diversify a portfolio along with protecting it from inflation risk, per iShares.
Let’s dig into the charts on gold. Of course, gold has no fundamental value since it does not produce cash flows, so I prefer to strictly look at what price action is telling us. First, big picture, I see upside potential due to a long-term bearish to bullish rounded bottom pattern. Gold peeked above its 2011 high on a pair of occasions in the last three years, but we have not seen a definitive breakout… yet. I think it is just a matter of time before a major breakout happens. But let’s home in on the near-term view.
IAU Long-Term: Bearish to Bullish Reversal, New Highs In Play
StockCharts.com
So this is a bit more bearish. Notice in the 3-year zoom below that there was a bearish gap lower in IAU, which coincided with a break in the RSI momentum trend after the Fed meeting and jobs report earlier this month. More downside is likely, but I see significant volume by price in the $34 to $35 range, so that should cushion some selling in my technical eye. Longer-term support is near $32.
What is bullish here, though, is that the ETF had every reason to sell off once it broke under its March 2021 low late last year – but it did not. So, buying strength appears decent. Of course, we need to see IAU rise above the $40 level to help confirm new all-time highs. Keep this one on your radar in 2023.
IAU: Bearish Momentum Break, Eyeing A Support Zone
StockCharts.com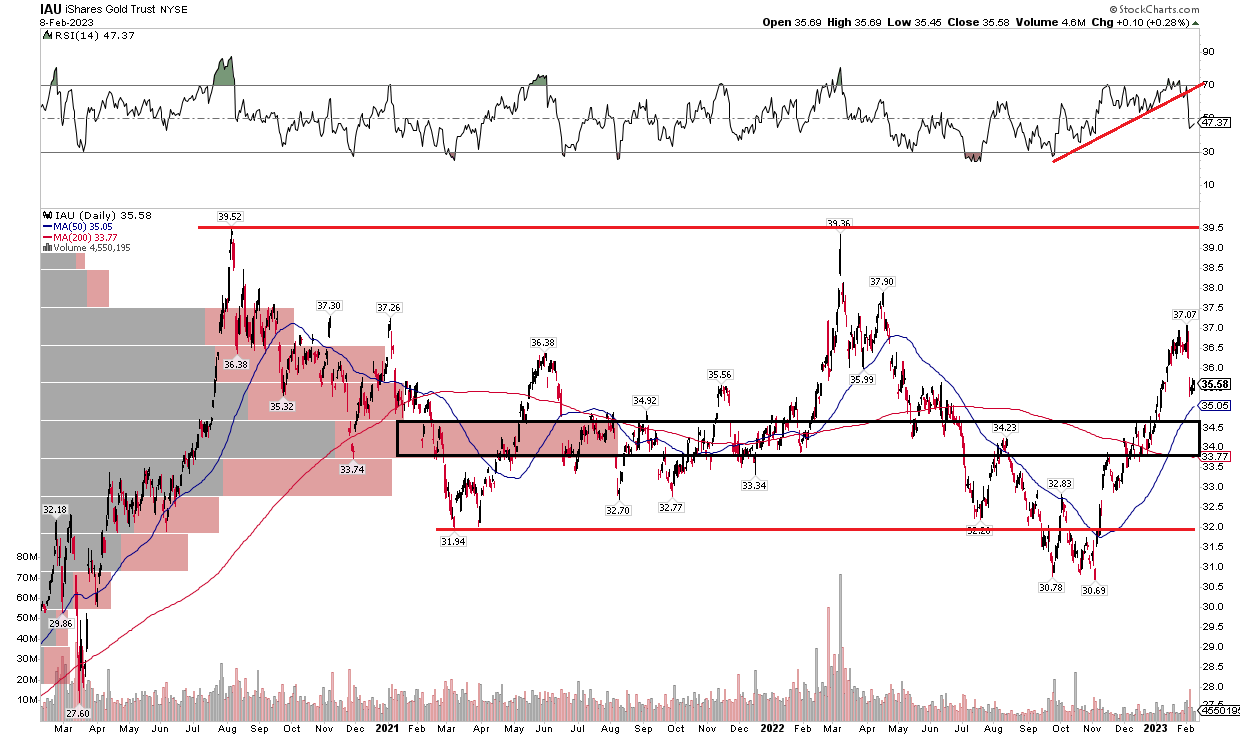
The Bottom Line
Gold looks good long term, but there’s technical work needed in the short run to get a solid 2023 rally going. With real yields creeping back up and the dollar bouncing, there are near-term headwinds.
Be the first to comment