

ismagilov/iStock via Getty Images
Written by Nick Ackerman, co-produced by Stanford Chemist. This article was originally published to members of the CEF/ETF Income Laboratory on April 18th, 2022.
The high yield bond space hasn’t been performing spectacularly this year. However, they have been holding up relatively better than their investment-grade rated corporate bond peers. Of course, this all comes down to interest rates and how they have impacted these fixed-income categories differently. Below is the YTD comparison between iShares iBoxx $ Investment Grade Corporate Bond ETF (LQD) and iShares iBoxx $ High Yield Corporate Bond ETF (HYG).
YCharts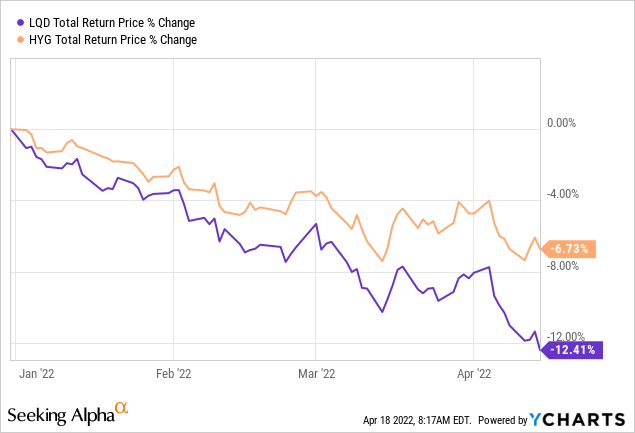
One of the primary reasons for high yield or junk-rated debt to perform better when interest rates rise is their generally shorter maturities. The average maturity for HYG is 5.44 years. The weighted average maturity for LQD comes to 13.44 years. This then translates into higher effective durations for the portfolios. LQD comes in at 8.93 years, and HYG comes to 4.16 years. The higher the duration, the more the underlying bond prices are expected to move based on interest rate changes.
On the other hand, high-yield bonds are going to be riskier. That’s why they typically have shorter maturities in the first place. Investors want to see their money returned to them much more quickly. Knowing that the longer their money is out, the great the chance for a black swan event to happen, which would ultimately cause financial stress on the issuing companies. Those that are most sensitive to economic conditions are those that are high yield.
That’s the basics for high yield and its biggest risk factor. With that being said, I believe there are two closed-end funds that are worth a look in the high yield space. Both of these funds I have covered previously, but they have come up as particularly attractive at this time. These are Western Asset High Yield Defined Opportunity Fund (NYSE:HYI) and New America High Income Fund (NYSE:HYB).
Of course, if you think a recession is right around the corner, then one would want to wait until then to put any new capital to work. For me, I don’t try to time the market but just let the valuation guide my investment decisions. Therefore, when I see some deep discounts on funds I already know I want to hold, I see that as an opportunity.
Western Asset High Yield Defined Opportunity Fund
- 1-Year Z-score: -1.53
- Discount: -5.07%
- Distribution Yield: 8.42%
- Expense Ratio: 0.93%
- Leverage: N/A
- Managed Assets: $325.77 million
- Structure: Term (anticipated liquidation date of September 25th, 2025)
HYI was a fund previously in my portfolio, but I had the opportunity to cut the position as the fund moved to a sharp premium. Since then, the fund has declined sufficiently to make it an attractive investment once again. Stanford Chemist sent out a trade alert in February, noting that it would be once again added back into the Income Generator Portfolio.
HYI has an investment objective of “high income, with capital appreciation as a secondary objective.” They “emphasize team management and extensive credit research expertise to identify attractively priced securities.”
They are free to invest across various types of fixed-income securities. They primarily focus on high yield corporate debt, “…under normal market conditions, at least 80% of its net assets in a portfolio of high-yield corporate fixed income securities…”
Two of the features that set HYI apart from HYB are the term structure and non-leverage. The term structure means that HYI is anticipated to liquidate around September 30th, 2025. That means that investors will get the opportunity to realize the discount at some point. That doesn’t guarantee a profit since the fund’s NAV could slide from here and still generate a loss. Then one could simply just buy a different high yield fund if you expected high yield to still be an attractive place to invest.
However, that’s a part of what makes HYI particularly attractive at this time, with its around 5% discount. That should provide some downside protection, even if the fund ultimately declines further if the high yield sector performs poorly over the next several years.
On top of this, the no leverage in the fund means that it should be relatively more conservative too. Keeping in mind, at the end of the day, this is still a high yield bond fund and that creates risks on its own.
HYI also provides a fairly small sleeve of emerging market debt. This could create further diversification for an investor’s portfolio. They list some exposure to investment-grade bond funds but isn’t too meaningful of an allocation.
HYI Asset Allocation (Franklin Templeton)
In terms of the distributions, they have been declining over the years for the most part. They have been maintaining the same rate for several years now, though.
HYI Distribution History (CEFConnect)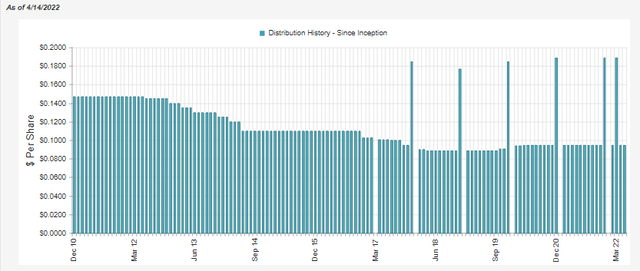
I don’t view this as a negative as it is a consequence of the high yield space. Below is the dividend history for HYG. Since it is an ETF, they generally pay out varying dividends based on the interest they have received in the period. As we can see, the trend has been moving mostly lower, right in line with what we see for HYI for the most part. Except for the last year or so, where HYI continued to pay out a level distribution, HYG’s was lowered quite materially.
YCharts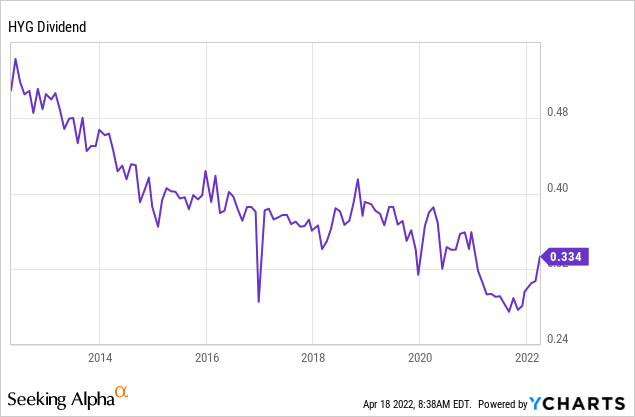
One of the reasons for this is because CEFs usually payout “managed distributions.” These can be based on an actual percentage of the NAV or just a set amount the Board decides it wants to pay until it is changed. On the other hand, that doesn’t mean that the payout is being supported either.
If we look at HYI’s last Semi-Annual Report for the period ended November 30th, 2021, we would see a shortfall. We typically look at net investment income for bond CEFs; this is important. It is the interest/dividends received minus the expenses of the fund. NII for HYI came in at $10.968 million, but distributions paid out came to $12.844 million. That resulted in a shortfall in coverage. That could indicate a trim would still be needed at some point. For now, though, they seem comfortable paying the same monthly rate.
New America High Income Fund
- 1-Year Z-score: -1.77
- Discount: -10.63% (based on 4/8 NAV)
- Distribution Yield: 7.71%
- Expense Ratio: 1.14%
- Leverage: 28.79%
- Managed Assets: $291.8 million
- Structure: Perpetual
HYB’s premium and discount followed a similar trajectory that HYI did. It was at a discount, then jumped to a premium, and then fell sharply lower. For HYB, it was an even larger move relatively when it jumped to a premium from the discount it had been trading at. Since then, the fund’s discount has widened further. Though, for HYB, the discount can be a bit harder to calculate since they don’t update their NAV daily. Instead, they update it weekly. That’s why we can see different figures depending on the data provider being used.
YCharts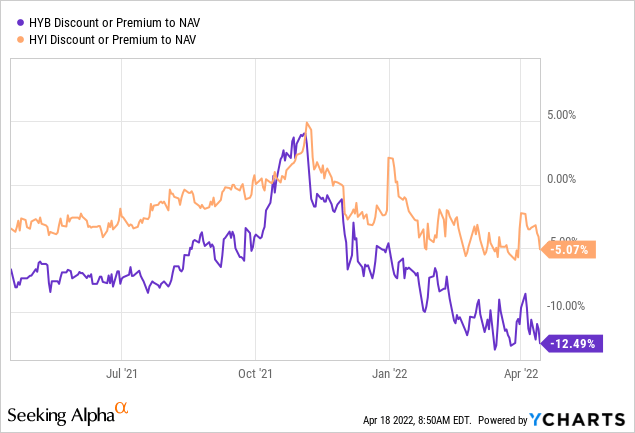
The fund’s investment objective is “to provide high current income while seeking to preserve stockholders’ capital.” They do this through investing in “a portfolio of “high yield” fixed-income securities, commonly known as “junk bonds.” The Fund invests primarily in “high yield” fixed-income securities rated in the lower categories by established rating agencies, consisting principally of fixed income securities rated “BB” or lower by Standard & Poor’s Corporation (“S&P”) or “Ba” or lower by Moody’s Investors Service, Inc. (“Moody’s”), and subject to applicable bank credit facility requirements, non-rated securities deemed by the Investment Adviser to be of comparable quality.”
HYB is a bit more of your traditional CEF that is perpetual and leveraged. That means we have to consider that there is not going to be any way to realize this discount besides investors bidding the price back up. On top of this, it could be more volatile and risky given the leverage they use.
With the leverage, the expense ratio also would increase to 1.50%. The 1.14% listed above is the expense ratio for the fund’s operation. When utilizing leverage, the fund will have interest payments it needs to make on its borrowings. For HYB, this is “an adjustable rate based on a margin above LIBOR.” That came out to around 0.95% in the latest report. That’s a figure that is set to rise going forward as interest rates and LIBOR increase.
That could be why we see the performance of HYB coming in below HYI. The leverage is adding to the downside risk on a total NAV return basis. However, on a total share price basis, they are falling even further, potentially based on more headwinds.
YCharts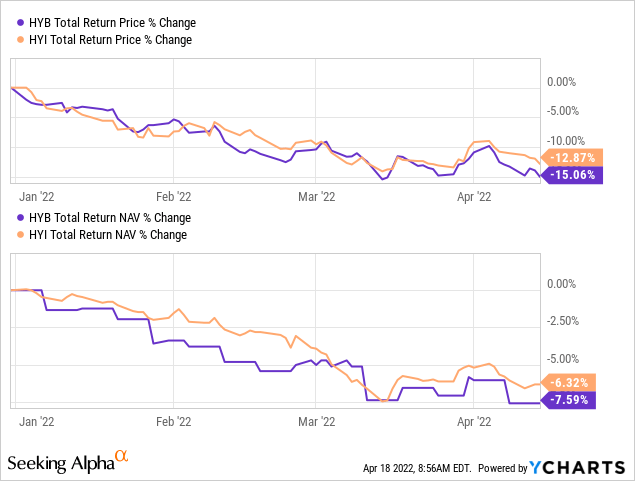
As a long-term investor, I see this as more of an opportunity, but I also don’t expect the fund to turn around next month or anything. We could see pressure on HYB and HYI for the next year or two as rates are being raised.
For the distribution history, we once again see a similar trajectory. It has been lower over the years. In this case, we can go all the way back to around 1992 since this fund is significantly older.
HYB Distribution History (CEFConnect)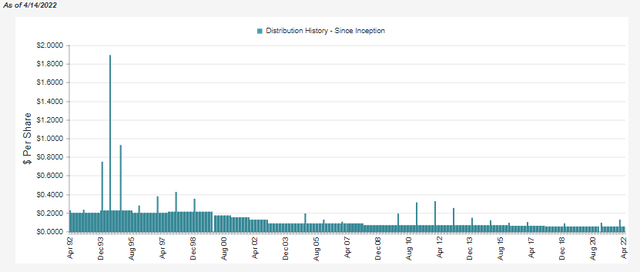
The coverage here from NII was once again somewhat light in their fiscal 2021. That being said, it wasn’t too light, and with realized gains, they had actually paid a year-end special. NII came to around $14.963 million and total distributions to shareholders came to $15.834. Realized gains for the year were $5.746 million.
Over the longer term, one might be curious to see how these two funds have performed relative to each other. Below is the last ten-year performance on a total share price and total NAV return basis. We can see that HYB has come out in the lead by a fairly substantial margin. However, once again, I would highlight that HYB is leveraged. This is basically what we should see over the longer term. It makes it a riskier fund, though.
YCharts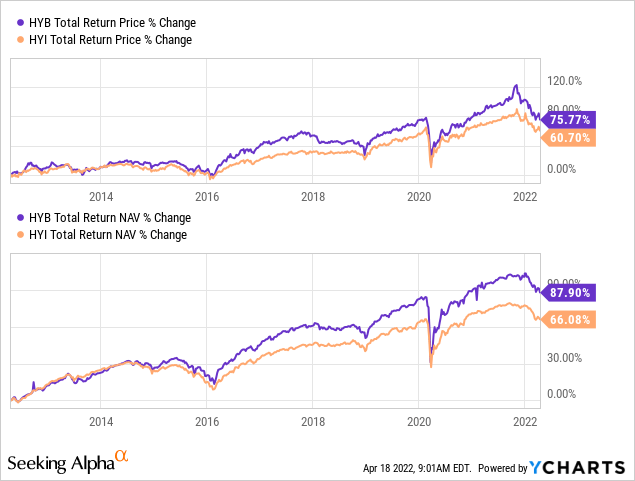
Just to highlight the greater risks, we can take a look at the March 2020 sell-off. Below is the performance from February 19th, 2020 to March 23rd, 2020. HYB updating its NAV only weekly makes for a fairly strange-looking chart. However, it gives us a general idea. HYI had held up better in terms of total NAV return. Fortunately, this was only a brief sell-off that recovered quickly. Not every sell-off works in the same intensity and equally intense recovery that we had seen during that period.
YCharts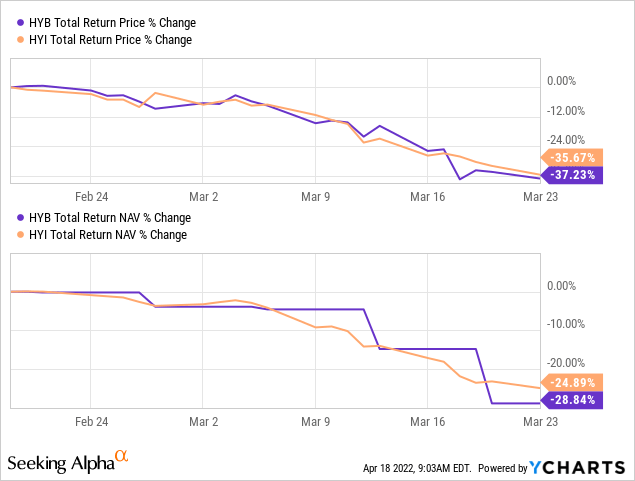
Conclusion
High-yield bond funds have their risks. That being said, these are two funds that represent attractive valuations for long-term investors. Both of these funds might be high yield bond funds, but they are still quite different due to the different structures of term and perpetual. Additionally, HYI doesn’t utilize leverage and HYB is leveraged. Both funds had avoided cutting their distributions over the last year, despite the overall high yield space showing a decline in what HYG could pay in dividends.
Be the first to comment