


xavierarnau
Humpty Dumpty sat on a wall, Humpty Dumpty had a great fall. All the king’s horses and all the king’s men Couldn’t put Humpty together again.
Watching with great interest the convolutions of the UK Pension Fund market following the “VaR earthquake” coming from the sell-off in long dated UK Gilts, when it came to choosing our title analogy we reminded ourselves of our May 2016 post “Through the Looking Glass” where we mentioned the character “Humpty Dumpty” and his discussion with Alice in Lewis Carroll’s Through the Looking-Glass (1872). “Humpty Dumpty” is a character in an English nursery rhyme, probably originally a riddle and one of the best known in the English-speaking world. He is typically portrayed as an anthropomorphic egg, though he is not explicitly described as such. “Humpty Dumpty” was also eighteenth-century reduplicative slang for a short and clumsy person. As well James Joyce used the story of Humpty Dumpty as a recurring motif of the Fall of Man in the 1939 novel Finnegans Wake (The fall of man, the fall of Adam, or simply the Fall, is a term used in Christianity to describe the transition of the first man and woman from a state of innocent obedience to God to a state of guilty disobedience). But, more importantly in science “Humpty Dumpty” has been used to demonstrate the second law of thermodynamics. The law describes a process known as entropy, a measure of the number of specific ways in which a system may be arranged, often taken to be a measure of “disorder”. The higher the entropy, the higher the disorder. After his fall and subsequent shattering (UK Pension Fund system), the inability to put “Humpty Dumpty” together again is representative of this principle, as it would be highly unlikely (though not impossible) to return him to his earlier state of lower entropy, as the entropy of an isolated system never decreases but we ramble again…
In continuation to our previous conversation, we are increasingly concerned by widening of credit spreads on the back of increasing bond volatility. Many financial pundits focus way too much on the VIX index we think. The MOVE index matters much more in our humble opinion.
In this conversation, we would like to continue to look at the deterioration of Credit Markets through the CDS prism as well as reminding ourselves from our musings relating to power laws and rogue waves from the United Kingdom wild gyrations which triggered an important response from the Bank of England to avoid the crash of “Humpty Dumpty” aka its entire pension system
- Through the Looking-Glass of the CDS Markets
While overall global CDS 5 years YTD indices have rallied a bit recently on the “hope” of a Fed “pivot”, we do think it is way too early to expect the Fed to change its hiking narrative:

CDS Global (Datagrapple.com)
In our last conversation we indicated that we thought European High Yield CDS should be much more wide than US. We have seen a widening in CDS indices since our last conversation (from 421 bps to 446 for US High Yield vs 340 bps to 356 bps in European names). We still expect an acceleration in the widening in European credit vs US.
CDS wise while stress was already showing up in 5- year CDS European High Yield Consumer and Cyclical names, October has seen a much better tone:
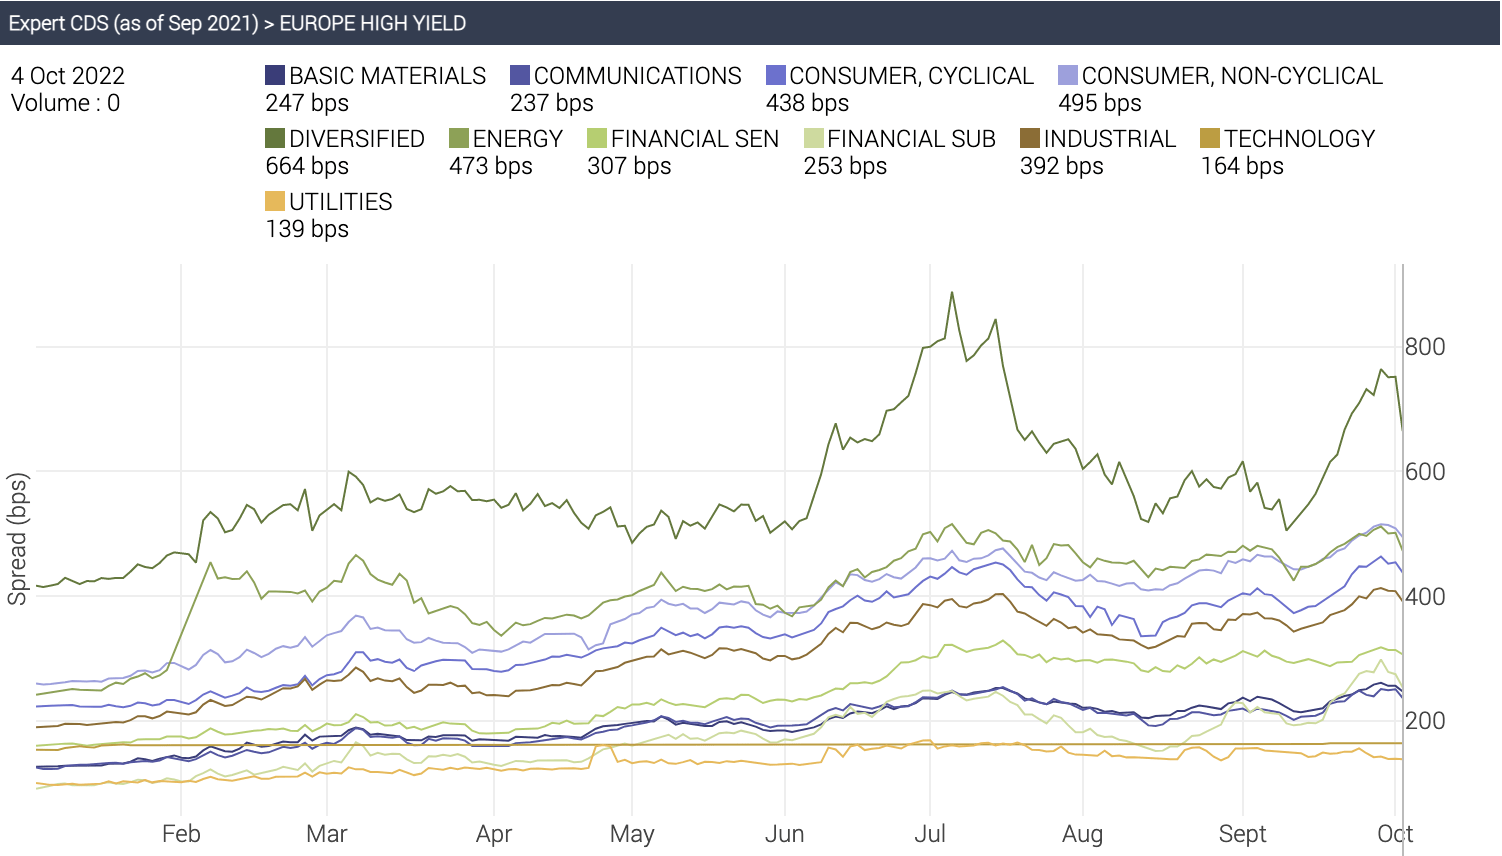
CDS Europe HY (Datagrapple.com)
Could we see a bear market rally in the making? This depends entirely on bond volatility we think as per below YTD MOVE index:
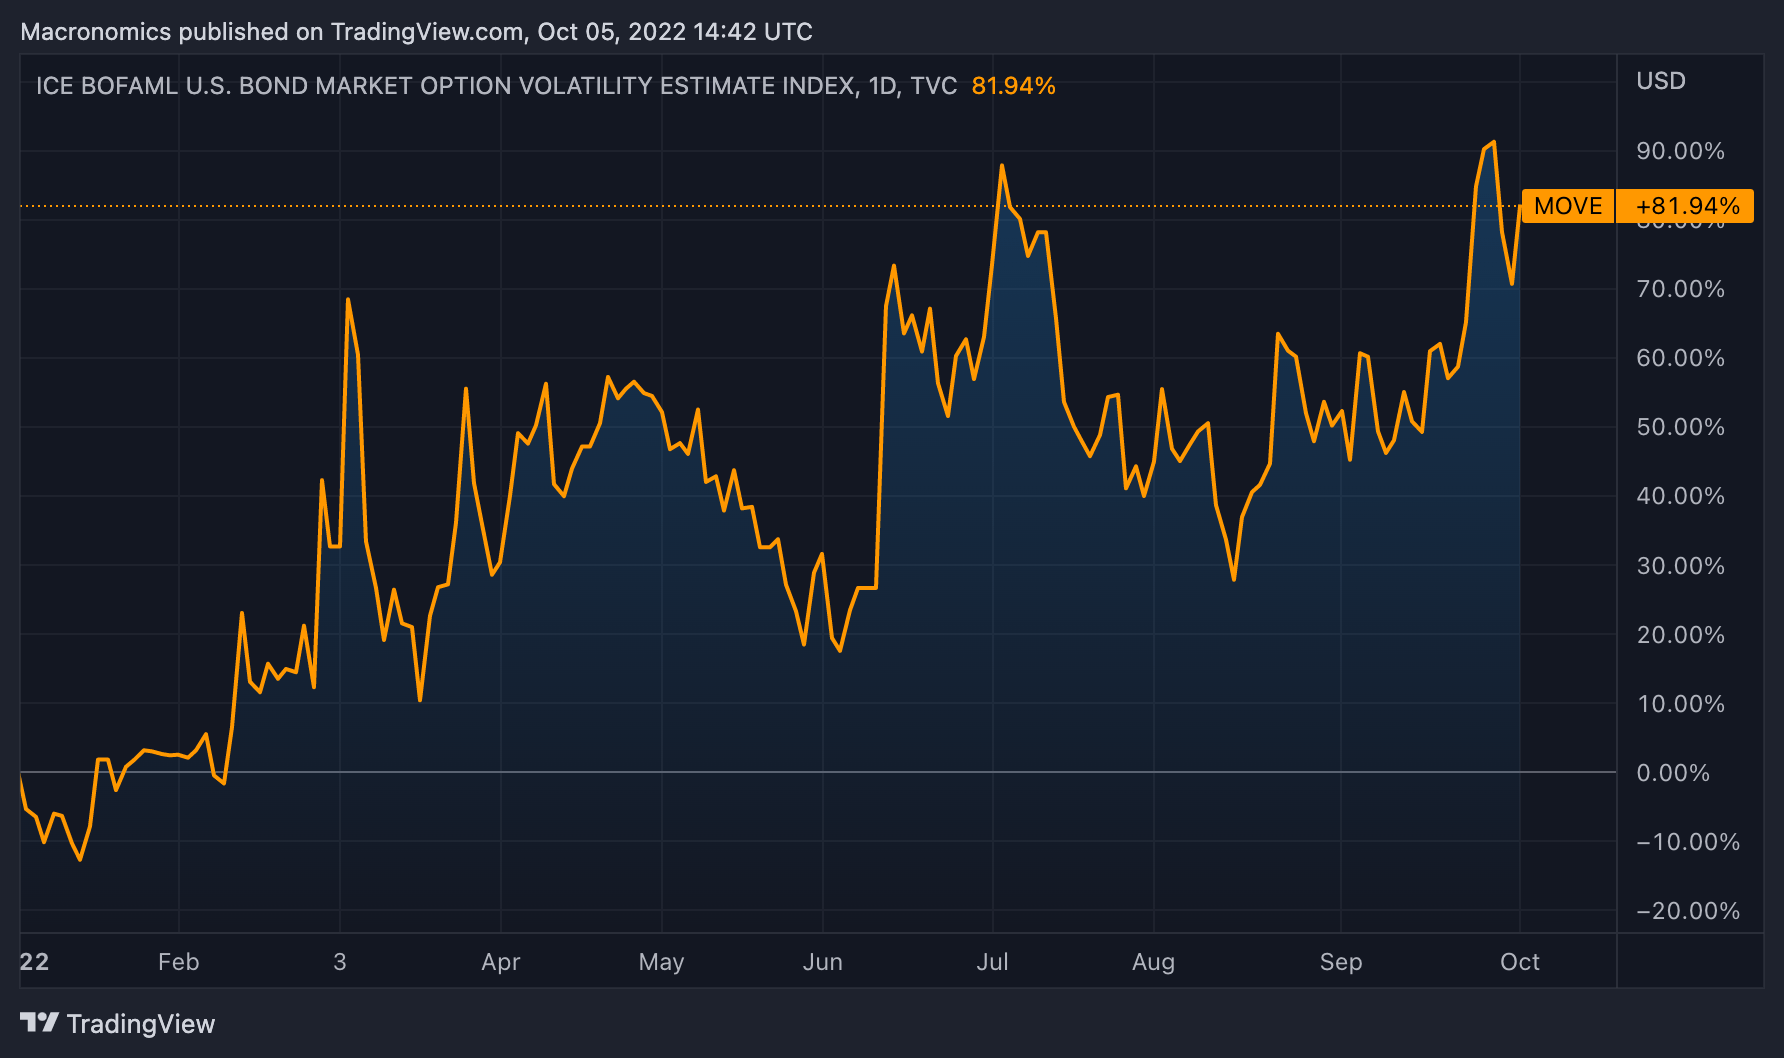
MOVE INDEX YTD (TradingViews)
As long as bond volatility is rising, we have difficulties in buying the “rally narrative”.
The iTraxx CDS Europe index benchmark comprises 125 equally-weighted European names. Some pundits point out that since 2015 any reading near 130 marks on this CDS index has marked a bottom in world indices. Could it be different this time around?
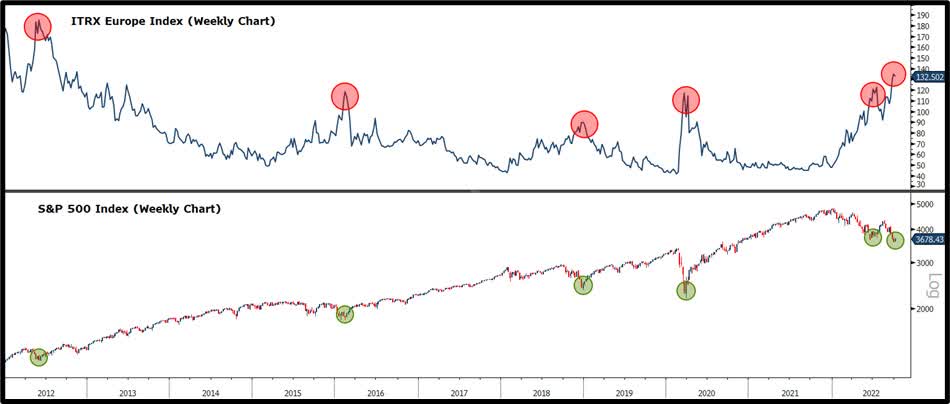
Itraxx vs S&P (Bloomberg – Twitter)
When it comes to the synthetic High Yield 5 -year iTraxx Crossover (75 entities), as the time of us writing we are trading north of 600 bps to around 612 bps.
We think credit spreads will continue to weaken in the coming months given liquidity conditions continue to tighten:
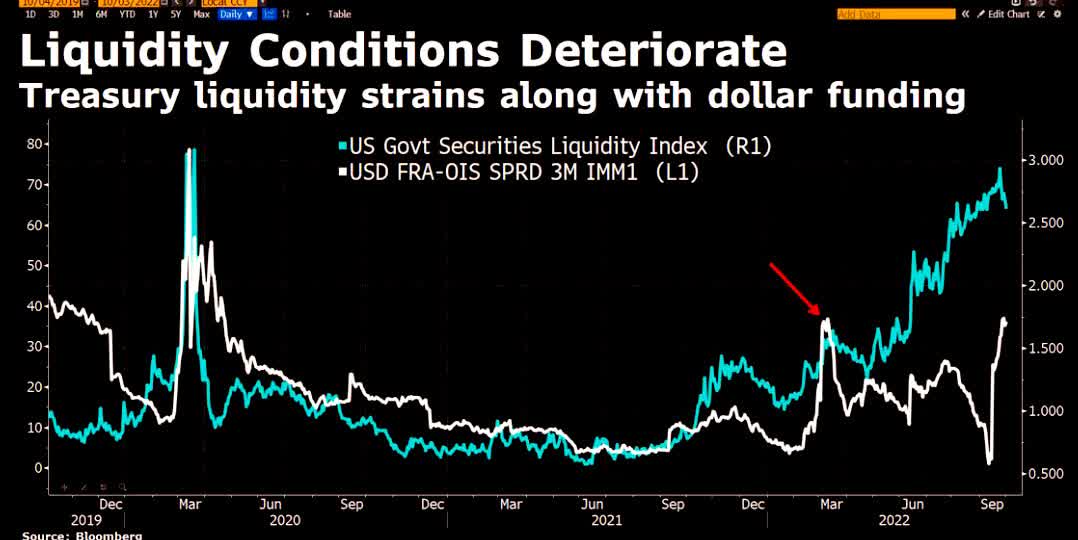
Liquidity Conditions (Bloomberg – Twitter)
As we pointed out in our recent conversations, Mack The Knife (US Dollar + Real rates) is on a murderous rampage. As such things will continue to break until the Fed “pivots”. For cues, credit markets are much more important to the Fed than “equities”.
Financial conditions tightening means more pain for leveraged players such as US High Yield CCCs:
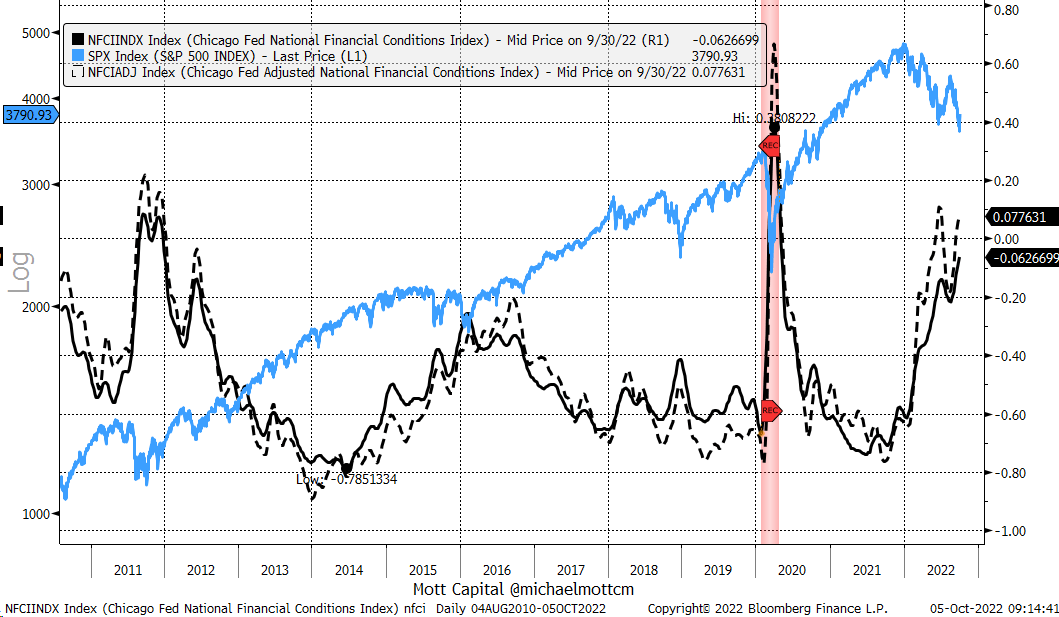
Financial Conditions (Bloomberg – Twitter)
As such, default rates will rise:
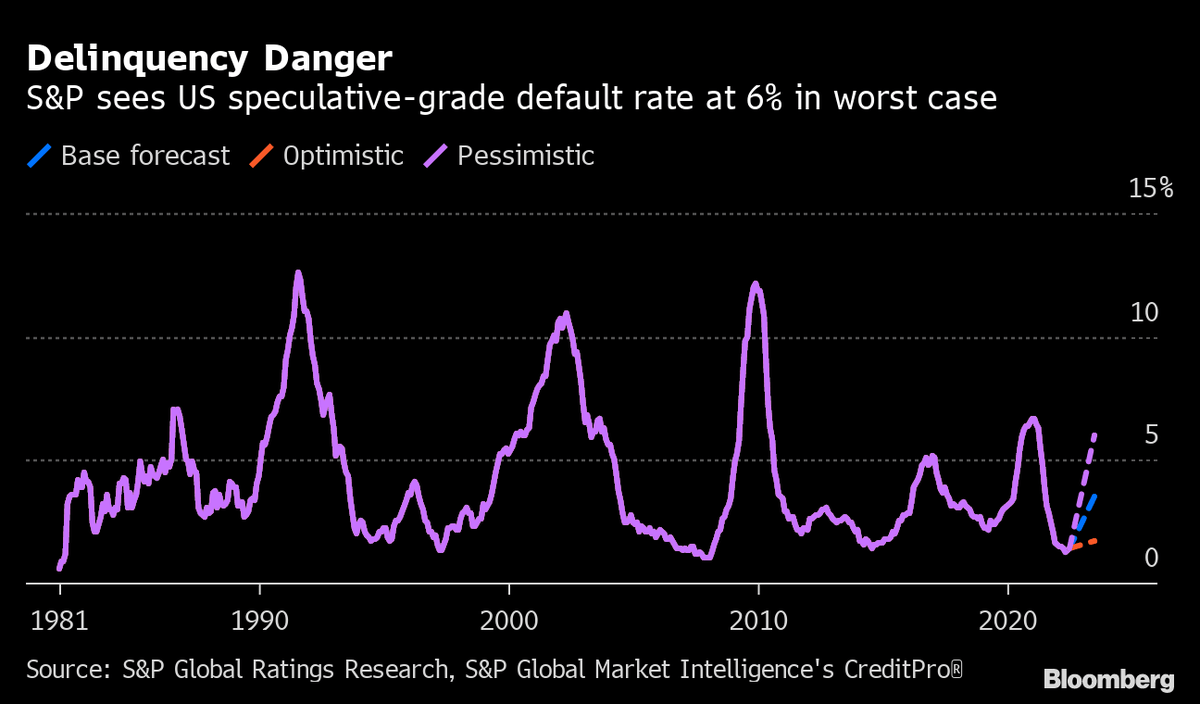
Delinquency (Bloomberg Twitter)
To repeat ourselves the most predictive variable for default rates remains credit availability:
“On the 4th of October U.S. high-yield bond spreads fell the most since November 2020, even as credit analysts start to predict greater default risk ahead.” – Lisa Abramowicz
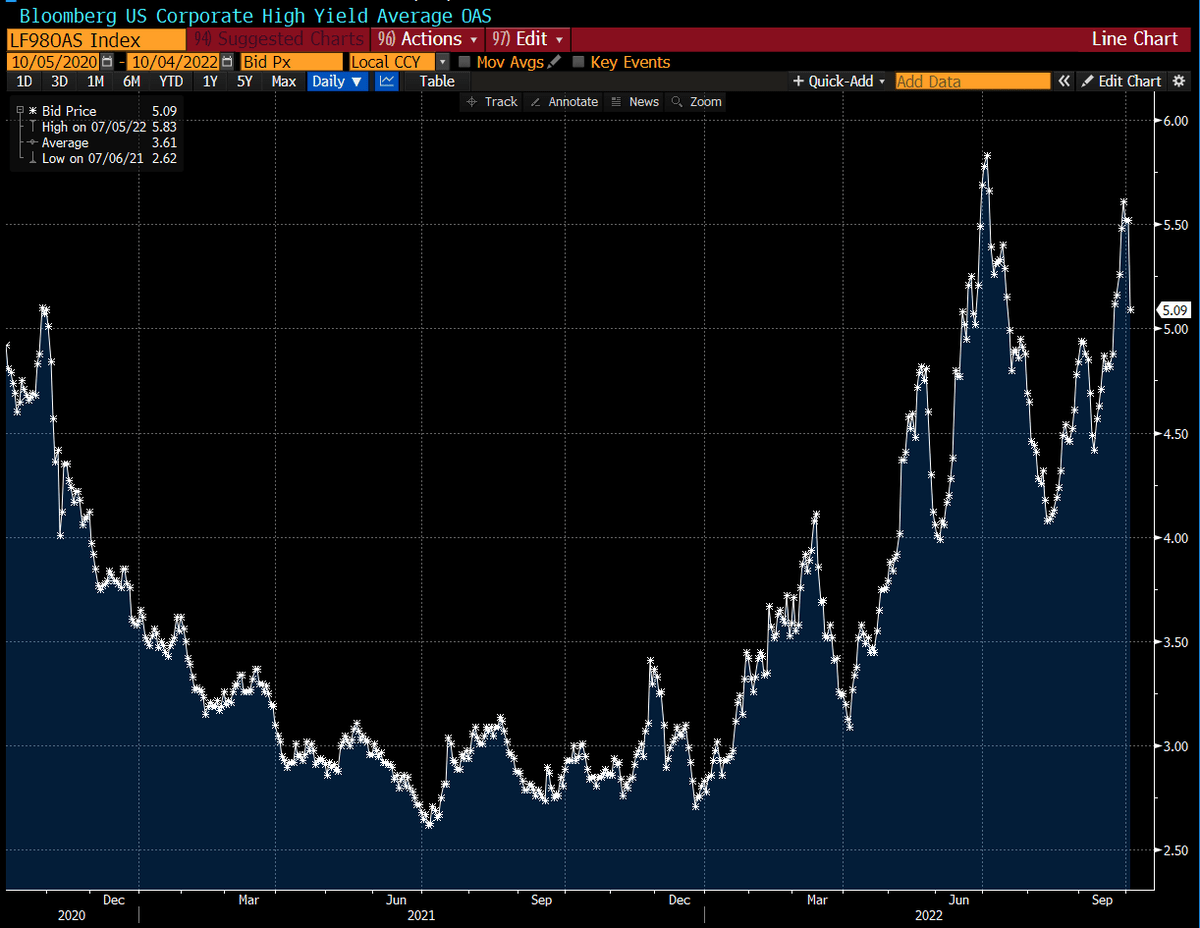
US HY (Bloomberg – Twitter)
As per our 2013 “Guest post – Long-Term Corporate Credit Returns”:
“Current spreads have virtually no correlation with actual future default losses. They are therefore driven by something else (risk aversion, greed/fear cycle). Corporate credit investors actually seem to care a lot about one thing: current (i.e. trailing 12-month) default rates.
We interpret this as evidence that credit investors are collectively subject to an extrapolation bias.
When default rates are high, credit investors behave as if default rates were going to stay high for the next 5-10 years. They liquidate their portfolios in panic (or because they are forced to do so). This snowball effect leads to spread levels that have no economic rationale. At the height of the latest credit crunch, corporate high-yield spreads were pricing a 33% annualized implied default probability over the following five years (20% / ( 1 – 0.40 )), which is around four times the maximum five year annualized default probability during the Great Depression!
Inversely, when default rates are low, credit investors believe that stability is the norm, and start piling up on leverage, inventing new instruments to do so (CLOs, CDOs, CPDOs etc.). This recklessness leads to malinvestment, and sows the seeds of the next credit crisis.
Even for a rolling investor (whose returns are also driven by mark-to-market spread moves), initial spreads explain nearly half of 5yr forward returns.
Conclusion
Benjamin Graham’s famous allegory of a “Mr. Market” who alternates between periods of depression and euphoria applies especially well to corporate credit investors. In addition to having a bipolar disorder, corporate credit investors are afflicted by a severe case of myopia, as they focus on current default rates, rather than trying to estimate realistic future default rates.
As a consequence, spreads themselves are a very good indicator of long-term forward returns, for both static and rolling investors. The last three decades gave investors three extraordinary opportunities to expose themselves to credit risk, as credit spreads reached levels that made no economic sense (we believe that average high-yield spreads above 1000bp are irrational, unless we’re on the verge of a global catastrophe that would wipe out the entire economy).” – Rcube – Paul Buigues- 2013
In the long term however – especially for static investors – only default rates matter, assuming “stable recovery rates”. The issue for us, in the current cycle, as we discussed many times in recent years in our blog postings is that we think this time around, recovery rates will be lower in more instances than the assumed 40% in CDS calculations for Investment Grade credit. Generally speaking, periods of high defaults tend to cluster together (in a very similar way to volatility). Credit markets behave in true “Humpty Dumpty” fashion, meaning that the higher the entropy, the higher the disorder.
- “Humpty Dumpty” UK Pension funds as a measure of “disorder”.
After the near shattering of the GBP 1 trillion UK Pension Fund system, it remains to be seen if UK’s “Humpty Dumpty” can be put together again. This is representative of entropy principle we think as it would be highly unlikely (though not impossible) to return the UK Pension Fund System to its earlier state of lower entropy, as the entropy of an isolated system never decreases as we posited in our introduction explaining our chosen analogy.
As we pointed out in our previous conversation “The Disappearance Of MS München” in February 2016, given our fondness for “power laws” and “rogue waves”:
“LTCM’s trading strategies generally showed no or almost very little correlation. In normal times or even in crises that are limited to a specific segment, LTCM benefited from this high degree of diversification. Nevertheless, the general flight to liquidity in 1998 caused a jump in global risk premiums, hitting the same direction. All (in normal times less-correlated) positions moved in the same direction. Finally, it is all about correlation! Rising correlations reduces the benefit from diversification, in the end hitting the fund’s equity directly. This is similar with CDO investments (ie, mezzanine pieces in CDOs), which also suffer from a high (default) correlation between the underlying assets. Consequently, a major lesson of the LTCM crisis was that the underlying Covariance matrix used in Value-at-Risk (VAR) analysis is not static but changes over time.” – source Credit Crises, published in 2008, authored by Dr Jochen Felsenheimer and Philip Gisdakis
As a reminder from our most important post, the LTCM VaR reference, the Variance-Covariance Method assumes that returns are normally distributed. In other words, it requires that we estimate only two factors – an expected (or average) return and a standard deviation. Value-at-Risk (VAR) calculates the maximum loss expected (or worst case scenario) on an investment, over a given time period and given a specified degree of confidence.
LTCM and the VaR issue remind us of a regular quote we have used, particularly in May 2015 in our conversation “Cushing’s syndrome”:
“The issue with so many pundits following “similar strategies” and chasing the “same assets” in a growing “illiquid” fixed income world is a Cushing’s syndrome impact. Excess stimulants have compressed yield spreads too fast leading to “unhealthy” rapid bond prices gain. The growing issue with VaR (Value at risk) and bond volatility is that it has risen sharply from a risk management perspective. This could lead to a sell-fulfilling “sell-off” prophecy of having too many pundits looking for the exit as the same time, namely “de-risking”. To that effect and in continuation to Martin Hutchinson’s LTCM reference, we would like to repeat the quote used in the conversation “The Unbearable Lightness of Credit”: Today investors face the same “optimism bias” namely that they overstate their ability to exit.
“Liquidity is a backward-looking yardstick. If anything, it’s an indicator of potential risk, because in “liquid” markets traders forego trying to determine an asset’s underlying worth – – they trust, instead, on their supposed ability to exit.” – Roger Lowenstein, author of “When Genius Failed: The Rise and Fall of Long-Term Capital Management.” – “Corzine Forgot Lessons of Long-Term Capital“
This is what we had to say about VaR in our May 2015 conversation “Cushing’s syndrome” and ties up nicely to our world of rising positive correlations. Your VaR measure doesn’t measure today your maximum loss, but could be only measuring your minimum loss on any given day.
Rising positive correlations, are rendering “balanced funds” unbalanced and as a consequence models such as VaR are becoming threatened by this sudden rise in non-linearity as it assumes normal markets. We have seen the effect on 60/40 funds who have been obliterated in 2022. A 60/40 Portfolio of US Stocks/Bonds is down 21% in 2022, on pace to become the second worst year in history after 1931. In real terms 60/40 are down 26%, making it the worst year ever.
As we posited in our 2016 conversation, if you think diversification is a “solid defense” in a world of “positive correlations,” think again, because here is what the authors of “Credit Crisis” had to say about LTCM and tail events (Rogue Waves):
“Even if there are arbitrage opportunities in the sense that two positions that trade at different prices right now will definitely converge at a point in the future, there is a risk that the anomaly will become even bigger. However typically a high leverage is used for positions that have a skewed risk-return profile, or a high likelihood of a small profit but a very low risk of a large loss. This equals the risk-and-return profile of credit investments but also the risk that selling far-out-of-the-money puts on equities. In case of a tail event occurs, all risk parameters to manage the overall portfolio are probably worthless, as correlation patterns change dramatically during a crisis. That said, arbitrage trades are not under fire because the crisis has an impact on the long-term-risk-and-return profile of the position. However, a crisis might cause a short-term distortion of capital market leading to immense mark-to-market losses. If the capital adequacy is not strong enough to offset the mark-to-market losses, forced unwinding triggers significant losses in arbitrage portfolios. The same was true for many asset classes during the summer of 2007, when high-quality structures came under pressure, causing significant mark-to-market losses. Many of these structures did not bear default risk but a huge liquidity risk, and therefore many investors were forced to sell.” – source Credit Crises, published in 2008, authored by Dr Jochen Felsenheimer and Philip Gisdakis
You probably understand by now why we have raised the “red flag” so many times on our fear in the rise of “positive correlations.” In the case of the UK Pension Fund “margin call”, we have had a tail event that precipitated the fall of UK’s “Humpty Dumpty”. In a letter to the Treasury Select Committee viewed by Insider, deputy governor for financial stability Jon Cunliffe said concerns over liability-driven investment strategies popular with UK pension funds is what drove the central bank to take action:
“Had the Bank not intervened on Wednesday 28 September, a large number of pooled LDI funds would have been left with negative net asset value and would have faced shortfalls in the collateral posted to banking counterparties. [Defined benefit] pension fund investments in those pooled LDI funds would be worth zero,” Cunliffe said.
Liability-driven investment strategies typically buy long-dated bonds and employ leverage in a bid to boost their returns so they can more confidently meet their future obligations. But with sudden jerks in the UK gilt market, that leverage came with a margin call when UK gilt yields soared, with the 30-year gilt yield climbing as high as 5.09%, its highest level since 2002:
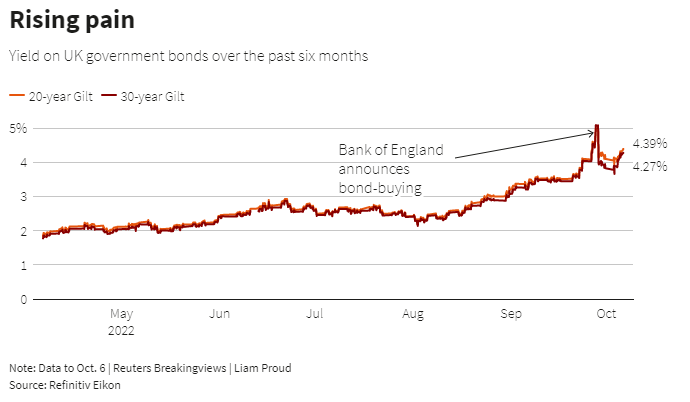
UK Gilts (Reuters – Twitter)
Of course, the Long-Dated Gilt “Rogue Wave” did indeed take the whole LDI funds to the proverbial woodshed. It remains to be seen if “Humpty Dumpty” can be returned to its prior entropy level. We are not that confident…
“It is only prudent never to place complete confidence in that by which we have even once been deceived.” – Rene Descartes
Be the first to comment