

Mongkol Onnuan/iStock via Getty Images
Written by Nick Ackerman, co-produced by Stanford Chemist. This article was originally published to members of the CEF/ETF Income Laboratory on June 17th, 2022.
John Hancock Tax-Advantaged Dividend Income Fund (NYSE:HTD) continues to be a fund I rely on as what I would call a core holding or a “set and forget” fund. They have one distribution cut in their history, in the aftermath of the great financial crisis of 2008/09. Since then, they have boosted back up to the high watermark that was achieved pre-cut.
The fund utilizes a hybrid approach of investing in mostly utility equities, and the other half of its portfolio is in preferreds. Despite these relatively safer areas to invest in, the latest push lower has dropped HTD to negative territory for the year. That’s on both a total share price and total NAV return basis.
Ycharts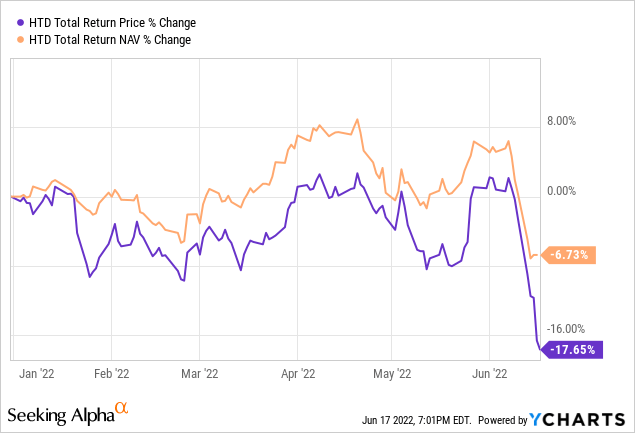
The latest declines have been most notable as they have taken the energy sector down. That has pushed the sector into the technical bear decline of a 20% drawdown from the previous highs. Utilities had also been the other sector that was flirting with positive territory this year before this latest drop lower. It might be harder to notice that energy hasn’t been performing as well lately. That area is still well into the green for the year. That would be thanks to their massive run-up earlier in the year.
Ycharts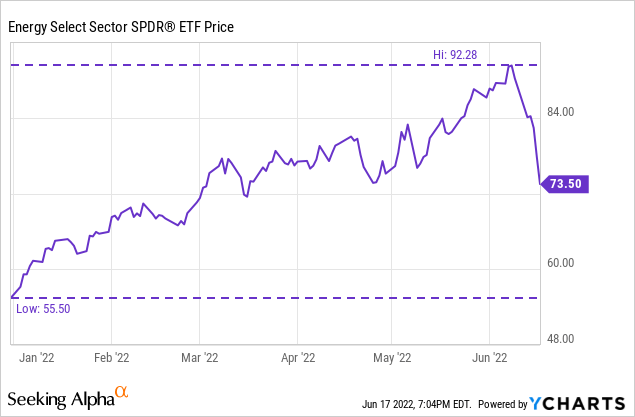
The latest plunge has also pushed HTD back into discount territory from its NAV per share. The distribution still remains reasonable, and unless we go even lower than here, I don’t see a cut coming.
The Basics
- 1-Year Z-score: -1.69
- Discount: 6.01%
- Distribution Yield: 7.85%
- Expense Ratio: 1.19%
- Leverage: 30.97%
- Managed Assets: $1.35 billion
- Structure: Perpetual
HTD’s objective is to “provide a high level of after-tax total return from dividend income and capital appreciation.” They highlight that the fund can be used for “tax-sensitive equity income.” After all, even folks in retirement looking for fixed income should have some exposure to equities as well to maintain some diversification.
Their approach to investing is “typically investing at least 80% of assets in dividend-paying securities.” With that, they will “typically emphasize preferred and common securities in the high dividend-paying utility sector.”
The portfolio is dominated by utility exposure in the equity market while at the same time having a healthy allocation to financials via preferred security exposure. The financial sector issues preferred to help them maintain their required capital ratios. Due to the Dodd-Frank Act, only non-cumulative perpetual preferred count.
The fund’s expense ratio comes out to 1.19%. When including leverage, this comes up to 1.55%. The leverage is particularly noteworthy as we enter into a period of volatility. This does increase risks for investors as the downside is increased, which is the ugly side of borrowing capital to invest. No one is complaining is a rising market, though.
On top of this, a rising interest rate environment puts additional expenses on the fund. During fiscal 2019, the expense ratio climbed to 2.61%. The increased costs of leverage primarily drove that increased expense ratio. Interest rates are expected to rise even higher during this rate hiking cycle, which needs to be considered before investing.
As of their last fiscal year, they were paying LIBOR plus 0.625%. With the discontinuation of LIBOR, this will likely be different in the future. However, based on the last fiscal year, they paid an interest rate of 0.71%. I’d consider that to be some cheap financing that won’t be so cheap going forward.
Performance – Long-Term Winner
The fund has provided solid results over the longer term. It is a rather unique fund because there aren’t too many peers. Their blend of utilities plus preferred isn’t replicated from any of the funds I follow regularly. The closest could be Virtus Total Return Fund (ZTR), but they have a focus more on utilities plus fixed-income in the investment-grade and below-investment-grade bond space rather than preferred.
With that, they provide their own blended benchmarks. Of course, they have beaten these benchmarks because if I chose my own benchmarks, I’d make sure I could beat them too. That being said, it is fully disclosed what they are being compared to. So I think it is fair to use these benchmarks since we are given exactly what they will be blended with.
HTD Annualized Returns (John Hancock)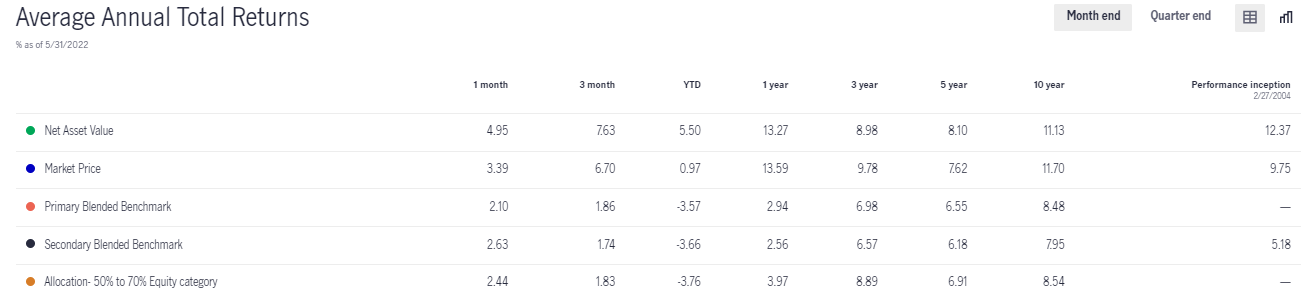
Here are the benchmark disclosures now to show exactly what we are comparing above.
The ICE Bank of America Preferred Stock DRD Eligible Index consists of investment-grade fixed-rate U.S. dollar denominated preferred securities and fixed-to-floating-rate securities. The index includes securities having a minimum remaining term of at least one year, Dividend Received Deduction (DRD) eligible preferred stock and senior debt. The S&P 500 Utilities Index is a capitalization-weighted index that consists of companies in the S&P 500 Index that are primarily involved in water, electrical power, and natural gas distribution industries. Intercontinental Exchange (ICE) Bank of America (BofA) US All Capital Securities Index tracks all fixed- to floating-rate, perpetual callable and capital securities of the ICE BofA US Corporate Index. The Primary Blended Benchmark comprises 55% ICE Bank of America US All Capital Securities Index and 45% S&P 500 Utilities Index. The Secondary Blended Benchmark comprises 55% ICE Bank of America DRD Eligible Preferred Stock Index and 45% S&P 500 Utilities Sector Index. It is not possible to invest in an index.
I personally believe these benchmarks are appropriate too, but again, they’ve selected them. Additionally, they’ve been leveraged over the last decade while these benchmark indexes wouldn’t be leveraged.
The fund has been pushed into a discount with the market’s latest declines for the year, as we showed above. That’s a primary driver for investing in a CEF. Over the last decade, the average discount has come to 6.62%. That puts the 6.01% latest closing discount right near this longer-term average.
That has historically meant that further downside through discount expansion can be limited. The fund had reached 10% discount levels in the last decade, but they had been there for a relatively short period of time. Pre-GFC, the fund spent a lot of time at a discount of over 10%.
HTD Discount/Premium Chart (CEFConnect)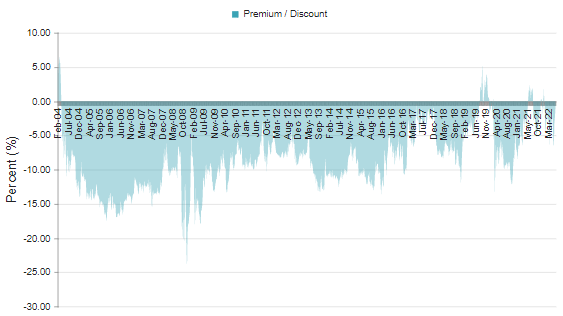
The latest discount is also in sharp contrast to the fund’s premium that it was trading at last year.
Distribution – Steady
The fund’s latest distribution yield comes to 7.85%. This is elevated from our previous coverage, primarily driven by the latest declines. On a NAV basis, the distribution rate comes to 7.38%. This is also higher, of course, but is at a reasonable level.
HTD Distribution History (CEFConnect)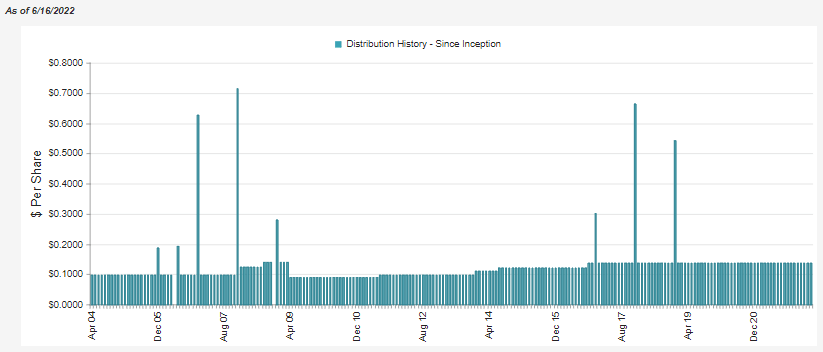
Since the fund’s NAV has been holding up significantly better than the fund’s share price has, I still don’t see a reason to be too concerned at this level. We will be seeing a new report from the fund in the next few weeks, so I won’t go into too much detail with this update. The last update still provides all the relevant points that would still be the case in today’s update.
One of the key metrics for a fund’s earnings is the net investment income. NII coverage was at nearly 74%, so that point bears repeating. This is thanks to the reliable and consistent utility and preferred that the fund holds.
For tax purposes, it comes to little surprise with the fund’s name that they are tax-advantaged. That isn’t to say there are no tax obligations, but they target distributions that will be classified as primarily long-term capital gains or qualified dividends. This was the case in 2021; it was 100% qualified dividends and long-term capital gains.
HTD’s Portfolio
We’ve highlighted previously that HTD has a relatively low turnover rate. That means it isn’t uncommon to see the same holdings regularly show up when looking at their portfolio. As of the end of Q1 2022, the fund’s utility exposure was the overwhelming majority of its portfolio. At 62%, this was only a slight increase from the previous look when they reported 60.61% in the sector.
HTD Sector Breakdown (John Hancock)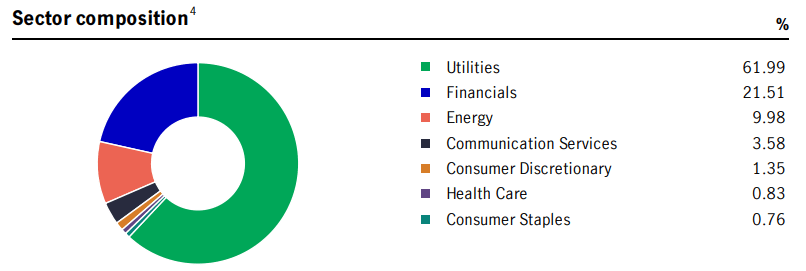
The financial exposure we see here is primarily a result of the fund’s preferred stock. As we mentioned above, financials are one of the largest issuers of preferred stock, so this makes sense.
The financial exposure, in this case, has fallen a bit. Some of this slight shift is a result of preferreds actually not holding up as well as utilities. We can compare something like the SPDR Utilities Sector (XLU) to the iShares Preferred and Income Securities ETF (PFF) for the first quarter.
Ycharts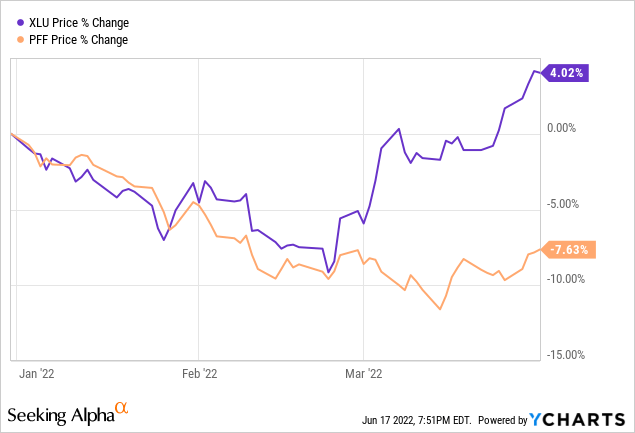
That’s only for the first three months of the year. Since then, the divergence has closed a bit as both areas of the market decline. The utility sector just did a lot more, declining in the following three months or so, doing some “catch-up” to the preferred space, in a way.
Ycharts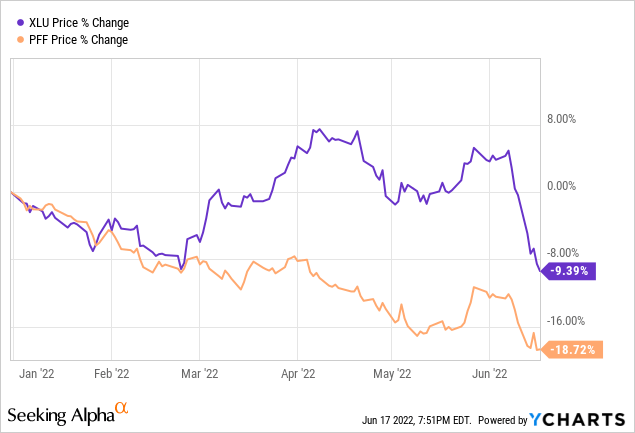
This all has impacted HTD and explains why we see what we have so far with the fund. The fund had been holding up relatively better due to its utility exposure, but this last slump has brought it down with the rest of the market.
Looking at the latest top ten, we see many familiar names. Not only because we regularly update coverage on HTD but because these are some of the more popular utility and energy names to be invested in. The top ten account for a somewhat hefty ~35% allocation. Overall, the fund’s latest number of total holdings came to 106.
HTD Top Ten (John Hancock)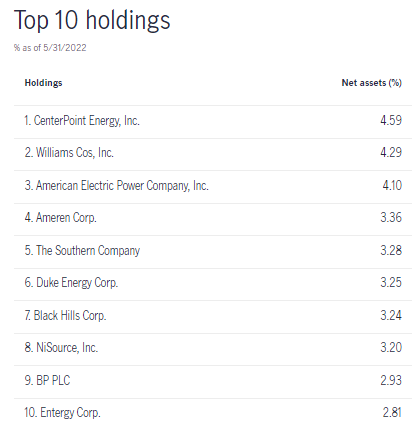
CenterPoint Energy (CNP) and The Williams Cos (WMB) have raced up to higher allocations. CNP was the largest allocation at the end of 2021, but this lead has grown. WMB was at a weighting of 3.09%, meaning they’ve made a rather meaningful climb. This would be thanks to it being an energy play.
Ycharts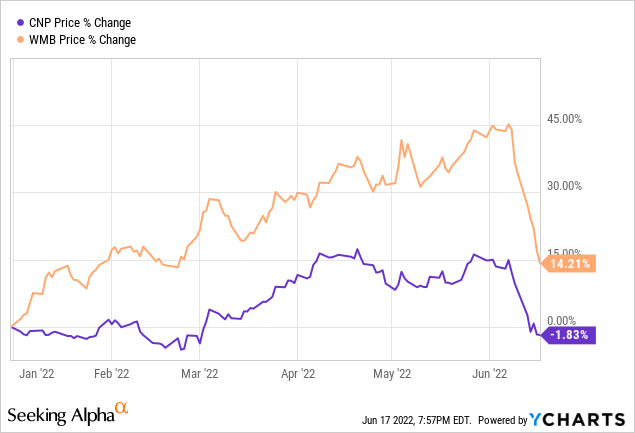
On a YTD basis, these stocks show a fairly accurate trajectory of their relative sectors. The overall energy sector is up more than WMB, but the latest declines have been sharp. CNP is outperforming the utility sector but again follows a similar trajectory.
Conclusion
Is HTD foolproof? Absolutely not; no investment is. The particularly high leverage with rising interest rates adds to risks. The fund has navigated difficult periods previously successfully. That doesn’t mean they will again, but the fund continues to pay out every single month. Even in a prolonged, deep recession such as 2008/09, they continued to pay. It was a reduced amount, but it wasn’t ever a point where it was suspended completely.
This is thanks to the approach of investing in steady utilities and preferred stocks. During a crash, they can crash just as hard. However, they tend to continue generating a healthy amount of income even through tough economic times.
Be the first to comment