

Byrdyak/iStock via Getty Images
The market can be very volatile at times leading investors to get caught up in all the noise. However, we hope to cut through all the rhetoric by looking at the numbers in an attempt to simplify our decision-making process. We don’t try to predict, but rather, we try to react to the current state of the macroeconomic situation. Hopefully, you find this article helpful in your decision-making process.
How Attractive Are Stocks?
To answer this question, we will compare the earnings yield of the S&P 500 to the risk-free rate of the 3-month U.S. Treasury Bill. The rationale for this is that if we wanted to move away from a risk-free asset, we should be compensated more for the additional risk. The earnings yield can be viewed as the potential dividend payment we would receive if 100% of earnings were paid out and no growth was expected. As a result, the earnings yield should be higher.
Using the current earnings yield is best for investors who aren’t interested in forecasting and would prefer to look at the actual numbers from the most recent quarter. As a result, the 3-month T-Bill is the most logical comparison since a quarter is 3 months long. At the time of writing, the spread between the two yields is 3.32%, meaning that stocks are still relatively attractive.
Below is a chart of the historical spread:
Image created by the author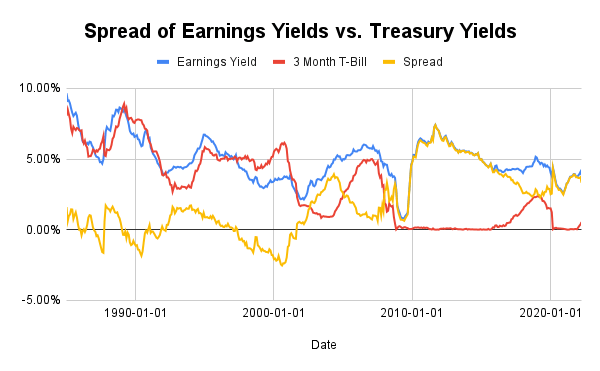
As we can see from the chart above, there were periods of time when the spread was actually negative, meaning investors were getting a better yield from risk-free assets than from stocks.
What’s interesting is that these negative readings came before the significant market declines of Black Monday, the 1990 recession, and the Dot-com bubble. In addition, it came very close to turning negative before the Great Recession.
Thus, it appears to be a very good gauge of when markets become out of control and also helps explain why 2020 and 2021 saw strong upside after the COVID-19 crash. With bond yields being so low, there was nowhere else for money to go except into stocks.
What’s also interesting to note is that the periods of market declines were preceded by a sharp increase in the 3-month Treasury yield. This is important because T-Bills follow the Federal Funds Rate very closely and thus would imply that the Federal Reserve had hiked rates too fast during those time periods.
Therefore, investors need to monitor what the Federal Reserve does because it could potentially push yields high enough to the point where risk-free assets provide higher returns than stocks.
Don’t Forget to Focus on Expectations
It’s important to realize that while increasing treasury yields and increasing stock prices reduce the spread, earnings decline also plays an important role. This was the case in the 1990 recession, the Dot-com bubble, the Great Recession, and during the beginning of the pandemic.
If earnings begin to decline, the earnings yield drops, and investors begin to sell stocks. Therefore, it’s also important to monitor the market’s expectations, especially since it’s forward-looking.
To do this, we will use the expected earnings of the S&P 500 and Fed Funds Futures contracts (assuming that the 3-month T-Bill will be similar to the Fed Funds rate) to calculate the forward spread.
Currently, the market expects the trailing 12-month earnings for June of 2023 to be $221.10 per share, implying a forward earnings yield of 4.87%.
S&P Global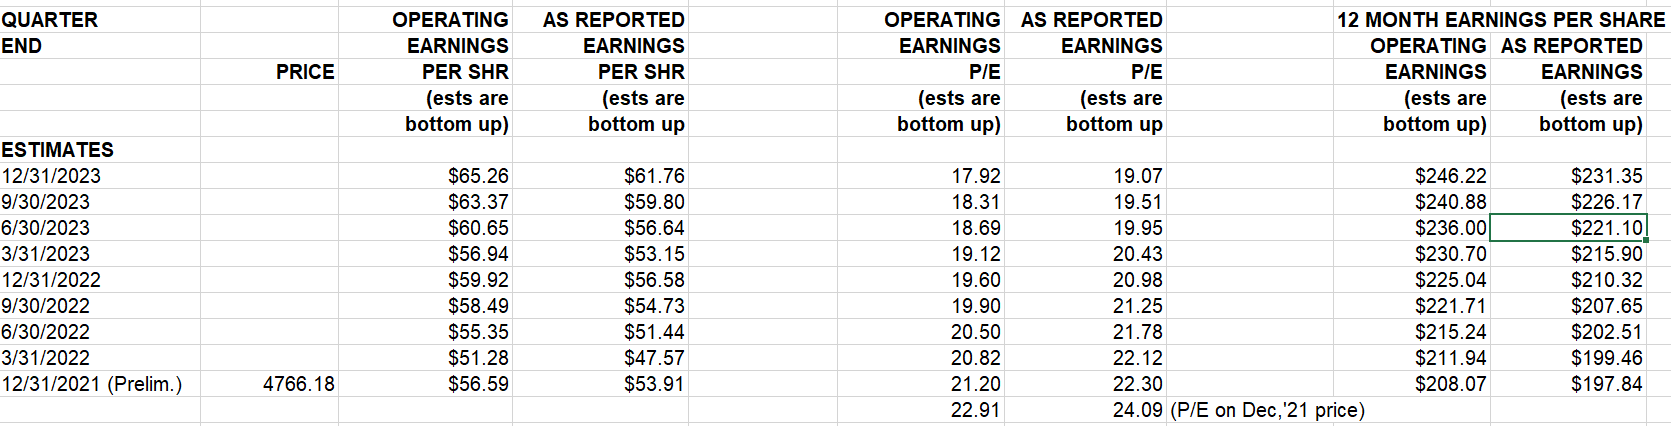
Looking at the Fed Funds Futures contract that matches the time of the earnings estimate, it is currently implying a rate of 2.68% (calculated as 100 – price of the contract).
CME Group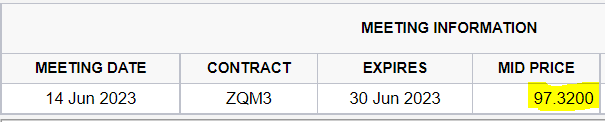
Thus, the forward spread is 2.19%.
However, keep in mind that the spread between the 3-month T-Bill and the actual Federal Funds rate tends to be within 1% of each other, at least for the most part, as pictured below:
St.Louis Fed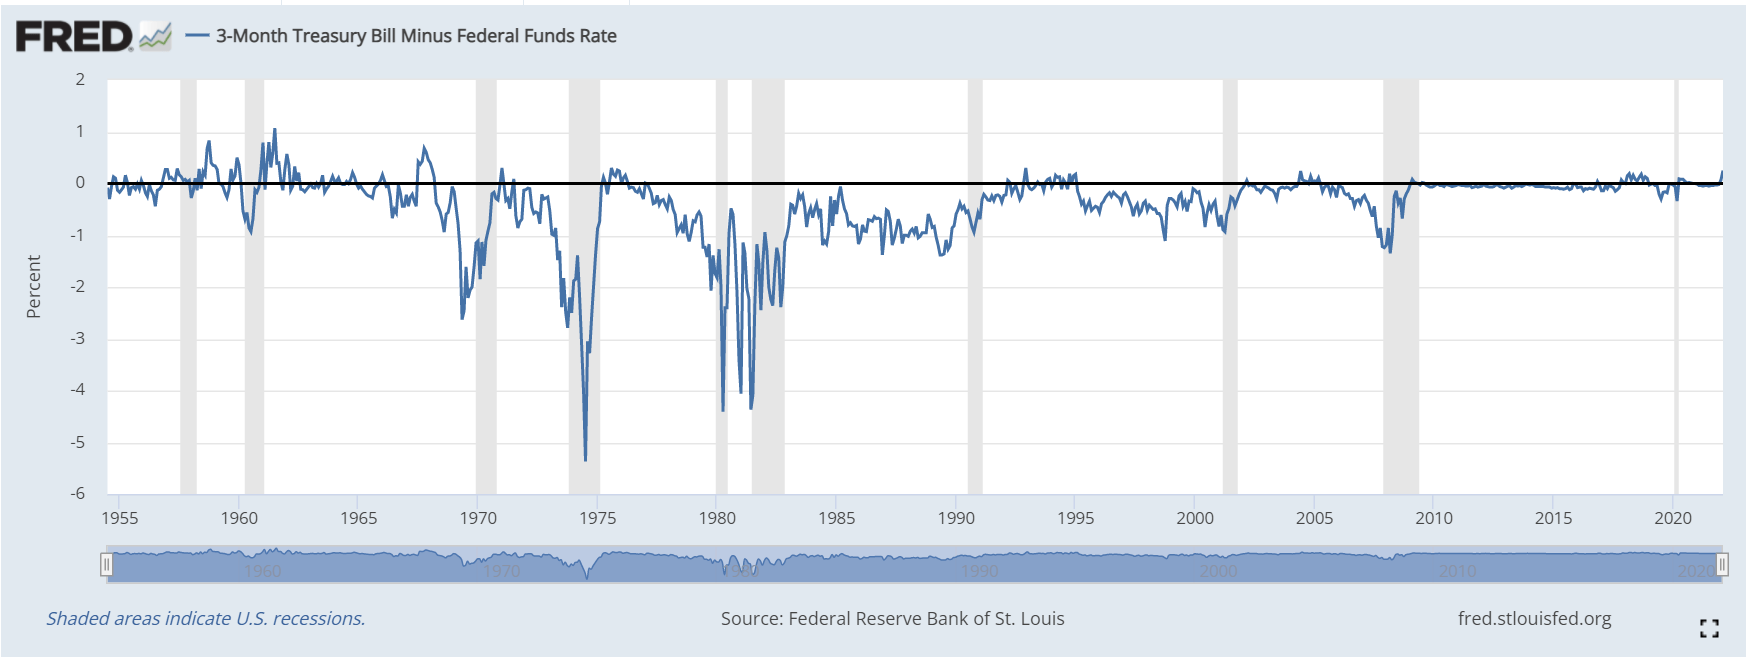
Therefore, we can estimate that the forward spread will likely range between 1.19% to 3.19%.
Although we call it the “forward spread,” it’s important to distinguish that we ourselves are not really forecasting because we are simply looking at what the market is expecting at the current time and reacting to the changes in its expectations at the end of each trading day.
Final Takeaway
The bottom line of this article is that investors should consider how much more they are theoretically getting paid over risk-free assets to take on the additional risk of equities. Although markets can become irrational at times and lead to outsized gains in price appreciation, they tend to eventually revert back to the fundamentals.
The key is to logically and objectively assess when markets have become too irrational and reduce exposure to speculative stocks when it happens. Furthermore, because the market is forward-looking, it is also important to stay on top of the market’s continuously changing expectations and adjust your positions accordingly.
Although it’s impossible to perfectly time the market, there are always clues for avoiding the worst parts of a large downside move. Nonetheless, as things currently stand, stocks are still attractive at the time of this writing as there really is no other alternative for investors, and the spread is still relatively high.
Be the first to comment