

undefined undefined/iStock via Getty Images
A “bull market” in a financial asset means there is a rising price uptrend with higher highs and higher lows. Conversely, a “bear market” in a financial asset means there is a falling price downtrend with lower highs and lower lows.
THE Major Problem For Investors
Bear markets are THE major problem for investors. If stocks and other financial assets were always in bull market uptrends, the life of an investor would be easy, stress-free and filled with unicorns and rainbows! But that is not the case, unfortunately.
In addition to causing huge losses and lots of stress, the damage from bear markets can last for decades. For example, it took the S&P 500 about 25 years to return to its 1929 peak. It took the NASDAQ about 15 years to return to its 2000 “tech bubble” peak. It took gold about 28 years to return to its 1980 peak. And the Japanese stock market is still about 35% below its 1989 peak, 32 years later — after having been down 80% 20 years after that peak (and this is despite a couple of decades of 0% interest rate policy)! Two or three decades of losses is more than most investors can handle emotionally or financially, particularly those approaching or in retirement.
But what can investors do about bear markets? Is there a solution to this critical problem?
Most Wall Street advisors will tell you to always stay fully invested in stocks “for the long run” (which keeps their fees flowing uninterrupted) since it is “impossible to time the market”.
They are right that it is impossible to “time the market” or consistently pick tops and bottoms. But they are wrong when they lead you to believe that you can’t make lots of money (or at least avoid huge losses) by learning how to identify the key indicators of bear markets and acting wisely on those indicators.
This is very important, since we see many factors that point to the next bear market being the worst since the Great Depression, as we discussed in this Seeking Alpha article. It is also very timely, given the weakness we’ve seen in global stock markets and most other “risk-on” assets so far this year, including Bitcoin, which we discussed in this Seeking Alpha article.
Key Bull & Bear Market Technical Indicators
There are many technical indicators we follow that provide objective evidence that the stock market is in a bull or bear market trend, including breadth indicators such as advance-decline lines, new highs and lows, etc.
In addition to those indicators, which are extremely useful for identifying stock market trends, there is a very simple and proven technical tool that can be used to determine bull and bear market trends for any financial asset: simple moving averages.
A simple moving average is simply a line on a price chart that shows the average price for the asset over a given time period. It “moves” every trading day as a new day is added and the oldest day drops off. Moving averages are very useful for assessing trends because they smooth out the noise of daily price movements and help you see trends more clearly.
We like to focus on these key simple moving average time periods:
1. 20-day moving average (20-dma) — roughly one month of trading days to assess the short-term trend
2. 60-dma — roughly three months of trading days to assess the intermediate-term trend
3. 250-dma — roughly 12 months of trading days to assess the long-term trend
To smooth out trends and reduce the risk of “head fakes”, we generally use the following technical rules to determine when a bull market uptrend is in place:
1. price is above the 250-dma,
2. 20-dma is above the 250-dma,
3. 60-dma is above the 250-dma and
4. slope of 250-dma is positive
Conversely, we generally use the following technical rules to determine when a bear market downtrend is in place:
1. price is below the 250-dma,
2. 20-dma is below the 250-dma,
3. 60-dma is below the 250-dma and
4. slope of 250-dma is negative
Now let’s see how these simple technical rules can help you earn substantial profits in both bull and bear markets.
S&P 500 Bull & Bear Markets
The chart below shows the price of the S&P 500 (black line) with its 250-dma since 1980. We put red circles around periods when the price fell below the 250-dma and the slope of the 250-dma was declining.
S&P 500 since 1980 (StockCharts.com)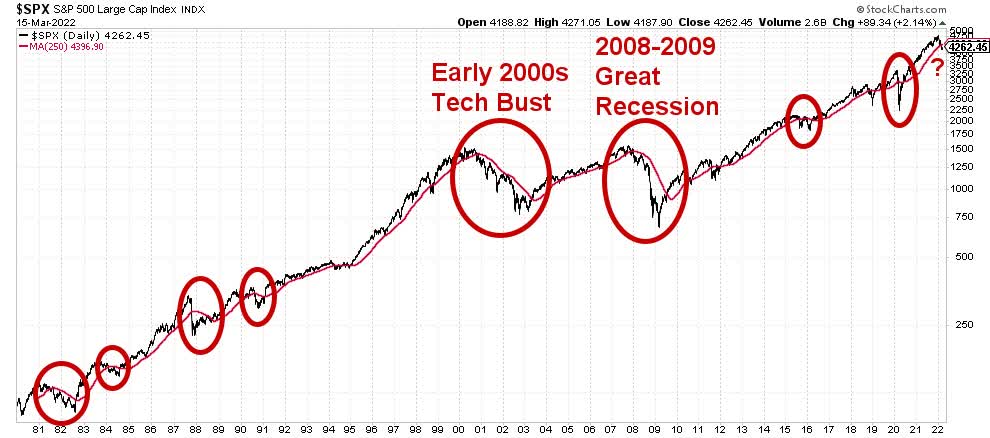
Six of these eight “bear market” periods were relatively short-lived. Acting on them would have generally led to break-even results, more or less.
But two of them — the early 2000s Tech Bust and the 2008-2009 Great Recession — were major bear markets where substantial profits could have been earned by investing in “inverse” ETFs that make money in bear markets. We discussed these ETFs in our previous Seeking Alpha article.
Early 2000s Tech Bust
The early 2000s Tech Bust bear market is shown in the chart below of the SPDR S&P 500 ETF (SPY). The price of SPY is shown in orange with the 250-dma shown in red, the 60-dma shown in green and the 20-dma shown in blue.
SPY During Early 2000s (StockCharts.com)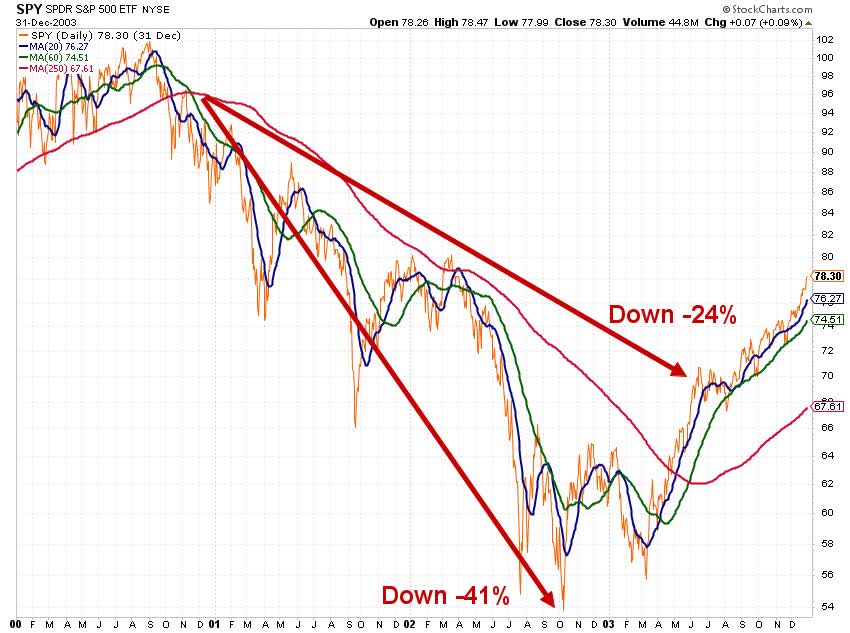
From November 2000 when the price of SPY, as well as the 20-dma and 60-dma all fell below the 250-dma, until the bottom nearly two years later in October 2002, SPY fell about 41%. By June 2003, when the price of SPY, as well as the 20-dma and 60-dma all rose above the 250-dma, SPY had fallen about 24%.
If one had owned SPY during the period of those clear signals from November 2000 to June 2003, $100 of portfolio value would have fallen to $76. If instead, one had acted on those signals by simply buying an inverse ETF such as ProShares Short S&P 500 (SH) — which didn’t exist then, but does now — in November 2000 and then exiting SH in June 2003, $100 of portfolio value would have risen to $124.
That would have created 63% more wealth than simply “buying and holding”, well worth the time and effort of making those two trades! Furthermore, additional profits during that bear market could have been made using other simple technical indicators we follow that help identify when bear market rallies begin and end.
2008-2009 Great Recession
The 2008-2009 Great Recession bear market is shown in the chart below of SPY. Again, the price of SPY is shown in orange with the 250-dma shown in red, the 60-dma shown in green and the 20-dma shown in blue.
SPY During 2008-2009 (StockCharts.com)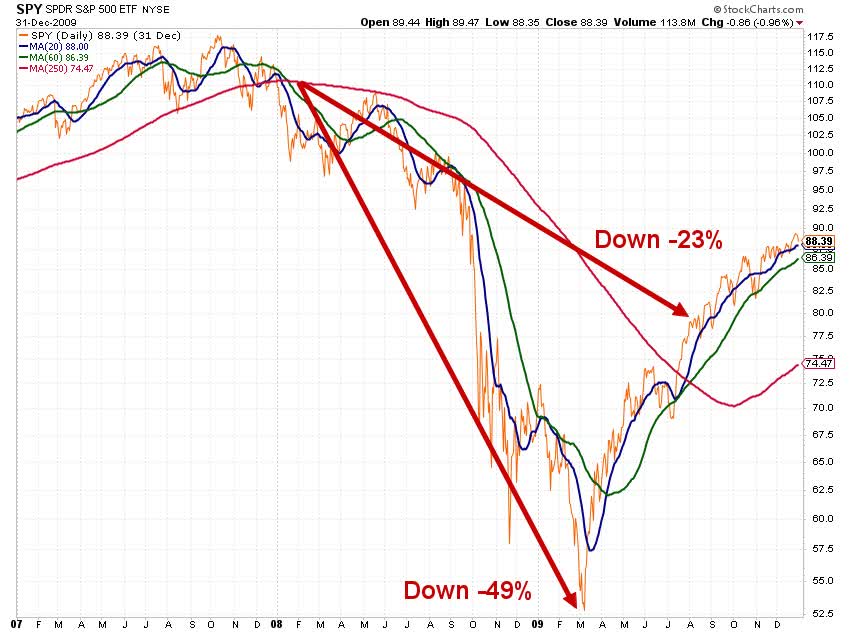
From January 2008 when the price of SPY, as well as the 20-dma and 60-dma all fell below the 250-dma, until the bottom in March 2009, SPY fell about 49%. By August 2009, when the price of SPY, as well as the 20-dma and 60-dma all rose above the 250-dma, SPY had fallen about 23%.
If one had owned SPY during the period of those signals from January 2008 to August 2009, $100 of portfolio value would have fallen to $77. If instead, one had acted on those signals by simply buying an inverse ETF such as ProShares Short S&P 500 (SH) — which did exist then — in January 2008 and then exiting SH in August 2009, $100 of portfolio value could have risen to $123. That would have created 60% more wealth than buying and holding — not bad for a couple of trades! And again, additional profits could have been made during that time by using other simple technical indicators we follow.
Implications For Investors
By properly understanding and using technical indicators, you can earn substantial profits during bull markets. Less well known is that you can also earn substantial profits during bear markets, instead of suffering crushing losses.
While these simple rules won’t help you pick the exact top or bottom of a bull or bear market, nothing else will either. But you can create lots of wealth by understanding these rules and acting on them to compound high returns over time.
Be the first to comment