

franckreporter/iStock via Getty Images
Let’s get real. There are no low-volatility stocks except those that haven’t changed price in 10 years. That’s not going to interest anyone.
From my own calculation, the S&P stock with the lowest volatility since 2010 is Johnson & Johnson (JNJ), with 16.8%. It still had a drawdown of 27% and returned, on average, 12% each year. That is not a bad payout for the risk. Can we do better?
The 10 stocks with the lowest volatility are shown in Table 1, calculated from January 2010, which includes the sustained bull market. The returns tend to be low, the best being XEL (Xcel Energy) with 16%, and the volatility and maximum drawdown tend to be large.
Table 1. The 10 stocks with the lowest volatility (Data source: CSI)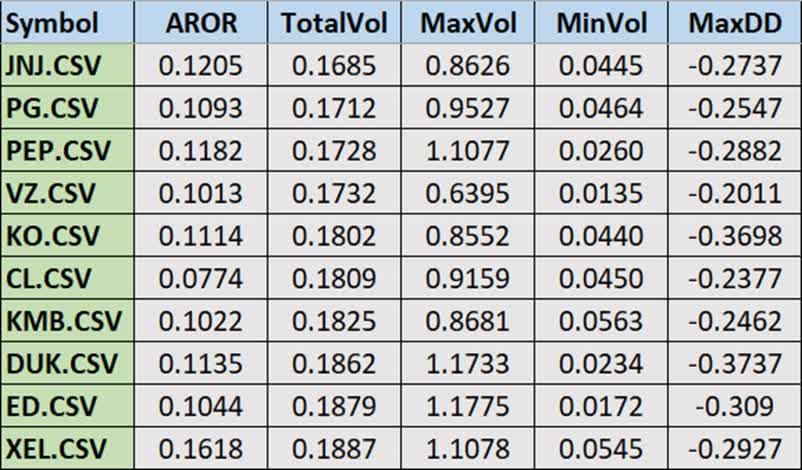
Low-Volatility ETFs and Other Recommended Stocks
There are a slew of ETFs named “low volatility” and “minimum volatility factor.” Among those, the ETFs with the most liquidity are
- ACWV, iShares MSCI Global Min Vol Factor
- USMV, iShares MSCI USA Min Vol Factor
- SPLV, Invesco S&P 500 Low Volatility
- EFAV, iShares MSCI EAFE min Vol Factor
- EEMV, iShares MSCI Emerging Markets Min Vol Factor
A chart of these ETFs compared to SPY, the S&P ETF, are shown in Figure 1. While ACWV seems as volatile as SPY, the other ETFs are less volatile, but at the cost of lower returns. EEMV has a near-zero return.
Figure 1. The 10 stocks with the lowest volatility (Data source: CSI)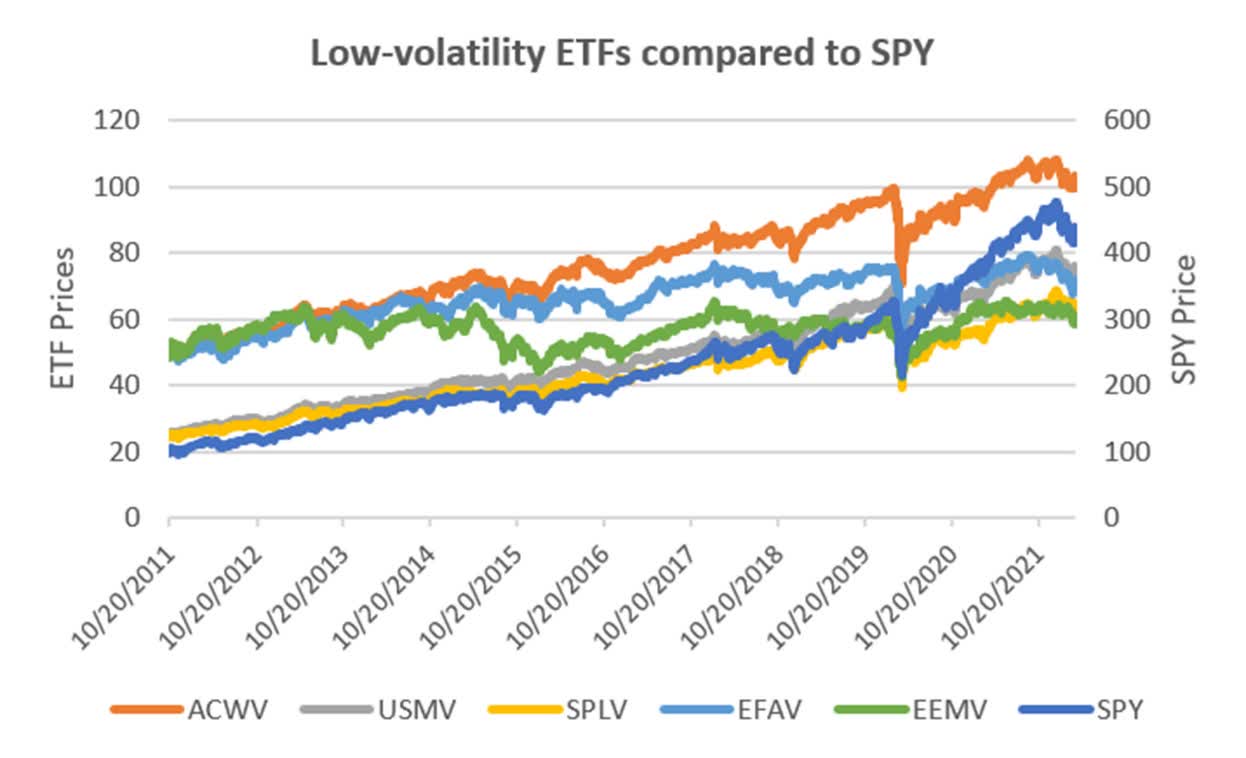
To compare the volatility of the ETFs with our benchmark SPY, look at Table 2. While there is a reduction in the probability of risk (“Volatility”), there is not much change to the maximum drawdown (MaxDD) in each ETF. The column “Ratio” is the AROR divided by the MaxDD, called the Sortino ratio. It shows that the payout is not attractive. The best of the “low volatility” ETFs is USMV, with a return-to-risk ratio of 0.337. In Figure 1 it tracks the S&P closely with lower volatility but also with lower returns.
Table 2. Low-Volatility ETFs plus SPY (Data source: CSI)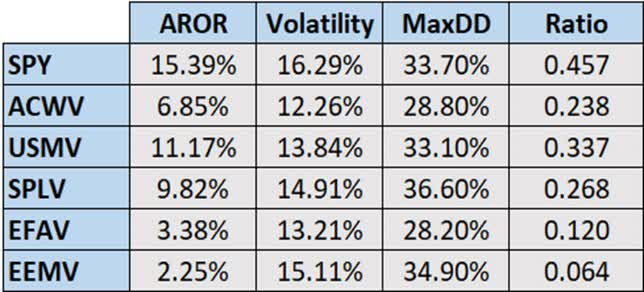
Other “Low-Volatility” Stocks Found on the Internet
Finally, there are individual stocks recommended for giving a good return with low risk. They are Aflac (NYSE:AFL), Honeywell (HON), Pepsi-Cola (PEP), Leows (L), and P&G (PG).
In my measurement of return to risk (the payout ratio), Aflac came out at #176 of 319 from the top, Honeywell #53, P&G #12, and Pepsi #68. Loews wasn’t in our database. While these stocks ranked reasonably high, they were not without volatility.
- Aflac: return: 14.07%, annualized volatility 20.14%, maximum volatility 164%
- Honeywell: return 16.34%, annualized volatility 19.26%, maximum volatility 117%
- P&G: return 12.98%, annualized volatility 15.24%, maximum volatility 95.2%
- Pepsi-Cola: return 12.78%, annualized volatility 14.69%, maximum volatility 110%
The annualized volatility is the standard measurement used by the financial industry. It is based on the past 20 days, then extrapolated to a full year. That is why it can be greater than 100%. To see a picture of what a “low-volatility stock” looks like, Figure 2 shows the history of annualized volatility for Aflac. It does seem to have low volatility with one, or maybe two exceptions. Other stocks look similar.
Figure 2. Aflac (AFL) annualized volatility (Data source: CSI)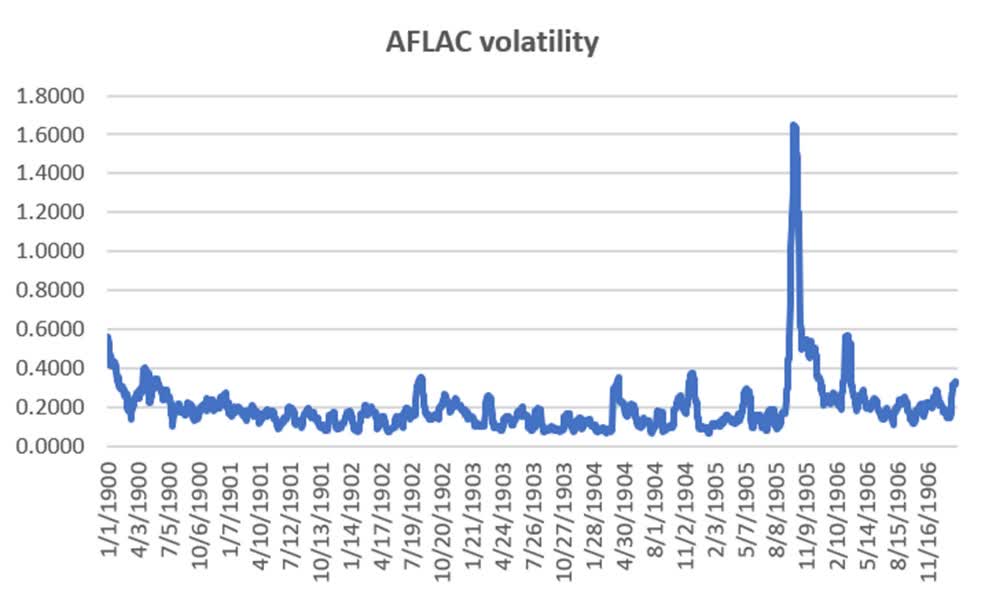
Can we call it a low-volatility stock if it goes to 120%? Does one exception count? (Yes) Would diversification help? (Maybe) But the stocks identified as low risk seem to have the volatility spikes at the same time. Figure 3 shows the volatility of Honeywell. It is remarkably similar to Aflac.
Figure 3. Honeywell (HON) annualized volatility (Data source: CSI)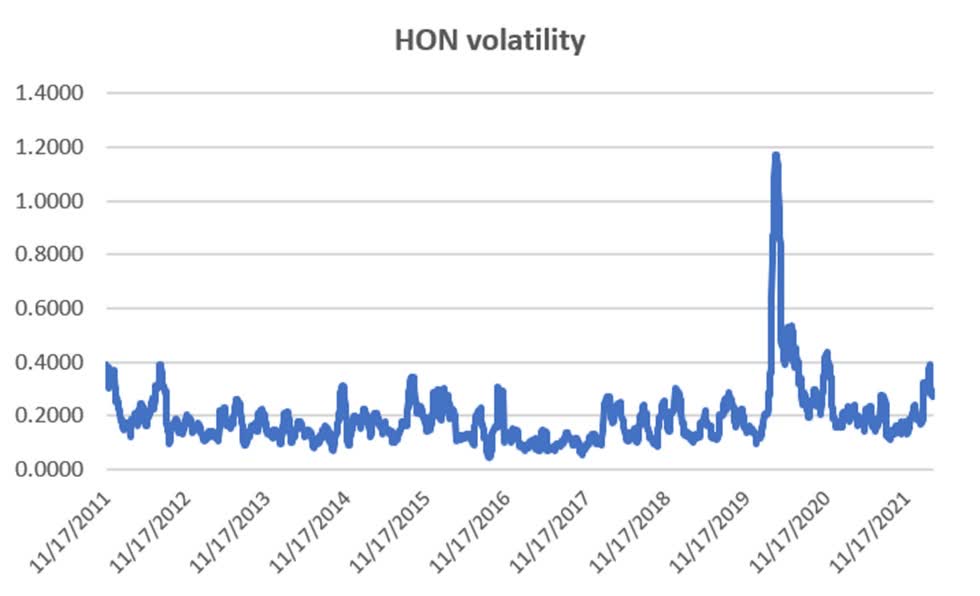
A Solution for Those Valuing Low Volatility
We have already found the stocks with the best return to risk ratio. But that is in the past. There is no way of knowing if there will be a spike similar to Aflac and Honeywell.
A simple calculation can fix that, but it requires that you keep on eye on market volatility. In general, any stock that posts a volatility over 30% should be exited, then reentered when the volatility drops below 30%. Volatility is measured as the standard deviation of the returns of the past 20 days times the square root of 252. It’s an easy calculation on a spreadsheet and you don’t need to do it unless you see that the volatility is increasing.
It won’t take long for you to get a feel for when to do this. You can download your stock data from Yahoo Finance as a spreadsheet and to the calculation. The charts of Aflac and Honeywell were done that way. Even easier, you can enter “AFL volatility” into your browser and it will give you the implied volatility. That is generally higher than actual volatility, but could still work.
Reducing the Volatility of Any Stock
You can always reduce the volatility of any market by trading a smaller position, but that’s not what we want to do. We want a stock that has a good return and, with a simple rule, reduce its volatility.
Each stock has its own volatility personality, but we are looking for a single value that will reduce risk for most stocks. Our rules will be:
- Hold the stock while the 20-day volatility is below 30%
- Exit when the volatility moves above 30%
- Reenter when the volatility falls below 30%
Table 3 shows how this simple method compared to the buy-and-hold returns. The Payout Ratio in the right two columns shows the improvement, which is substantial. If you want even a greater improvement, you could use different volatility thresholds. The “ideal” would be AFL (031), HON (0.43), PG (0.28), PEP (0.27), and L (0.62).
Table 3. Improving results using a volatility threshold (Data source: CSI)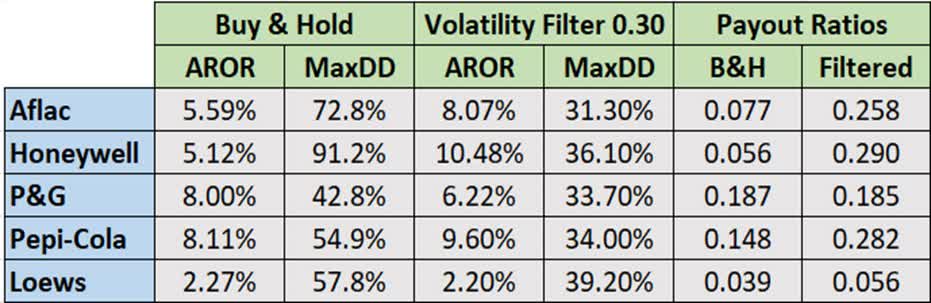
Notice that these stocks all have a drawdown greater than 30%, even though the returns are lower than the average stock in the S&P. I would suggest that you apply this simple method to stocks that have a much higher return. You should then be able to get a good return for a much more reasonable risk.
Be the first to comment