

mphillips007
Six weeks after reporting earnings, D.R. Horton (NYSE:DHI) is up 18.5%. This strong performance has helped lead the iShares U.S. Home Construction ETF (ITB), which gained 12.8% over this time. The positive trend also delivered success (so far) for the seasonal trade on home builders. DHI’s earnings are particularly important because PulteGroup (PHM) reported earnings three weeks prior and gave up its 4.3% post-earnings gain within a week. Lennar Corporation (LEN) reported earnings over a month after DHI reported and the stock lost its 3.8% post-earnings gain within two days. Lennar was about as bullish as can be imagined with the current economic backdrop. In other words, DHI has done some heavy lifting for the sector.
It’s the Guidance
D.R. Horton’s guidance provides the core clues to the tailwinds. While economic and monetary conditions are leaning heavily against cyclical and rate-sensitive industries like the housing market, strong guidance can sufficiently reassure analysts to stick by the story. I see three key points of encouragement (quotes from the Seeking Alpha transcript):
- A goal to “generate consolidated revenues in fiscal 2023 that are slightly higher than fiscal 2022.”
- Year-over-year increased cash flow from home building operations.
- A plan to continue repurchasing shares. These buys provide some support to the stock when market negativity over-corrects for the prospects for negative business conditions. In Q4, DHI repurchased 3.6M shares at a cost of $251.7M. The company repurchased 14M shares during 2022 at a total cost of $1.1B.
- Expectations to “aggregate” market share in home building and rental operations. So DHI can make up some ground in a poor business environment by taking from other builders. While this is a company-specific statement, it generally applies to the large, publicly-traded home builders versus the smaller, private builders, and thus supports ITB in general. The chart below from the earnings presentation shows DHI’s strong market position…a slow and consistent increase in share since 1992 accelerated after the pandemic.
D.R. Horton accelerated its market share grab after the pandemic started. (D.R. Horton)
Having said that, the guidance was not wine and roses. Management showed deference to the challenging business conditions by widening quantitative guidance and avoiding specific full-year guidance: “It is too early to know what housing market conditions will be 3 to 6 months from now during the spring selling season, so we are not providing specific guidance for the full year yet. We will reassess each quarter and give more color on our expectations as we can.” Here are the rougher edges which either the market ignored and/or concluded were better than feared (especially at the high end of the ranges). Comparisons to the previous year, use the Q1 2022 earnings report and the Q1 2022 10Q.
- Q1 net sales down 25% to 35% year-over-year, which is a significant deceleration from the 15% year-over-year drop in net sales for Q4.
- Q1 home sales gross margin 23% to 24%, down from 27.4% the year prior.
- Home sales gross margin “will decrease from current levels.” The margin decline represents a significant setback. DHI gross margins broke out in 2019 and steadily marched higher from there.
- Average sales price (ASP) will also decrease from current levels. ASP will fall both from price pressures and from building smaller homes to meet affordability needs: “Now when a price point becomes much more important to the buyers…they go from the 2,300 square foot 2-story down to the 1,600 square foot ranch, which drops the overall ASP of the community without really changing the product or impacting valuations within the community.” DHI did explain that the 4% sequential decline in ASP for Q4 was a “like-for-like” comparison and not from product mix. Instead of base rate cuts, DHI has focused on financial incentives and interest rate assistance to “find the market to drive additional traffic and sales…We are offering mortgage interest rate locks and buydowns and other sales incentives to address affordability concerns and to drive sales traffic to our communities.”
- Q1 consolidated revenue $6.0 to $6.8B, a 4% to 15% year-over-year decline.
- Close 15,000 to 16,500 homes, a 13% to 21% year-over-year decline.
Overall, the guidance picture is lukewarm. Compared to the realities of a recession in the housing market, these numbers are acceptable and reflect the earnings power of a market leader.
D.R. Horton gross margins broke out to all-time highs in late 2021. (Seeking Alpha)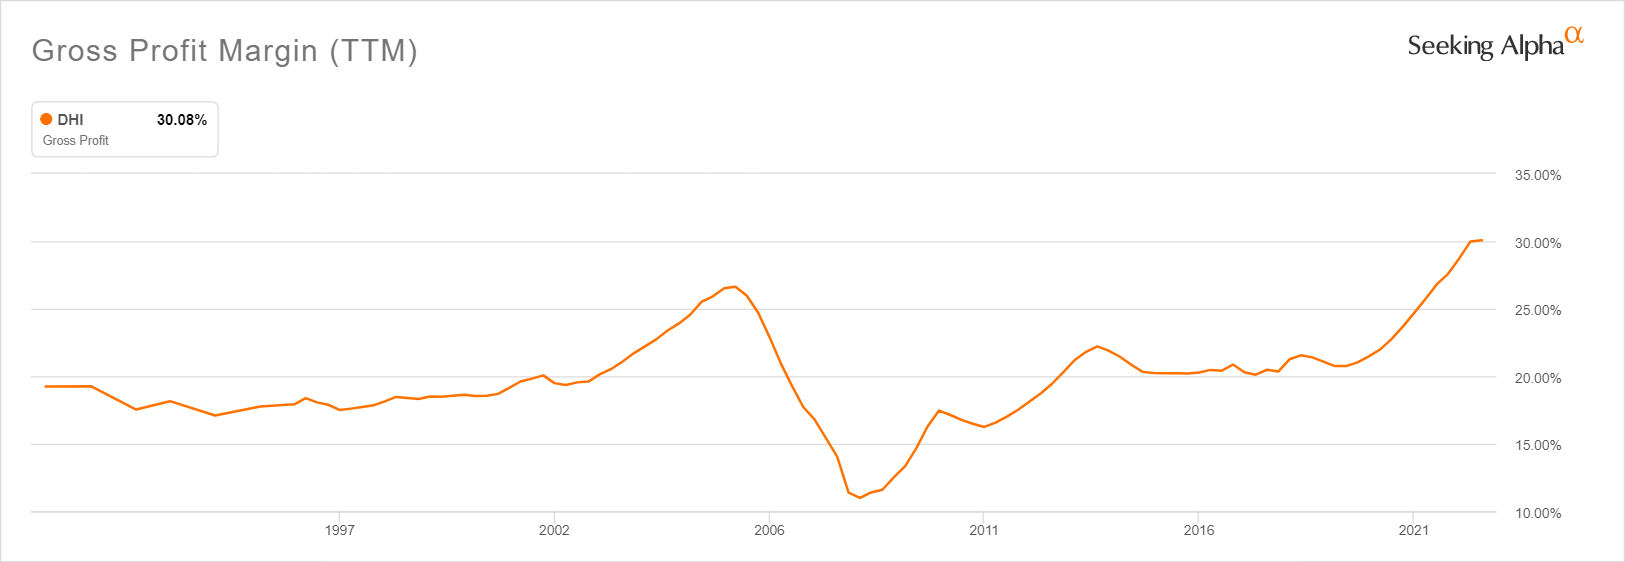
Demand
The rapid rise in mortgage rates caused significant distortions in the typical purchase dynamics in the housing market. Some buyers approved at a given rate suddenly found themselves priced out of a purchase by the time they were able to lock in their rate. This dynamic sent DHI’s cancellation rate soaring from 24% in Q3 to 32% in Q4. The cancellation rate was 19% a year ago. Accordingly, DHI made several adjustments. The company slowed down housing starts to 13,100, a whopping 41.5% reduction from a year ago. Inventory also shrunk from 47,800 a year ago to 46,400 now. This 3% reduction is also an 18% sequential decline. DHI is preparing for a slower Spring selling season.
Home buyers also started to change their buying behavior to reduce their interest rate risk: “we do see in our sales process is that we’re selling the large majority of our homes passed a certain stage of construction, not just from our restriction of that sale, but from the buyer wanting certainty of what that interest rate payment can be within the lock window that can be afforded to them.” Accordingly, DHI further shortened cycle times, assisted by an industry-wide slowdown in starts. The company also held inventory later in the production process so that they “can deliver within the interest rate lock window.”
Rate risks should diminish with the peak in mortgage rates. Indeed, as mortgage rates have fallen from their recent peak, mortgage applications increased 4 out of 6 weeks starting in mid-November. Rate surprises should happen more to the downside than upside going forward. The change in the rate dynamics will provide one small sliver of support for the market for those who can still afford today’s homes.
The 30-Year Fixed Mortgage Rate fell steeply off its mid-November highs. (Freddie Mac, 30-Year Fixed Rate Mortgage Average in the United States [MORTGAGE30US], retrieved from FRED, Federal Reserve Bank of St. Louis)
The Trade
The seasonal trade on home builders takes advantage of a tendency for home builder stocks to outperform the S&P 500 between October/November to April/May. Buying into seasonal October drawdowns in the stock market boosts the chance for success. DHI’s post-earnings performance helped to confirm an October bottom. The company’s guidance holds out the chance that ITB can continue to outperform the S&P 500. Since the end of September, ITB is up 16% while the S&P 500 is only up 7%.
While the best time to initiate these home builder trades has passed, the bearish market environment will likely provide opportunities to buy dips before the trade window closes.
Be careful out there!
Be the first to comment