

Robert Way
By Valuentum Analysts
Pardon the baseball analogy, but boy has Honeywell International (NASDAQ:HON) delivered time and time again over the years. The company has avoided many of the missteps in recent years that have plagued companies like General Electric (GE) or Boeing (BA), for example, and we credit a management that has put together a fantastic team and a deep bench.
Former CEO Dave Cote, who was at the helm of the firm from July 2002 through March 2017, may deserve the most credit, setting up the firm for continued success during the past five years or so. Over Cote’s reign, Honeywell’s market cap grew to $120 billion from $20 billion, which significantly outpaced that of the S&P 500.
We’re just as excited about the potential for current Honeywell CEO Darius Adamczyk and the rest of the Honeywell team in the coming years. They’ve positioned the company for continued success, and while the firm may face challenges as the near-term economic environment remains uncertain, we’re mighty bullish on the company’s long-term prospects.
Honeywell’s Key Investment Considerations
Honeywell operates in four segments: Aerospace, Building Technologies, Performance Materials and Technologies, and Safety and Productivity Solutions. Its aerospace products are used on virtually every aircraft. Honeywell is working to optimize fixed costs in its manufacturing and logistics facilities. The firm was founded in 1920 and is based in New Jersey.
Honeywell generates rock-solid normalized margins through the economic cycle. Its ‘Aerospace,’ ‘Honeywell Building Technologies,’ and ‘Performance Materials and Technology’ segments boast profit margins in the 20s% range.
Honeywell’s outlook has improved significantly of late, aided by its robust order backlog and ample pricing power. Over the long haul, Honeywell expects strength across is major end markets including commercial aviation, defense, and process automation, which will be driven by flight hours growth, robust defense budgets, and warehouse building.
Honeywell increased its long-term financial targets during its 2022 Investor Day event. Now the firm is guiding for ~4%-7% annual organic sales growth and ~40-60 basis points of margin expansion per year over the long haul, with ample growth opportunities across its four core business operating segments.
In addition to its highly-respected brand name, the company’s massive installed base and large services business offer considerable competitive advantages. Its recurring software sales have also been growing at a nice double-digit clip.
Honeywell’s Most Recent Quarterly Report
On October 27, Dividend Growth Newsletter portfolio holding Honeywell reported solid third-quarter performance and provided higher guidance for the full-year 2022. We continue to like the company as an idea in the simulated Dividend Growth Newsletter portfolio, as we expect robust dividend growth in the coming years.
During the third quarter of 2022, Honeywell reported organic sales growth of 9%, pointing to a double-digit pace of expansion in ‘Honeywell Building Technologies,’ ‘Performance Materials and Technologies,’ and ‘Aerospace.’ The firm’s operating margin also advanced 90 basis points higher, to 19.5% thanks primarily to higher levels of profitability in its ‘Safety and Productivity Solutions’ segment. The highlight of the report, however, was adjusted earnings per share, which advanced 11% year-over-year, beating the high end of the company’s guided range by a nickel.
Honeywell’s cash-flow performance remains robust, too. Operating cash flow came in at $2.1 billion, up 86% on a year-over-year basis, while free cash flow came in at $1.9 billion, more than doubling. Though Honeywell’s free cash flow margin may not be as strong as a company like Visa’s (V), for example (see here), its free cash flow margin came in at 21.2% in the quarter thanks to better cash conversion in its working capital. The percentage is very respectable, especially for an industrial giant that has higher capital spending requirements than other asset-light entities.
Importantly, management noted that it ended the third quarter with $29.1 billion in backlog, up 9% year-over-year. Here’s what the executive team had to say about the company’s guidance for the remainder of the year:
As a result of the company’s third-quarter performance and management’s outlook for the remainder of the year, full-year sales are now expected to be in the range of $35.4 billion to $35.7 billion, up 6% to 7% organically, or up 8% to 9% excluding the one-point impact of COVID-driven mask sales declines and one-point impact of lost Russian sales. Segment margin expansion is now expected to be in the range of 60 to 80 basis points, including an approximate (30) basis point impact from investments in the Quantinuum business. Adjusted earnings per share is now expected to be in the range of $8.70 to $8.80. Operating cash flow is expected to be in the range of $5.2 billion to $5.6 billion and free cash flow is expected to be $4.7 billion to $5.1 billion.
We continue to expect big things at Honeywell, and we applaud management’s capital allocation decisions. The firm deployed $1.2 billion in the quarter, consisting of $400 million of share repurchases, while raising its dividend for the 13th time in over a dozen consecutive years. Though there may be some clouds on the horizon as it relates to the global economy, Honeywell’s diversified product suite is allowing it to navigate the market incredibly well.
Honeywell’s Cash Flow Valuation Analysis
Cash Flow Valuation Analysis (Image Source: Valuentum)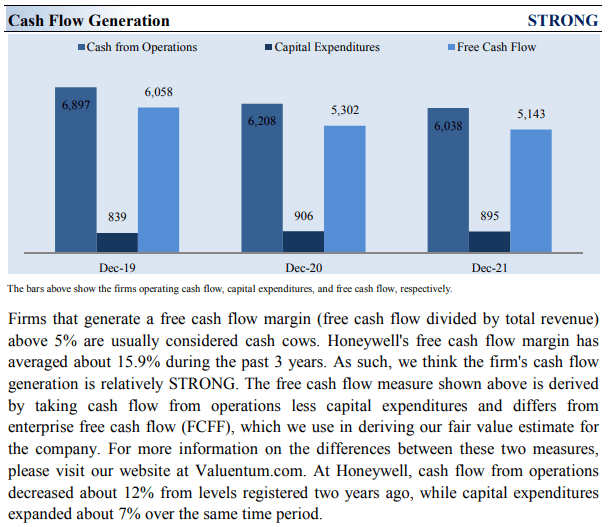
We think Honeywell is worth $187 per share with a fair value range of $150-$224. After a strong run the past week, shares are now trading more toward the higher end of our fair value estimate, but we see upside potential to $220+ on the basis of the high end of our fair value estimate range (which we’ll talk about later).
The margin of safety around our fair value estimate is driven by the firm’s LOW ValueRisk rating, which is derived from an evaluation of the historical volatility of key valuation drivers and a future assessment of them. Honeywell is a cyclical entity, but we generally like to focus on normalized assumptions within our valuation process.
Our near-term operating forecasts, including revenue and earnings, do not differ much from consensus estimates or management guidance. Our model reflects a compound annual revenue growth rate of 4.9% during the next five years and a 5-year projected average operating margin of 23.1%, which is above Honeywell’s trailing 3- year average. Beyond year 5, we assume free cash flow will grow at an annual rate of 2.7% for the next 15 years and 3% in perpetuity. For Honeywell, we use an 8.3% weighted average cost of capital to discount future free cash flows.
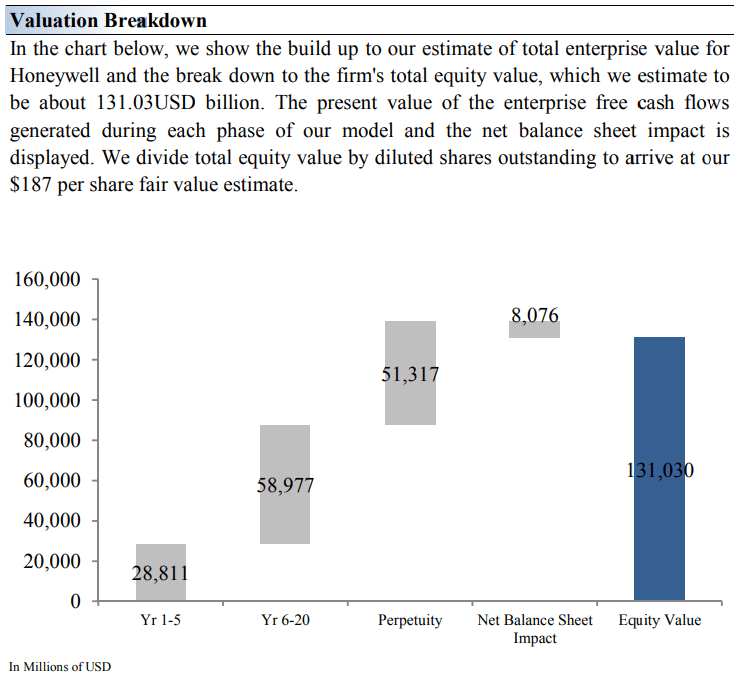
Valuation Assumptions (Image Source: Valuentum) Valuation Breakdown (Image Source: Valuentum)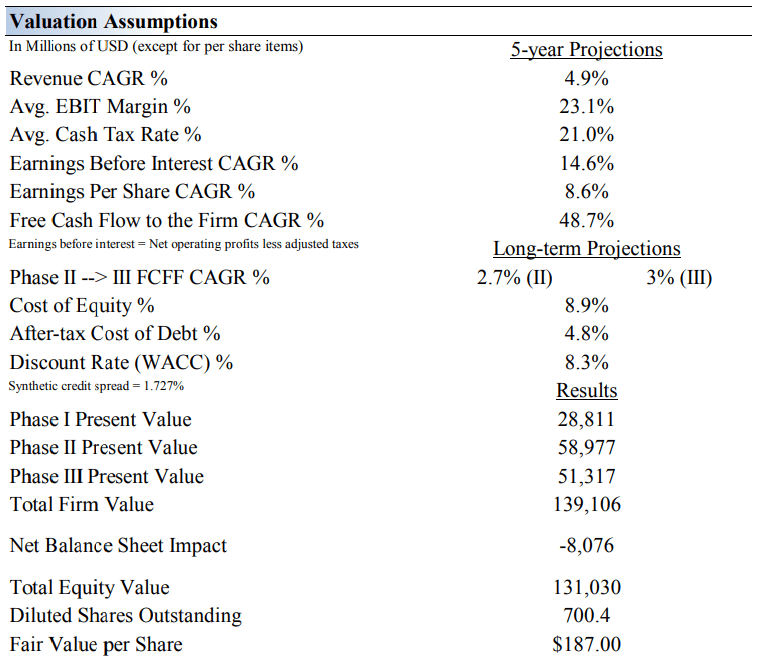
Honeywell’s Margin of Safety
Margin of Safety (Image Source: Valuentum)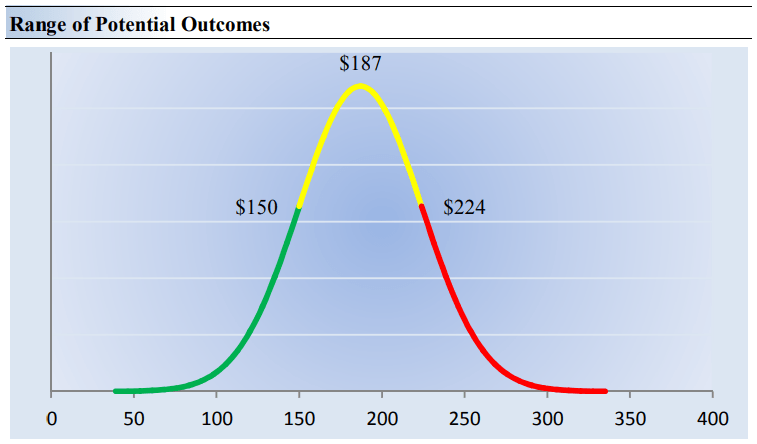
Our discounted cash flow process values each firm on the basis of the present value of all future free cash flows. Although we estimate Honeywell’s fair value at about $187 per share, every company has a range of probable fair values that’s created by the uncertainty of key valuation drivers (like future revenue or earnings, for example). After all, if the future were known with certainty, we wouldn’t see much volatility in the markets as stocks would trade precisely at their known fair values.
Our ValueRisk rating sets the margin of safety or the fair value range we assign to each stock. In the graph above, we show this probable range of fair values for Honeywell. We think the firm is attractive below $150 per share (the green line), but quite expensive above $224 per share (the red line). The prices that fall along the yellow line, which includes our fair value estimate, represent a reasonable valuation for the firm, in our opinion. We think shares could run to the top end of our fair value estimate range ($220+ per share).
Honeywell’s Dividend Health
Dividend Cushion Cash Flow Bridge (Image Source: Valuentum)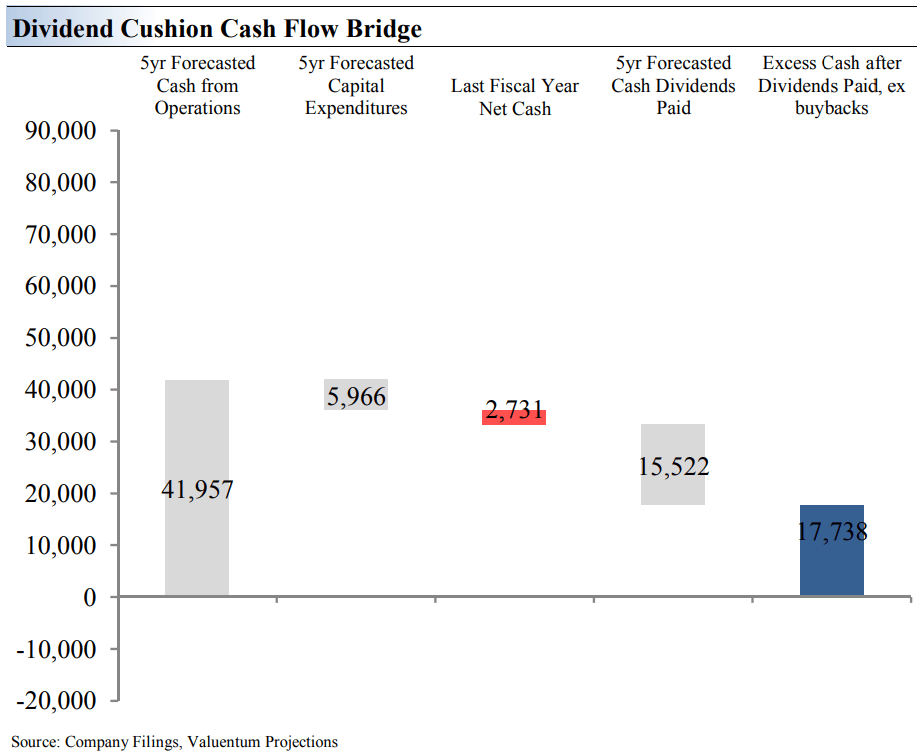
The Dividend Cushion Cash Flow Bridge, shown in the image above, illustrates the components of the Dividend Cushion ratio and highlights in detail the many drivers behind it. Honeywell’s Dividend Cushion Cash Flow Bridge reveals that the sum of the company’s 5-year cumulative free cash flow generation, as measured by cash flow from operations less all capital spending, plus its net cash/debt position on the balance sheet, as of the last fiscal year, is greater than the sum of the next 5 years of expected cash dividends paid.
Because the Dividend Cushion ratio is forward-looking and captures the trajectory of the company’s free cash flow generation and dividend growth, it reveals whether there will be a cash surplus or a cash shortfall at the end of the 5-year period, taking into consideration the leverage on the balance sheet, a key source of risk. On a fundamental basis, we believe companies that have a strong net cash position on the balance sheet and are generating a significant amount of free cash flow are better able to pay and grow their dividend over time. Firms that are buried under a mountain of debt and do not sufficiently cover their dividend with free cash flow are more at risk of a dividend cut or a suspension of growth, all else equal, in our opinion.
Generally speaking, the greater the ‘blue bar’ to the right is in the positive, the more durable a company’s dividend, and the greater the ‘blue bar’ to the right is in the negative, the less durable a company’s dividend. As you can see, Honeywell’s ‘blue bar’ is quite robust and has quite the Dividend Cushion ratio (2.1) at the time of this writing.
The Dividend Cushion ratio is one of the most powerful financial tools an income or dividend growth investor can use in conjunction with qualitative dividend analysis. The ratio is one-of-a-kind in that it is both free-cash-flow based and forward looking. Since its creation in 2012, the Dividend Cushion ratio has forewarned readers of approximately 50 dividend cuts. We estimate its efficacy at ~90%. (Image Source: Valuentum)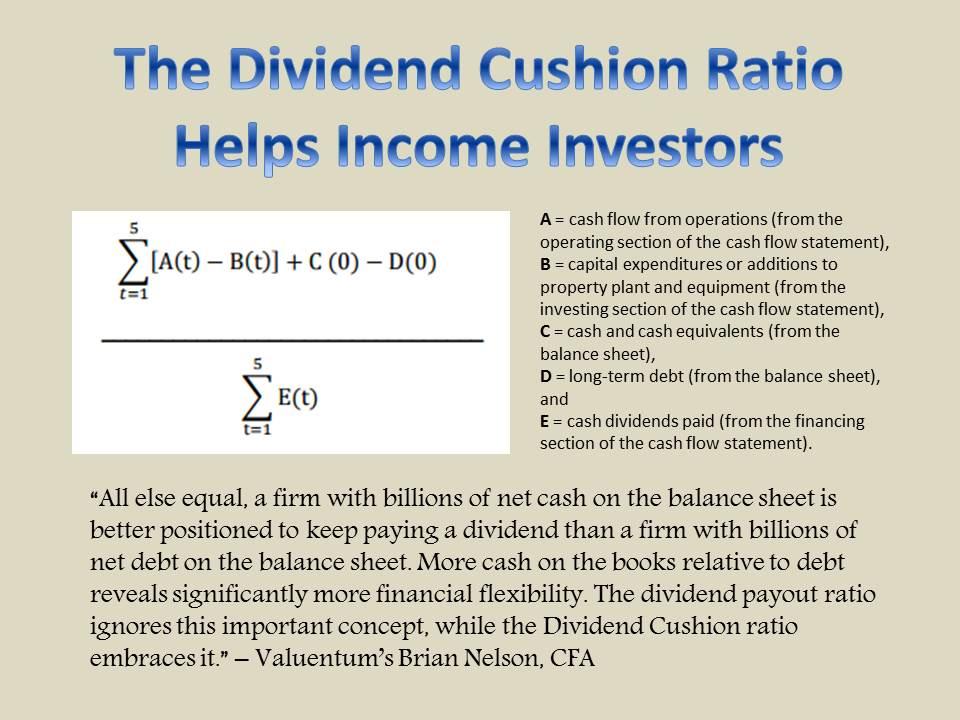
Concluding Thoughts
The first thing that comes to mind with respect to Honeywell’s dividend resiliency is the threat that comes with serving cyclical end markets. Though the company is well-diversified across the industrial economy and commercial aerospace, future downturns are inevitable. Foreign exchange headwinds are a potential concern, though Honeywell remains a solid free cash flow generator. Competing capital allocation priorities, such as share buybacks and M&A activity, could weigh negatively on the pace of Honeywell’s future dividend growth, but it’s hard to discount the company’s track record.
Honeywell has pushed through annual dividend increases over the past 10+ consecutive years, and we expect that Honeywell will maintain its payout growth trajectory going forward. Management continues to target high ROI capital spending as it pursues key process initiatives and productivity improvements, a healthy combination for ongoing segment margin expansion. We’re huge fans of Honeywell’s robust order backlog and its ample pricing power. The executive team’s ‘growth through acquisitions’ has served the company well in the past. We could see the company’s shares run to the high end of our fair value estimate range, while investors get paid a healthy ~2% dividend yield.
This article or report and any links within are for information purposes only and should not be considered a solicitation to buy or sell any security. Valuentum is not responsible for any errors or omissions or for results obtained from the use of this article and accepts no liability for how readers may choose to utilize the content. Assumptions, opinions, and estimates are based on our judgment as of the date of the article and are subject to change without notice.
Be the first to comment