

sankai
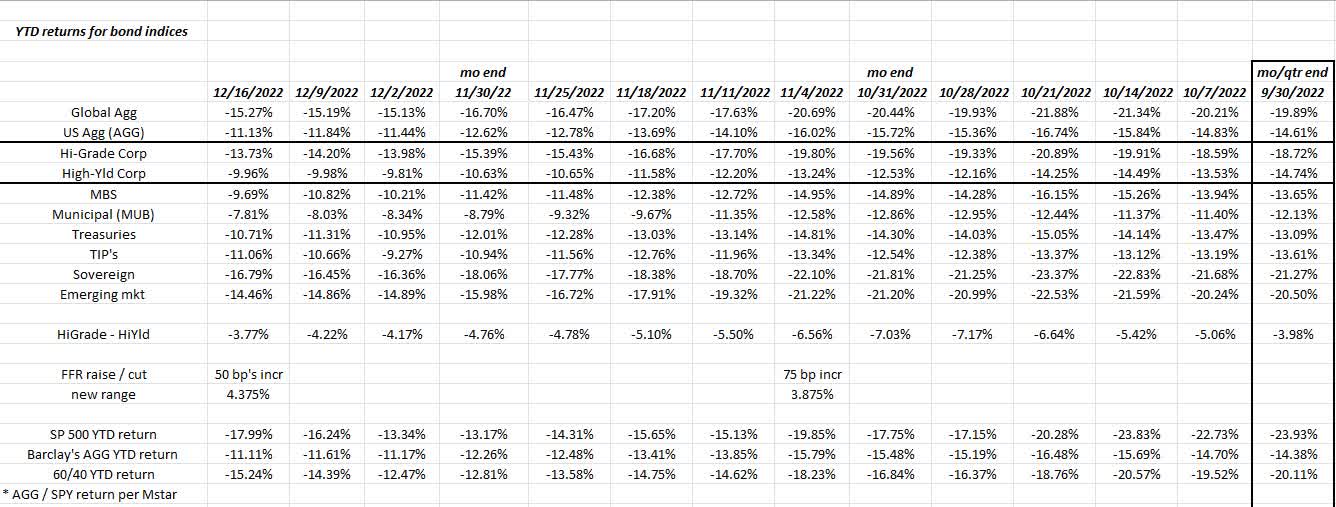
This bond market return data was started in early 2020 during the early stages of the Covid pandemic, and it’s been maintained weekly since, showing YTD returns for various bond market asset classes.
Most of the data is Bloomberg’s but the bottom YTD return data is courtesy of Morningstar.
The interesting thing about last week, after Powell’s heavy-handed press conference and the S&P 500’s 6.5% drop from the post November CPI release rally on Tuesday morning, is that corporate credit, particularly the corporate high yield asset class, performed pretty well on the week, and the YTD return for high yield actually improved this last week.
The bordered areas showing the YTD returns for high-grade corporate versus high-yield corporate bonds, shows YTD returns for high-grade actually worse than high yield , which tells us that “duration” has had a greater effect in 2022 in terms of return attribution, than credit. (Probably no surprise to informed readers.)
Years ago back in the early 1990s, I worked as a fixed-income/credit analyst and got to know an intermediate bond fund manager who I still talk to today. I still try and pick his brain as much as possible since he’s been managing bond money for over 30 years now, and he’s one of the most decent, even-keeled, people you’d meet in this business.
Recently I asked him what the expected default rate would be for corporate high-yield for an “average” recession, i.e. not 2008, not even the banking mess from 1989 to 1993, and he thought 5%- 6% would be an average default rate for the corporate high-yield asset class today.
That response was surprising: I didn’t think it would be that high. Per the Morningstar yield data, on high-yield ETFs like HYG (iShares High Yield Bond ETF) and JNK (SPDR High-Yield Bond ETF), current yields are between 7.5%- 8%, so there has been some marginal cushion built into the high-yield market in the last year after the unusually low credit spreads and Treasury yields from late 2021, but the age-old question is, “Will it ( i.e. a 7.5%-8% current yield) be enough ?”
The other aspect to this topic too is that high-yield credit was an early warning canary in 2008 i.e. spreads started widening in mid-2007 and never really stopped until 2009. At one point corporate high yield credit was yielding 25% in late 2008, early 2009. That was unprecedented and will likely remain so for another 50 years.
Contrast this with this past scary week of stock market action, and really another slew of slower economic data, i.e. the PMI reports and November retail sales, and yet high-yield credit improves.
Bottom line: A credit market that’s not really “flashing red” (or even yellow so to speak) seems to validate the “very shallow” recession theory, or no recession at all theory, but that is probably too optimistic.
A normal high-yield credit allocation to a standard 60%/40% balanced portfolio is 0% to 15% of the 40% bond allocation. Just to be safe, clients have their high-yield credit weighting hedged with the TLT and other interest-rate sensitive instruments.
S&P 500 earnings:
- The forward 4-quarter estimate (FFQE) fell this week to $224.15 from $224.78 last week. The slow erosion in the forward estimate continues. The y/y increase in the current forward estimate is just 3.79% versus the forward estimate of 52 weeks prior.
- The 4-quarter trailing (or trailing twelve-month TTM) S&P 500 EPS of $222.42 is up just 0.78% versus the same estimate 52 weeks prior. The TTM S&P 500 EPS estimate is on the verge of going negative YoY.
- The PE ratio on the forward estimate is 17.2x.
- The S&P 500 earnings yield is 5.82% this week, the highest of the last 5 weeks. The S&P 500 earnings yield was 6% in early November ’22 so the S&P 500 rally in November and the gradual slippage in the FFQE has made it a little tougher to penetrate the 6% EY level.
S&P 500 earnings growth expected to bottom in mid-2023:
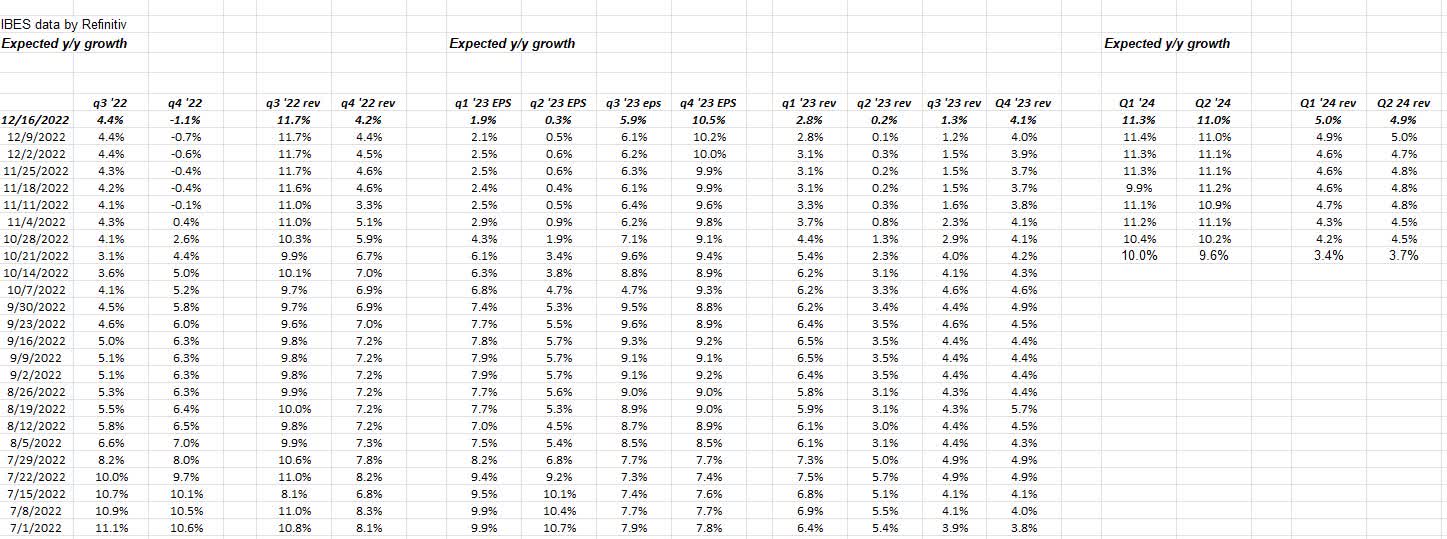
Note how the “expected” quarterly EPS growth rates for the S&P 500 are expected to bottom in mid-2023.
This spreadsheet has been shown on and off the last few weeks and it remains consistent: the next 3 quarters of expected S&P 500 EPS growth will be revolving around no growth and then are expected to accelerate into year-end 2023.
Readers can watch alongside this blog how these numbers change in the next weeks.
We’re still in a post-COVID world, but the influence or impact of COVID distortions on S&P 500 earnings and revenue should be at its lowest point in 2023.
Summary/conclusion: It’s interesting to see the divergence or dichotomy between corporate high yield’s price action and the slow erosion in S&P 500 estimates and the still-deteriorating economic data.
Then we have the AtlantaGDPNow data which is still expecting 3% GDP growth in Q4 ’22.
There are so many mixed messages being seen in the capital markets, it’s really a market where the number of “probabilistic outcomes” seems to be more diverse than at any time in the last 10 years.
For the SP 500, good technicians like @GarySMorrow have critical support at 3,800 on the S&P 500 (SPY) and 1,700 on the S&P 100 (OEF).
Take everything written here with substantial skepticism, and a healthy dose of salt. Past performance is no guarantee of future results, and it may be a while or even never if this information gets updated at all. Capital markets can change very quickly both positively and negatively. Be careful out there.
Thanks for reading.
Editor’s Note: The summary bullets for this article were chosen by Seeking Alpha editors.
Be the first to comment