


Takako Hatayama-Phillips
With its large non-interest-bearing deposit book, Heritage Commerce Corp. (NASDAQ:HTBK) is well positioned for the up-rate cycle. As a result, the company’s earnings will most probably continue to surge through the end of 2023. Robust loan growth will also offer support to the bottom line. Overall, I’m expecting Heritage Commerce to report earnings of $1.05 per share for 2022, up 33%, and $1.28 per share for 2023, up 22% year-over-year. Compared to my last report on the company, I’ve raised my earnings estimates for both years mostly because I’ve increased my loan growth estimates. Next year’s target price suggests a moderately high upside from the current market price. Therefore, I’m maintaining a buy rating on Heritage Commerce.
Margin to Continue to Boost Earnings
Heritage Commerce’s net interest margin grew by 35 basis points in the third quarter and 33 basis points in the second quarter of 2022 thanks to the ongoing up-rate cycle. The company was able to expand its margin by holding its deposit costs down as market interest rates rose. The average deposit cost was 0.13% during the third quarter of 2022, up by just three basis points from the same period last year, as mentioned in the 10-Q filing. Heritage Commerce’s deposit cost is quite sticky because of the large balance of non-interest-bearing deposits, which made up 40% of total deposits at the end of September 2022.
On the other side of the balance sheet, the positioning has worsened. Floating-rate loans dropped to 34% of total loans by the end of September 2022 from 42% at the end of September 2021, as mentioned in the earnings release. Nevertheless, the net interest margin is still positively correlated to interest rates. The results of the management’s interest-rate sensitivity analysis given in the 10-Q filing showed that a 200-basis points hike in interest rates could boost the net interest income by 8.1% over twelve months.
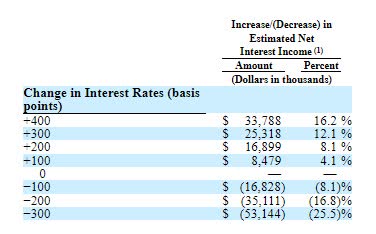
3Q 2022 10-Q Filing
Considering these factors, I’m expecting the margin to grow by ten basis points in the last quarter of 2022 and a further ten basis points in 2023.
Revising Upwards the Loan Growth Estimate
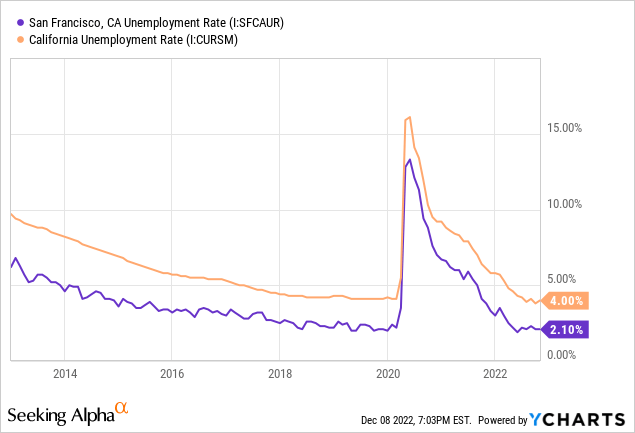
Heritage Commerce’s loan portfolio grew by 4.4% in the third quarter, or 17.5% annualized, which beat my expectations. Going forward, growth will moderate because of the high interest-rate environment. On the other hand, strong local job markets will support loan growth. Heritage Commerce mostly operates in California with a focus on the San Francisco Bay area. As shown in the chart below, the region’s unemployment rate has been near record lows for the last few months.
Furthermore, the state’s economic activity is currently at a healthy level, as shown in the chart below.
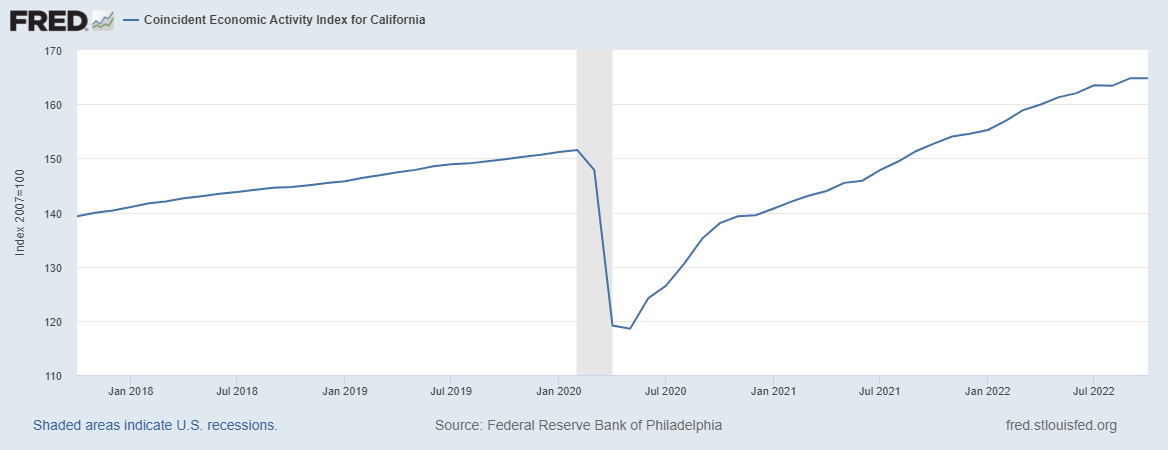
The Federal Reserve Bank of Philadelphia
Considering these factors, I’m expecting the loan portfolio to grow by 1.5% in the last quarter of 2022, taking full-year loan growth to 5.7%. For 2023, I’m expecting the portfolio to grow by 6.1%. Compared to my last report on Heritage Commerce, I’ve increased my loan growth estimate because of the third quarter’s performance which showed that I underestimated the management’s capabilities before. I’m expecting other balance sheet items to grow somewhat in line with loans. The following table shows my balance sheet estimates.
| Financial Position | FY18 | FY19 | FY20 | FY21 | FY22E | FY23E |
| Net Loans | 1,859 | 2,511 | 2,575 | 3,044 | 3,217 | 3,415 |
| Growth of Net Loans | 18.9% | 35.1% | 2.6% | 18.2% | 5.7% | 6.1% |
| Other Earning Assets | 973 | 1,180 | 1,635 | 2,054 | 1,844 | 1,919 |
| Deposits | 2,638 | 3,415 | 3,914 | 4,759 | 4,742 | 4,983 |
| Borrowings and Sub-Debt | 39 | 40 | 40 | 40 | 40 | 42 |
| Common equity | 367 | 577 | 578 | 598 | 610 | 646 |
| Book Value Per Share ($) | 8.7 | 12.0 | 9.6 | 9.9 | 10.0 | 10.6 |
| Tangible BVPS ($) | 6.4 | 8.1 | 6.5 | 6.9 | 7.0 | 7.6 |
| Source: SEC Filings, Earnings Releases, Author’s Estimates(In USD million unless otherwise specified) | ||||||
Provisioning Likely to be Below the Historical Average
After seven consecutive quarters of posting net provision reversals, Heritage Commerce finally reported net provision expense for the quarter that ended September 2022. Following the provisioning, allowances rose to a whopping 4529% of non-performing loans by the end of September 2022 from 1676% at the end of June 2022. The existing reserve level seems excessively high. Therefore, provisioning will likely remain below normal in future quarters despite the threats of a recession and the existing high-inflation environment.
Overall, I’m expecting the net provision expense to make up 0.12% of total loans in 2023, which is below the last five-year average of 0.17%. Compared to my last report on Heritage Commerce, I’ve reduced my provisioning estimate for both the fourth quarter of 2022 and the full year of 2023 because the allowance coverage is now more excessive than before.
Expecting Earnings to Grow by 22% Next Year
The anticipated loan growth and margin expansion will drive earnings through the end of 2023. Further, below-average provisioning will support earnings. Overall, I’m expecting Heritage Commerce to report earnings of $1.05 per share for 2022, up 33% year-over-year. For 2023, I’m expecting earnings to grow by 22% to $1.28 per share. The following table shows my income statement estimates.
| Income Statement | FY18 | FY19 | FY20 | FY21 | FY22E | FY23E |
| Net interest income | 122 | 132 | 142 | 146 | 178 | 211 |
| Provision for loan losses | 7 | 1 | 13 | (3) | 1 | 4 |
| Non-interest income | 10 | 10 | 10 | 10 | 10 | 11 |
| Non-interest expense | 76 | 85 | 90 | 93 | 97 | 111 |
| Net income – Common Sh. | 35 | 40 | 35 | 48 | 64 | 78 |
| EPS – Diluted ($) | 0.84 | 0.84 | 0.59 | 0.79 | 1.05 | 1.28 |
| Source: SEC Filings, Earnings Releases, Author’s Estimates(In USD million unless otherwise specified) | ||||||
In my last report on Heritage Commerce, I estimated earnings of $0.99 per share for 2022 and $1.17 per share for 2023. I’ve increased my earnings estimates mostly because I’ve raised my loan growth estimate. Further, I’ve reduced my provisioning estimate.
My estimates are based on certain macroeconomic assumptions that may not come to pass. Therefore, actual earnings can differ materially from my estimates.
Maintaining a Buy Rating Due to a Moderately-High Price Upside
Heritage Commerce is offering a dividend yield of 3.9% at the current quarterly dividend rate of $0.13 per share. The earnings and dividend estimates suggest a payout ratio of 41% for 2022, which is below the five-year average of 66%. Therefore, there is room for a dividend hike next year. Nevertheless, in order to remain on the safe side, I’m not incorporating a dividend hike in this investment thesis. Heritage Commerce does not change its dividend level regularly.
I’m using the historical price-to-tangible book (“P/TB”) and price-to-earnings (“P/E”) multiples to value Heritage Commerce. The stock has traded at an average P/TB ratio of 1.67 in the past, as shown below.
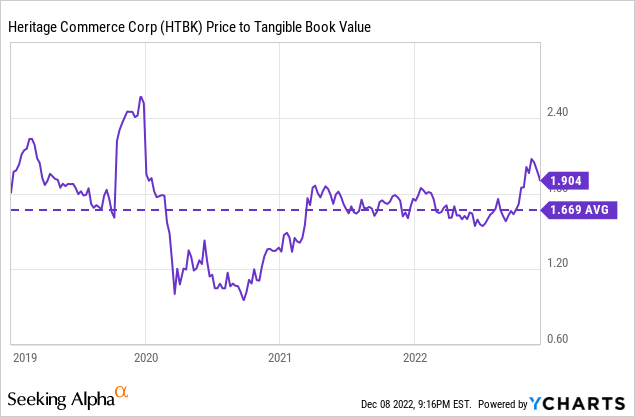
Multiplying the average P/TB multiple with the forecast tangible book value per share of $7.6 gives a target price of $12.7 for the end of 2023. This price target implies a 5.5% downside from the December 8 closing price. The following table shows the sensitivity of the target price to the P/TB ratio.
| P/TB Multiple | 1.47x | 1.57x | 1.67x | 1.77x | 1.87x |
| TBVPS – Dec 2023 ($) | 7.6 | 7.6 | 7.6 | 7.6 | 7.6 |
| Target Price ($) | 11.2 | 12.0 | 12.7 | 13.5 | 14.3 |
| Market Price ($) | 13.5 | 13.5 | 13.5 | 13.5 | 13.5 |
| Upside/(Downside) | (16.9)% | (11.2)% | (5.5)% | 0.1% | 5.8% |
| Source: Author’s Estimates |
The stock has traded at an average P/E ratio of around 13.9x in the past, as shown below.
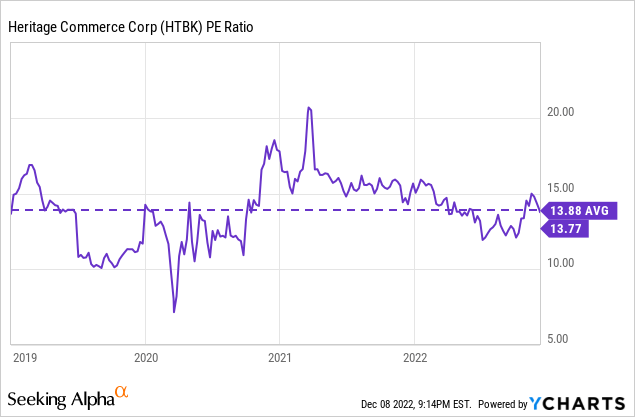
Multiplying the average P/E multiple with the forecast earnings per share of $1.28 gives a target price of $17.7 for the end of 2023. This price target implies a 31.2% upside from the December 8 closing price. The following table shows the sensitivity of the target price to the P/E ratio.
| P/E Multiple | 11.9x | 12.9x | 13.9x | 14.9x | 15.9x |
| EPS – 2023 ($) | 1.28 | 1.28 | 1.28 | 1.28 | 1.28 |
| Target Price ($) | 15.2 | 16.4 | 17.7 | 19.0 | 20.3 |
| Market Price ($) | 13.5 | 13.5 | 13.5 | 13.5 | 13.5 |
| Upside/(Downside) | 12.3% | 21.8% | 31.2% | 40.7% | 50.1% |
| Source: Author’s Estimates |
Equally weighting the target prices from the two valuation methods gives a combined target price of $15.2, which implies a 12.9% upside from the current market price. Adding the forward dividend yield gives a total expected return of 16.7%. Hence, I’m maintaining a buy rating on Heritage Commerce.
Be the first to comment