

hallojulie
Introduction
I haven’t covered Applied Materials (NASDAQ:AMAT) stock before on Seeking Alpha, but I’ve had several requests to do so lately, and I thought this week I would honor those requests.
According to their annual report, Applied Materials is:
A global company with a broad set of capabilities in materials engineering, Applied provides manufacturing equipment, services and software to the semiconductor, display and related industries. With its diverse technology capabilities, Applied delivers products and services that improve device performance, yield and cost. Applied’s customers include manufacturers of semiconductor chips, liquid crystal and organic light-emitting diode OLED displays, and other electronic devices. These customers may use what they manufacture in their own end products or sell the items to other companies for use in advanced electronic components
I have already had a couple of semiconductor-related stocks hit the buy prices I shared in articles ahead of time this downcycle, such as Advanced Micro Devices (AMD) and Micron (MU), and this article will be in a similar format as those. Since I typically aim for pretty cheap prices, I find that readers are usually more receptive to my articles after these sorts of stocks are well off their highs.
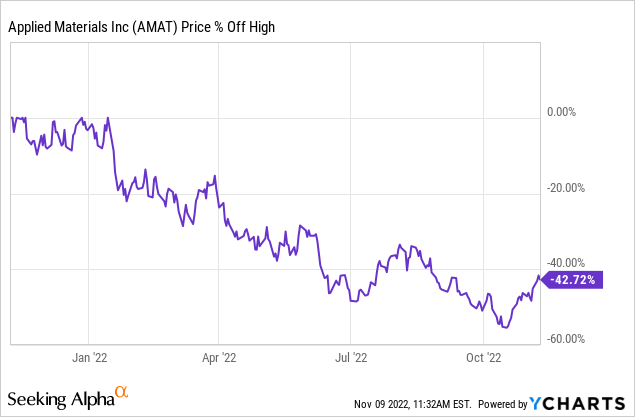
AMAT is currently trading between -40% and -50% off its highs, so now seems like a pretty good time to share my process, and what price I would be looking to buy with a margin of safety.
Applied Materials — Historical Earnings Cyclicality
The first thing I check for every stock I analyze is to see what its historical earnings cyclicality looks like. The reason I do this is that I want to know if this is a stock that fits the profile of a stock I would consider investing in, and I also want to know which strategy and techniques are the most appropriate to analyze the stock in question.
FAST Graphs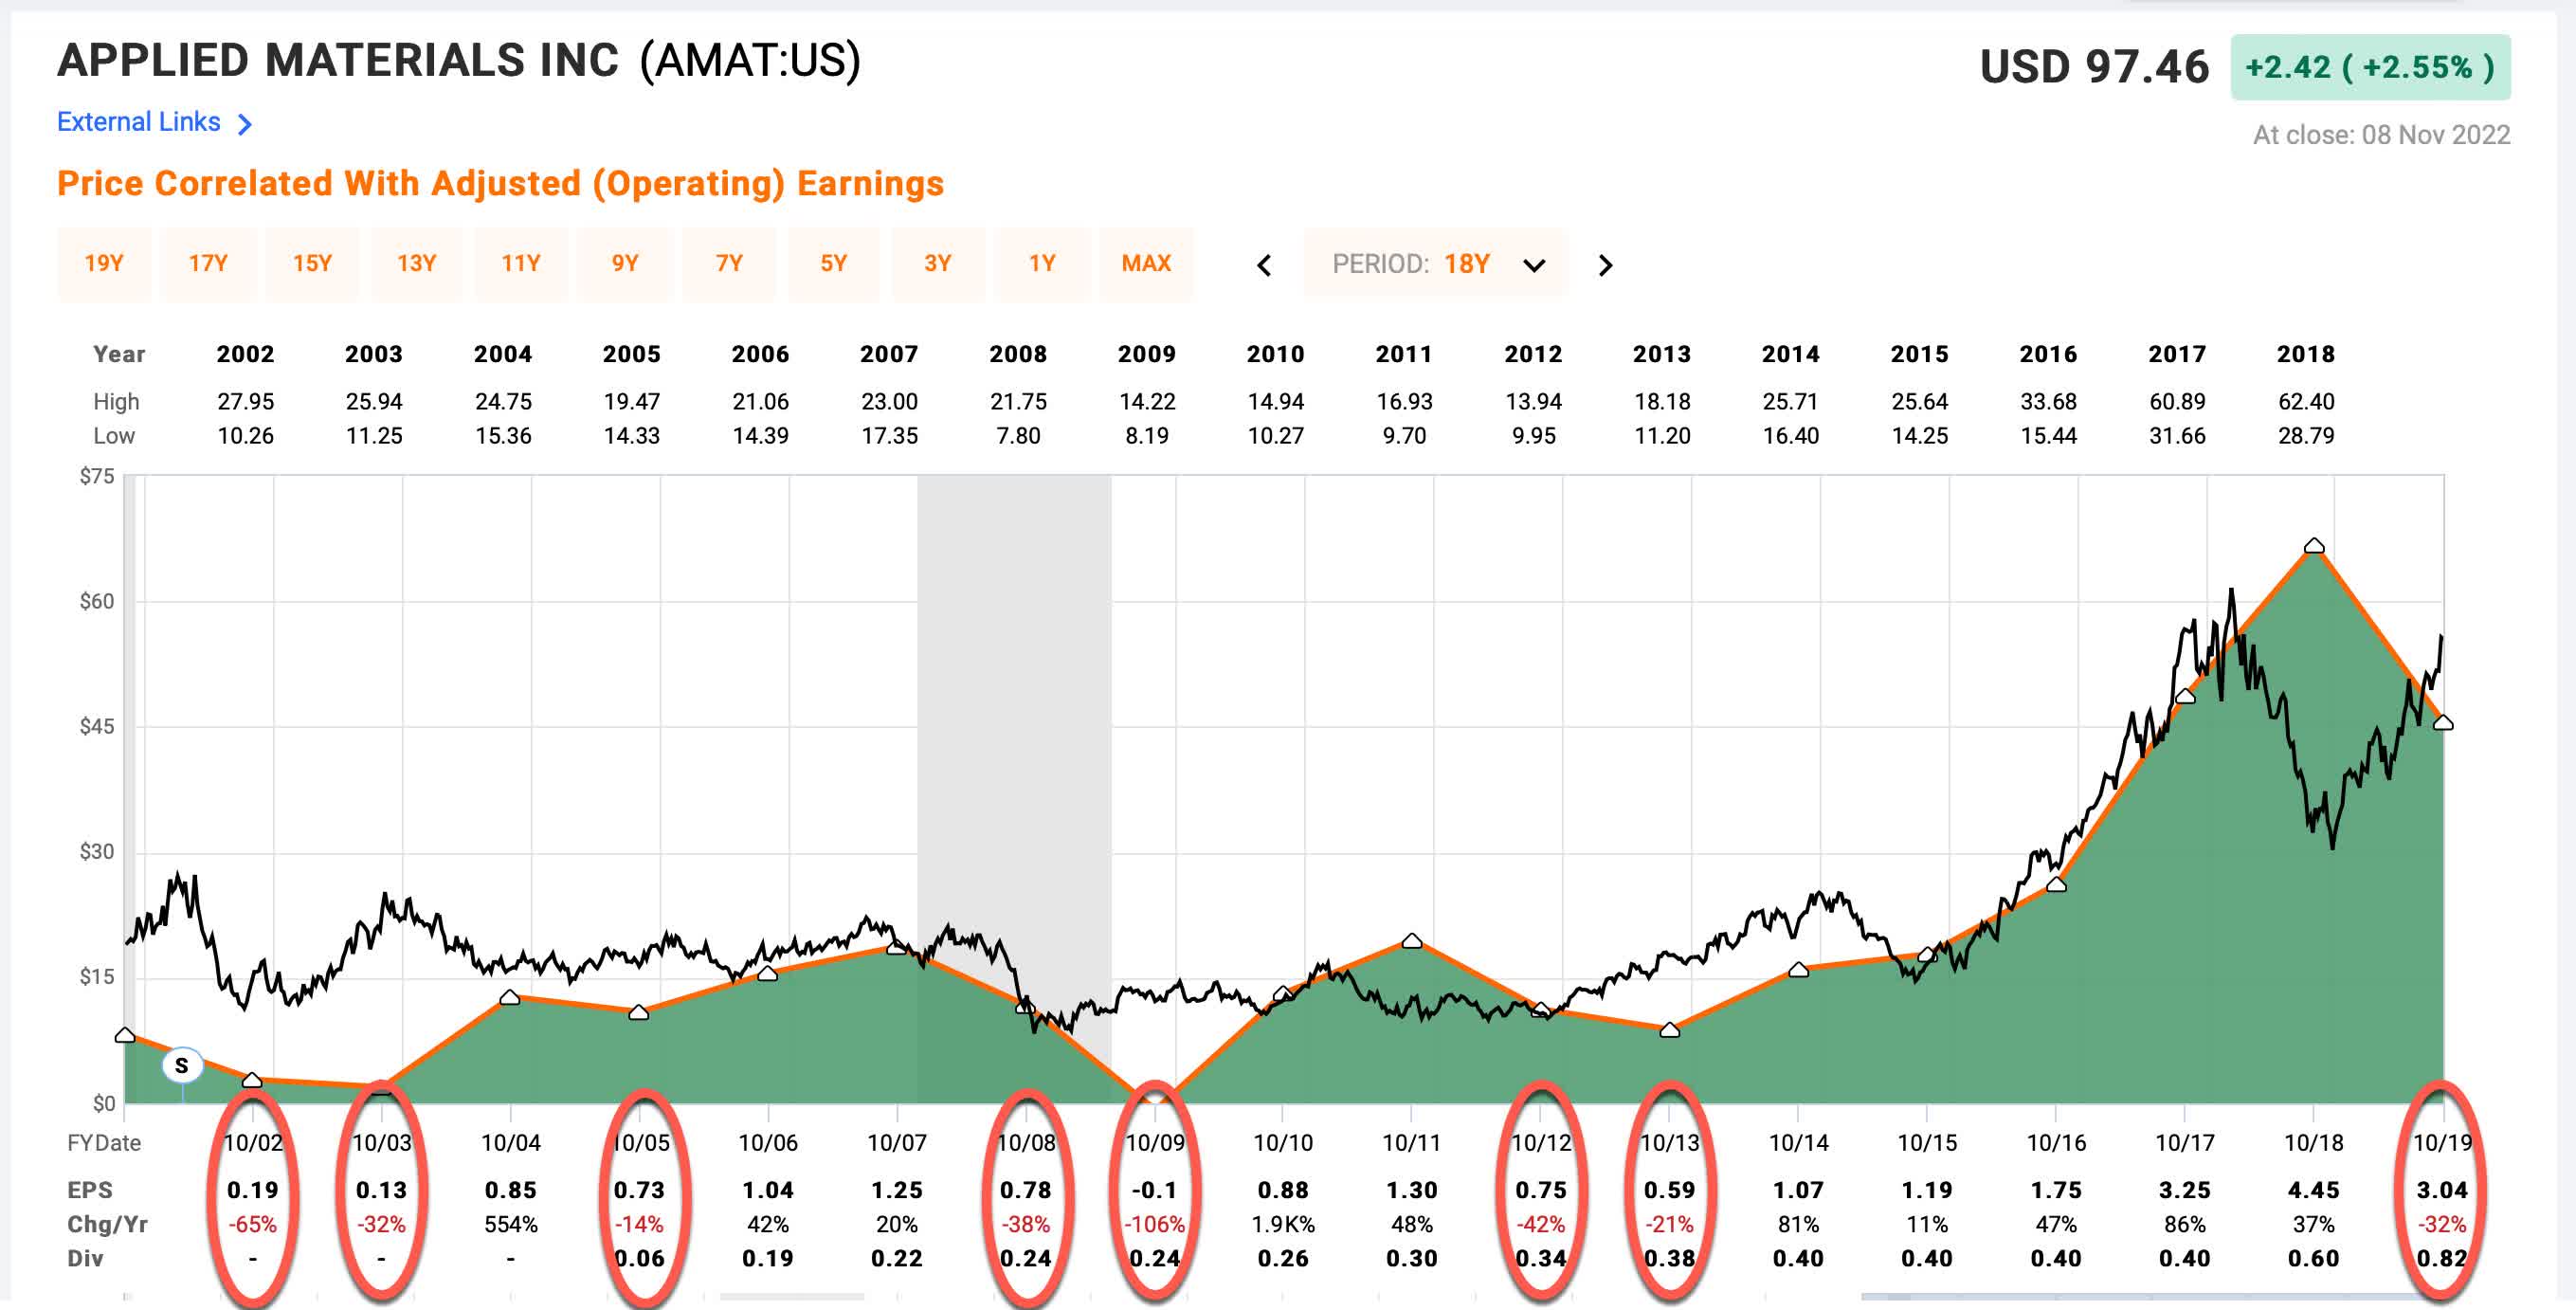
Since 2002, Applied Materials has had 8 years in which EPS declined from the previous year, and the depths of those EPS declines have been quite large, including going fully negative in 2009. The standard threshold I use to categorize a business as a “deep cyclical” is whether EPS typically declines more than -50% off its highs during downturns, and AMAT certainly has a long history of doing just that, so, for me, this is clearly a “deep cyclical” business.
However, importantly, after all of these historical downturns, both AMAT’s price and earnings went on to reach new highs after the downcycle was over. This is enough to label the business as “high quality”. For those reasons, I consider Applied Materials a high-quality, deeply cyclical business, that I would be interested in potentially buying at the right price during a downcycle.
Because AMAT is a very deep cyclical stock, using earnings is not a good way to value the stock. In fact, often when P/Es are low, it is the worst time to buy a stock like AMAT because that usually happens right after a peak, just before earnings collapse. For example, AMAT had a P/E of 14 in January 2008, which isn’t particularly expensive, but the stock went on to fall more than -50% over the next year or so. For that reason, when it comes to businesses with deeply cyclical earnings, I rely on historical price cyclicality to help guide me when it comes to the prices I am willing to buy. Also, because these stocks can be extremely volatile, each position I take is only weighted approximately 1% of my portfolio.
What I will examine in this article is at what price AMAT stock will be cheap enough to buy so that investors have a high probability of producing above-average returns over the medium term of 2-5 years.
AMAT’s Historical Price Cyclicality
Next, I’m going to examine AMAT’s historical price cyclicality in order to help guide a potential purchase price of the stock. While patterns don’t offer a perfect map to the future, they at least offer pretty good guideposts that have a high probability of producing good medium-term returns over the course of 2-5 years.
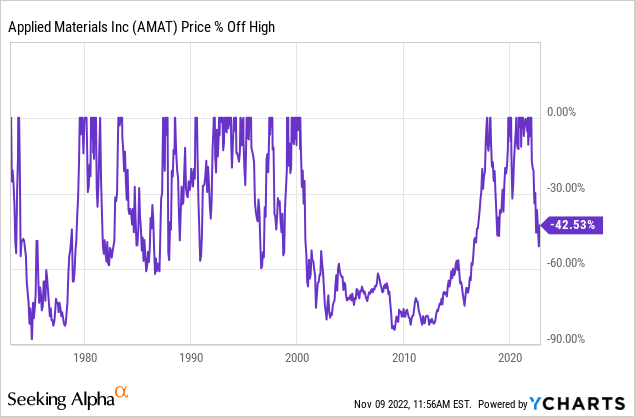
Above we can see that historically, the price has been very deeply cyclical, typically falling between -60% to -85% off its highs before recovering in a timely manner. The one exception from that timely recovery pattern is the year 2000 bubble, which took about 16 years to recover from.
Even though our recent upcycle was very big, I think that we are still in much more of a secular growth trend for the industry since 2015 or so, and the price wasn’t quite as crazy high in 2021 as it was in 2000, so I’m going to post another drawdown chart starting in 2005 so we can see the more recent post-2000-bubble drawdowns.
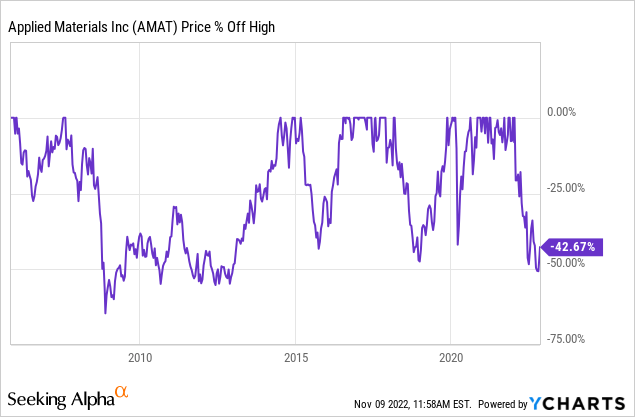
What we see with AMAT’s most recent price patterns is that during non-recessionary down cycles the stock price falls -40% to -50% off its highs. We have three cases in which it did that, 2015, 2018, and 2020. It has already fallen that far during the current cycle.
But during the more serious recession in 2008 and 2009, the price fell about -65% off its 2007 high. Using these recent drawdowns as a guide, I think it’s fair to say we can expect the stock to fall -45% to -65% during downcycles, and if the downcycle occurs at the same time as a recession, it will be closer to the deeper end of the range.
My investing approach for deep cyclicals attempts to find historical patterns and then assume they will roughly repeat. However, I do check several things in order to see if there are obvious signs that this cycle really might be different this time and not repeat. I call these checks “impairment tests” and usually they take the form of questions. In the next section, I will run through this list of tests with AMAT stock.
Impairment Tests
Are revenues this cyclical peak higher than the last one?
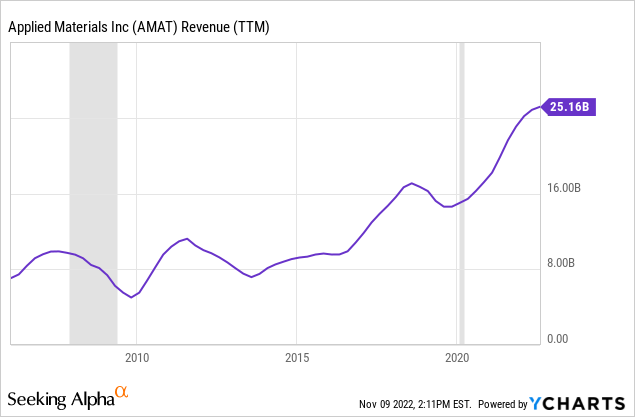
Applied Materials’ revenue is reaching higher and higher peaks with each cycle, including the current one. This is actually exactly what we want to see with a high quality cyclical business.
Could the business have a hidden fatal flaw?
Since, by definition, the fatal flaw in the business model is “hidden” and cannot be easily seen, my test for this is whether the cyclical business in question has experienced two full business cycles because, typically, recessions are where the flaws are exposed, and sometimes businesses can get lucky and avoid trouble in one recession but have the flaw eventually catch up to them during the next. AMAT has found a way to survive for a very long time even when the business was fundamentally weaker, so I’m not really concerned about this.
Is there a clear and disruptive threat to its core business?
I don’t think there is a clear threat to the business that goes beyond normal cyclicality. (But if anyone has one, please share it in the comment section.)
Has AMAT stock experienced a recent super-cycle?
Generally speaking, I think the wider market could certainly have experienced a 2000-like super-cyclical peak at the end of 2021. This can cause a problem for a strategy like mine that measures declines from peak prices because if the peak prices are ridiculously high, then a stock might fall -65% or more off its highs and still not exactly be a good value.
I don’t have a clear way to identify super-cycles. It’s kind of an “I’ll know it when I see it” sort of thing. But my quick way to check is to look at a log-scale version of a long-term historical price chart. Super-cycles tend to show up pretty well on these charts without giving as many false positives as a normal long-term price chart
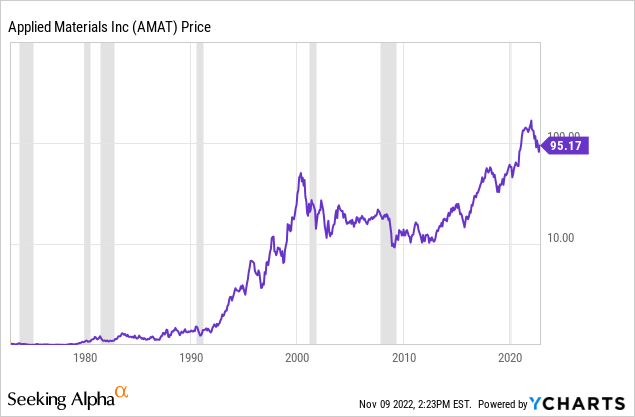
With a less cyclical stock, using the log-version of this chart typically smooths out the very long-term price movements a lot, so the fact that there are very clear cycles in the chart above should let you know this is a very cyclical stock. The periods from 1990 to 2000, which we know was a super-cycle, and the period from about 2014 to 2021 certainly have some similarities. However, the blow-off top from 1998 to 2000 was much steeper and more extreme and also less supported by business fundamentals. So, my interpretation of the current upcycle is that it is certainly part of a very big upcycle, but not as big as the 2000 super cycle. For reference, the initial price drop down from the 2000 peak was around -80%. I don’t expect the stock to fall that far this time around because the fundamentals and secular growth underpinnings are better this time around and the peak was not as extreme.
FAST Graphs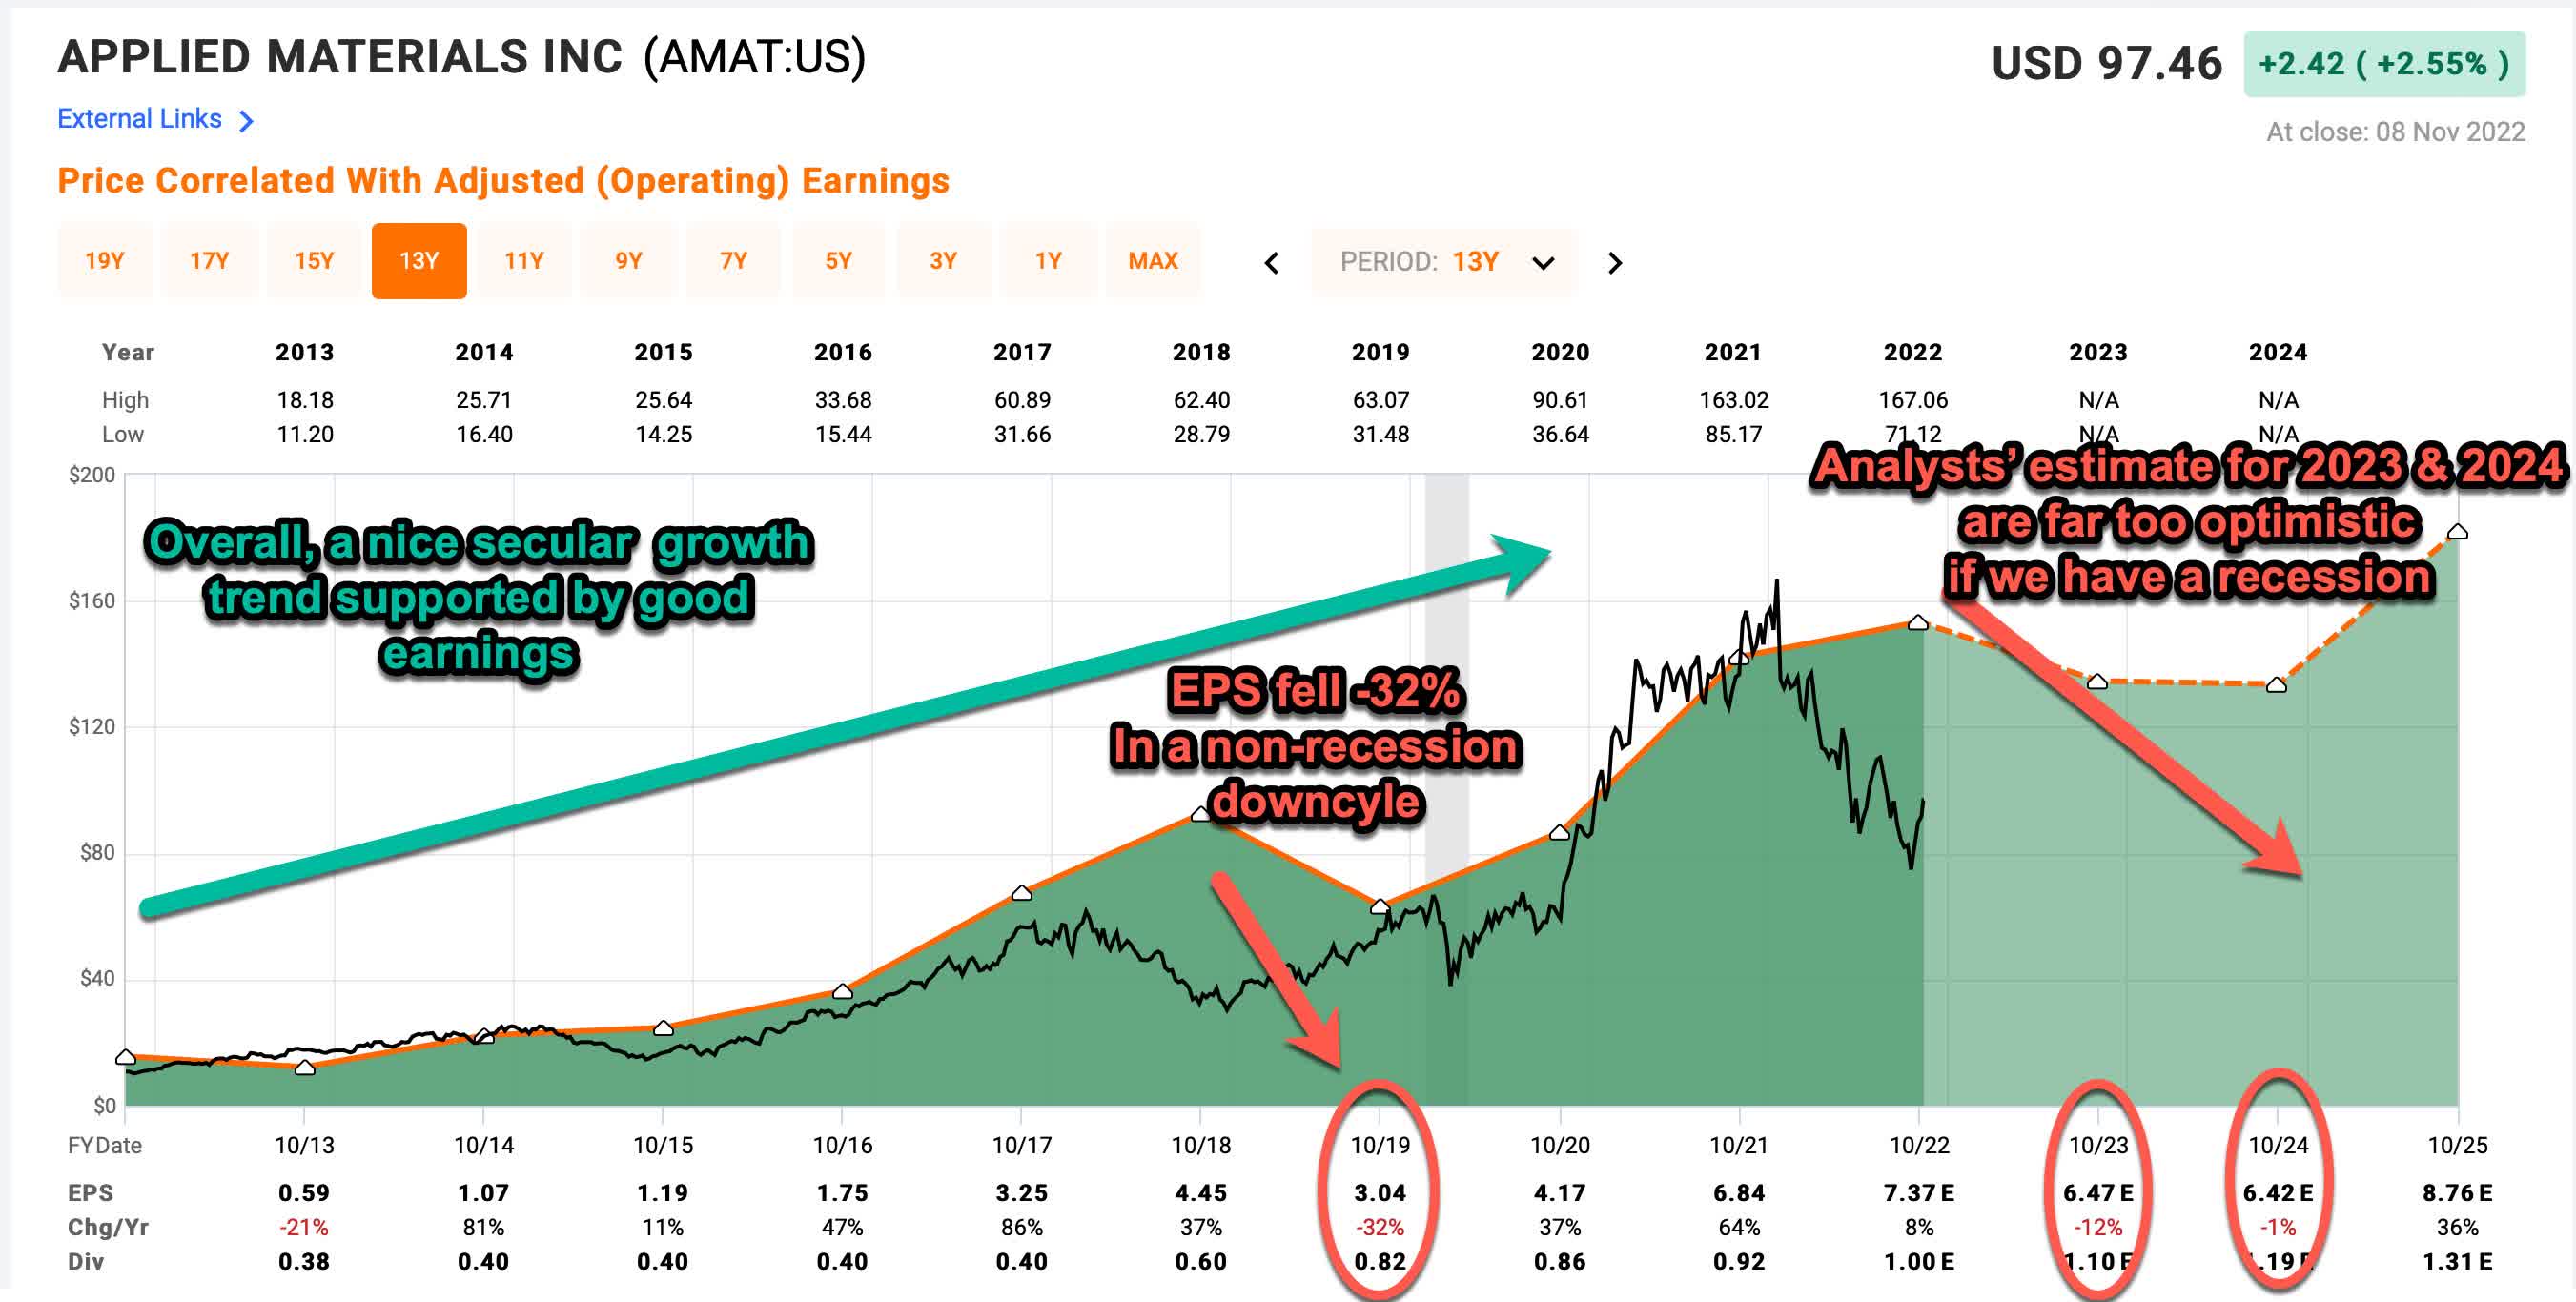
I’ve tried to sum up the cross currents in the chart above. Overall AMAT’s earnings are in a good secular growth trend since 2013. But they fell -32% in 2019 even though we didn’t have an economic recession at the time. Now analysts expect EPS to decline for the next two years. However, those levels of expected declines are nowhere close to what we should expect during an actual recession. Based on history, an expected EPS decline of somewhere around -60% to -80% is a reasonable expectation. (Recall, they fell more than -100% in 2009.)
Putting all this together, if we have a recession in 2023, which is my base case right now, I think we should probably expect AMAT’s price to fall between -65% and -75% off its highs, which would be somewhere between how far it fell in 2000 and 2008/9.
Is management corrupt or incompetent?
I haven’t seen anything to make me think so.
How is the company’s debt-to-equity compared to previous cycles?
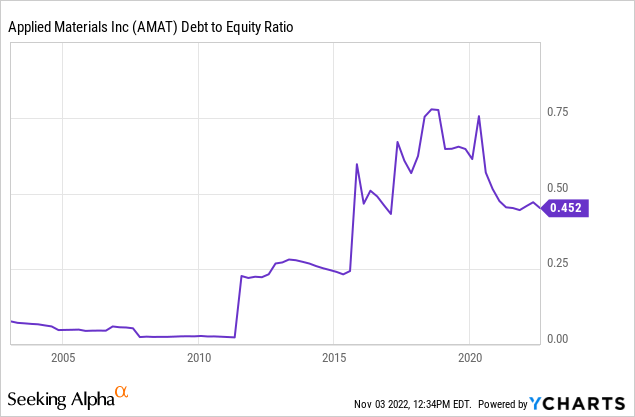
Since one of the assumptions behind this investment approach is that history is likely to roughly repeat, often what I am looking for are reasons that make this cycle different enough that a recovery could be impeded. Sometimes excessive debt can stop or slow a full recovery so I like to compare it to previous cycles. Usually what I look for is 1) is debt-to-equity higher than the last cycle, and 2) is it over 1? In AMAT’s case, debt-to-equity is indeed higher, but it is much lower than 1 and it’s also moving in the right direction. So this isn’t something I would worry about too much and prevent me from buying the stock.
Has the price dropped enough to produce alpha in the past?
Given how the current cycle compares to past deep recessionary cycles, I have set my expected buy price for this stock to buy when it is -65% off its highs. So, what I’m going to do in this section, is to go back and examine what my returns would have looked like compared to the S&P 500 if I would have bought at that point, and held until the stock made a full recovery to new all-time highs again. I’m going to compare to both the 2000 and 2008 downcycles.
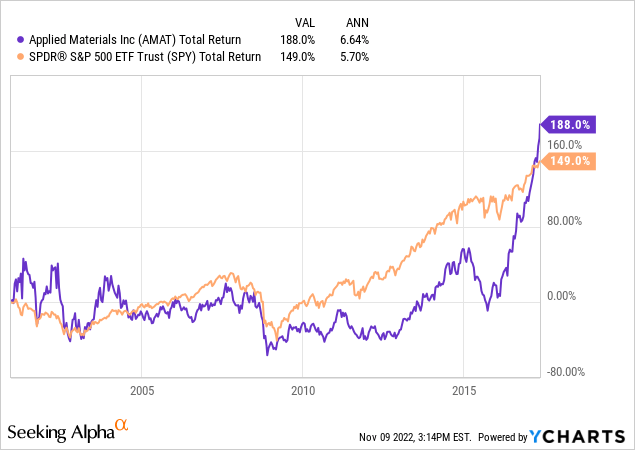
Investors who bought AMAT after a -65% decline from the 2000 super cyclical peak, would have bought on 12/1/2000, and on a total return basis could have earned their 185% return goal in mid-2017. Although AMAT would have underperformed most of this time it actually would have eventually slightly outperformed the S&P 500, but it only would have produced +6.64% annual returns. I prefer these sorts of cyclical investments to recover within 5 years, and for the annualized returns to be 15% at the absolute minimum. So, if you think we just had a 2000-like supercycle, then you might want to aim for a deeper buy price than -65% off the recent highs.
I actually think 2000 was a worse bubble than the one we just had, so I will be still aiming to buy -65% off the highs. Now let’s see how 2008/9 would have turned out.
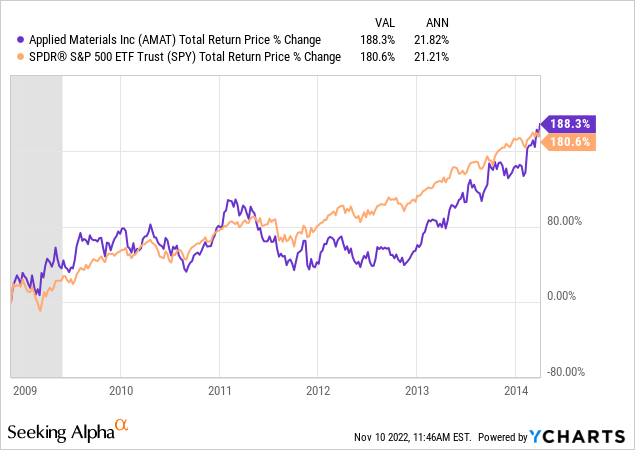
Measuring from the 2007 highs AMAT would have become a buy on 11/20/08 and it would have taken until about April of 2014, or 5.5 years, to recover its pre-recession highs. The stock ultimately would have performed about the same as the S&P 500 over this period but the annual returns would have been over 20%, which is what I prefer to see from an investment like this.
Overall what the historical returns of buying this stock when it is -65% off its highs tells me is that I probably don’t want to buy any sooner than that. Sure, we are in a much better secular bull market now for their products, but we are also coming off a pretty big upcycle. If I am going to buy a deeply cyclical stock like this, I want to be rewarded well for it. I would not feel like the risk/reward was appropriate if I bought sooner than -65% off its highs, even if there is a decent chance it doesn’t fall that far.
Conclusion
Applied Materials’ high price this cycle was $167.06. A -65% discount to this price is $58.47 and if the stock hits that price I will be a buyer. As I’m finishing up this article the stock price has rallied to about $102 per share, so I still need a considerable drop from here for me to buy. I would give the stock about a 50/50 chance of falling that far during the current downcycle. Importantly, my “buy price” is not the same as what analysts call a “price target”. A price target is where analysts think a stock price has a high probability of being in 12 months or so. My buy price is where I think there is enough margin of safety and potential medium-term upside over the next 3-5 years for me to step in and actually buy the stock with my own money. So there is a difference, both in the probability of occurrence, and in the time frame. Though, I do think the odds are decent enough of my buy price hitting in the next 12-18 months, for me to share it in an article so readers can put it on their shopping lists.
Be the first to comment