

8vFanI/iStock via Getty Images
If you’re looking for a high yield investment that will benefit from rising interest rates, you should consider the business development company (“BDC”) industry.
BDC’s offer retail investors high yield exposure to private companies, and some of them, like Hercules Capital, Inc. (NYSE:HTGC) focus on companies which are already backed by venture capital firms. These other firms don’t want to lose their investments, and will continue to support these companies. This has been crucial during the pandemic.
Profile:
HTGC focuses primarily on pre-IPO and M&A, innovative high-growth venture capital backed companies at their expansion (venture growth) and established stages in a broadly diversified variety of technology, life sciences, and sustainable and renewable technology industries.
HTGC site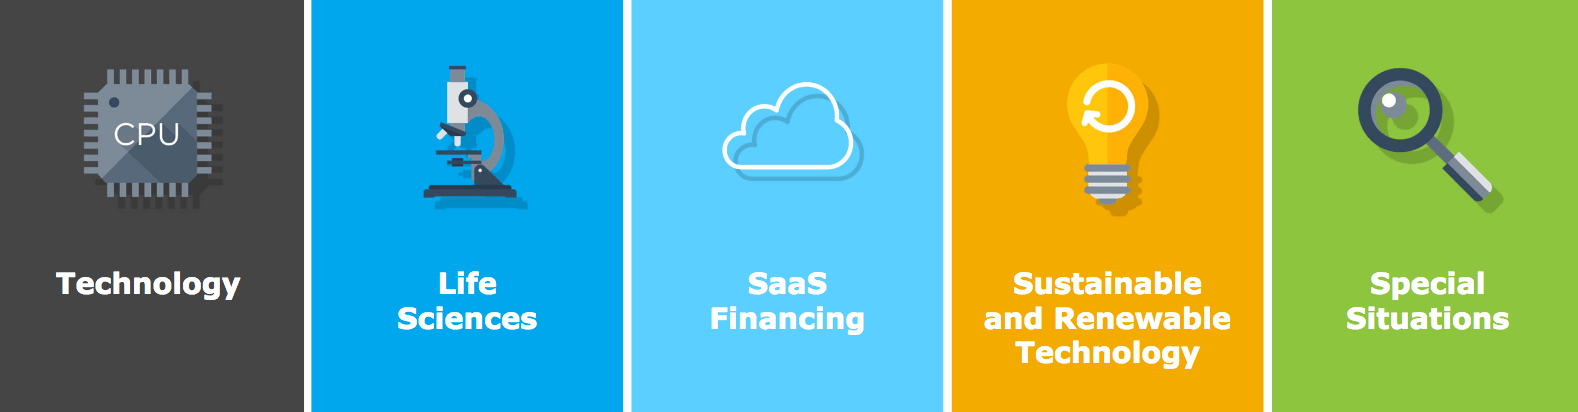
HTGC holds a $2.41B portfolio, with a $2B-plus market cap, and $430M in liquidity.
HTGC site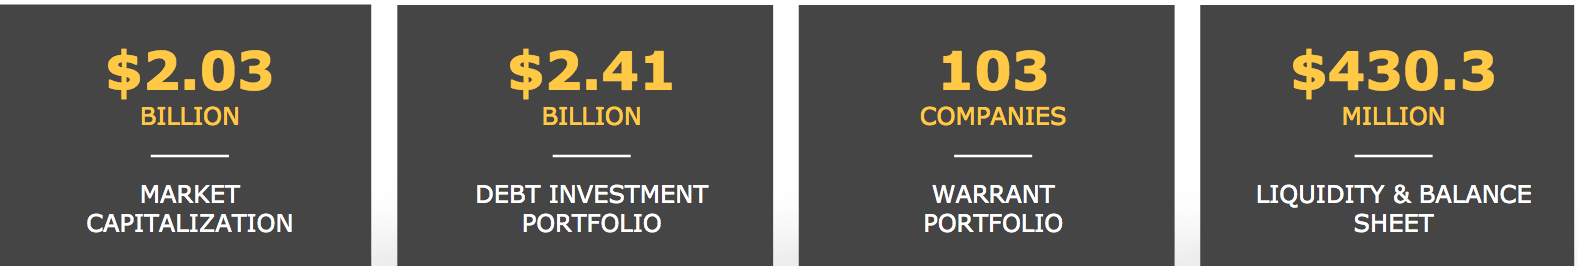
Portfolio:
HTGC’s debt investment portfolio has 94.7% in floating rate loans, with interest rate floors. Its debt investments have short-term amortizing maturities (36-48 months), and the majority of them also have warrants for potential additional total return.
Management estimates that a 100 basis point increase in the prime rate would add $.16/share to HTGC’s EPS, while a 200 basis point increase would add $.35/share. The current prime rate is ~4.38%, vs. 3.25% a year ago.
HTGC site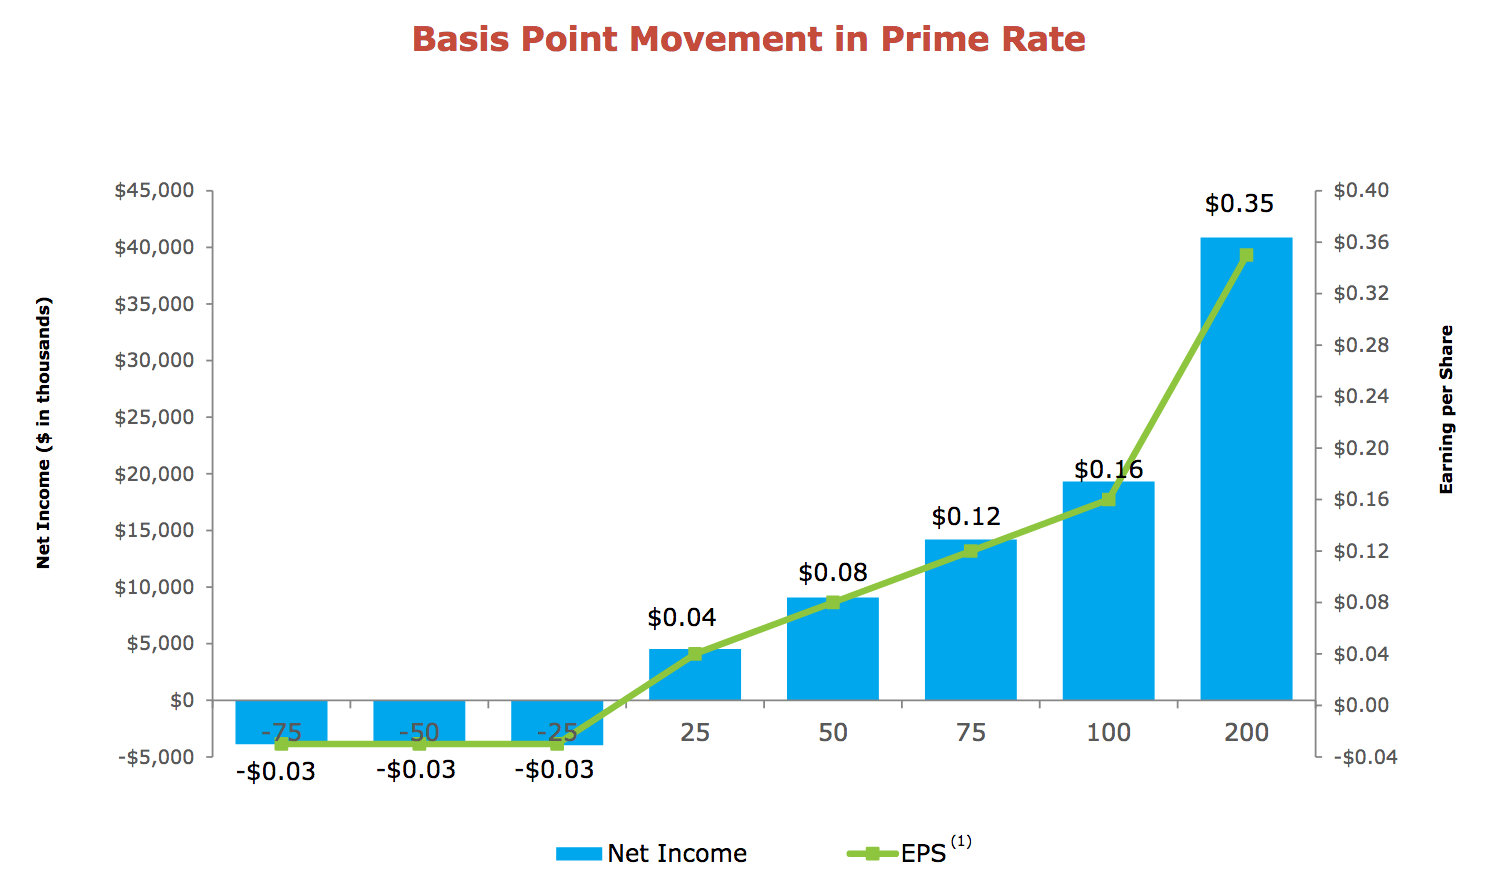
92.2% of the portfolio is in debt investments, 6.2% in equity investments, and 1.5% in warrants:
HTGC site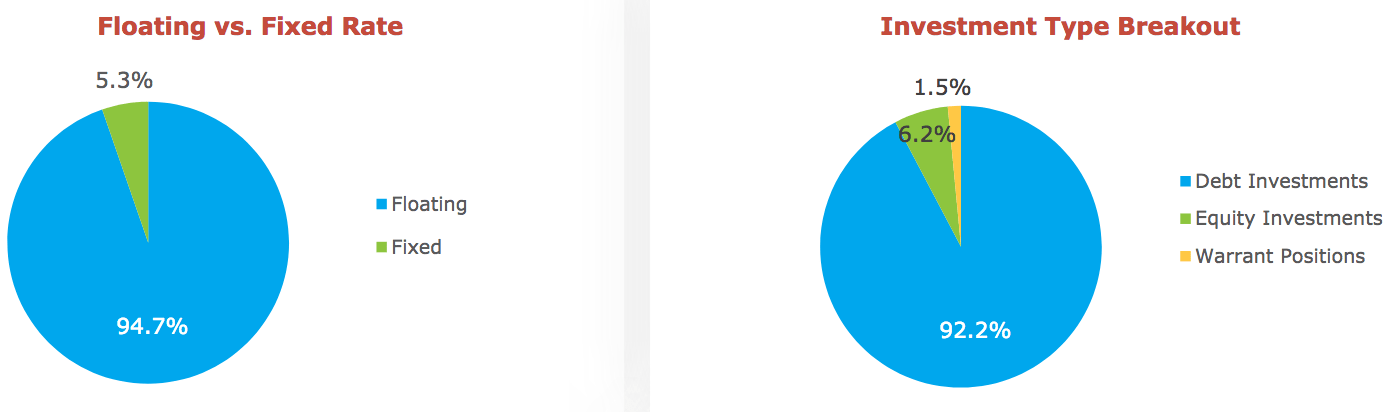
There are 103 warrant holdings, showing an ~25% unrealized gain; and 76 equity holdings, showing an ~11.5% unrealized gain, as of 3/31/22.
Management’s illustration of the potential warrant gains assumes that 50% will be duds, but, even so, the potential gains may run from $.47 to $1.06/share:
HTGC site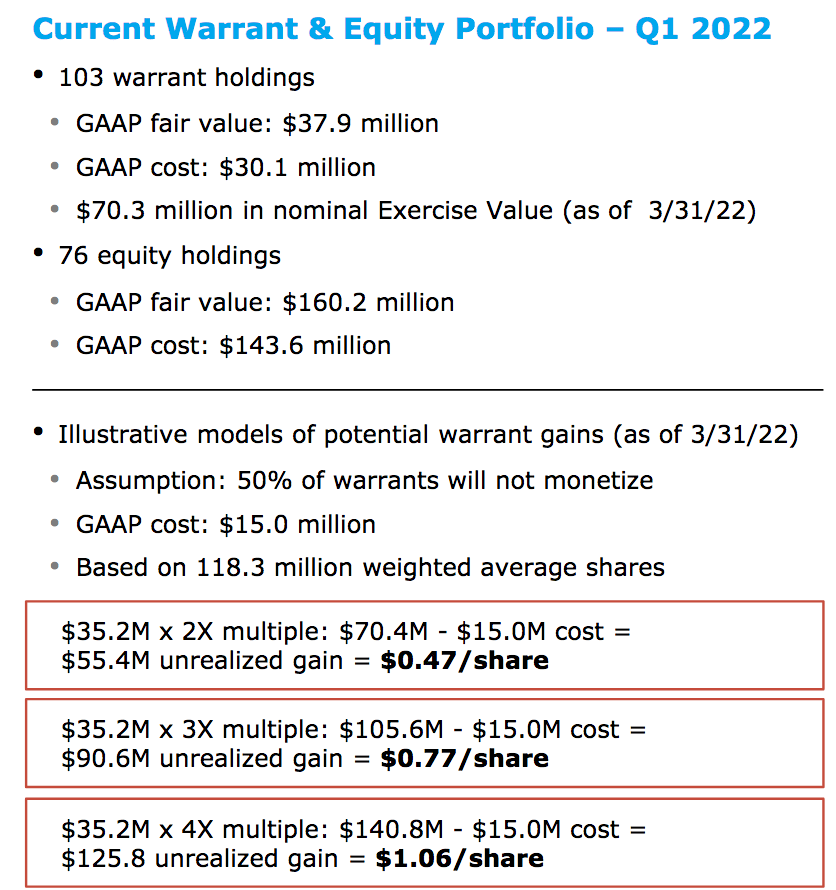
Drug Delivery, Software, and Internet Consumer & Business Services form 81% of the portfolio’s industry exposure, much more concentrated than other BDC’s we’ve covered:
HTGC site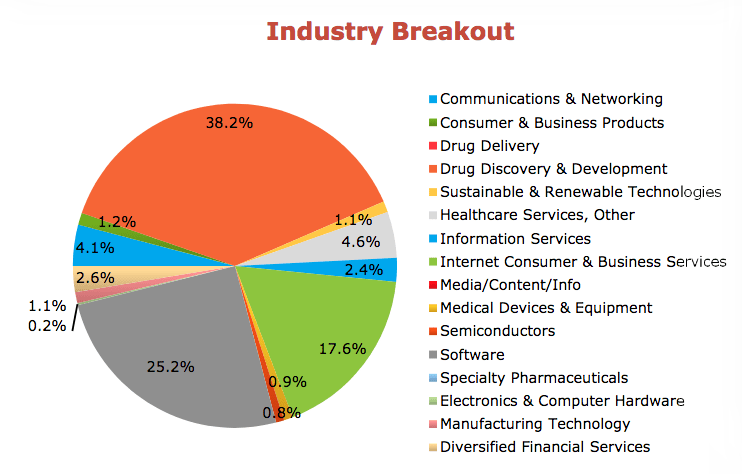
Ratings:
A key factor in volatile times is the quarterly rating of a BDC’s underlying holdings – i.e., the private companies that it lends to. BDC’s management uses a 1 to 5 scale, with 1 being the healthiest grade and 5 being the lowest.
Highest grades 1 & 2 formed 73% of the portfolio, as of 3/31/22, vs. ~80% a year ago, with grade 3 rising from 19.5% to 26.4%. There were no investments rated Grade 5, the lowest tier, in Q1 ’22.
HTGC site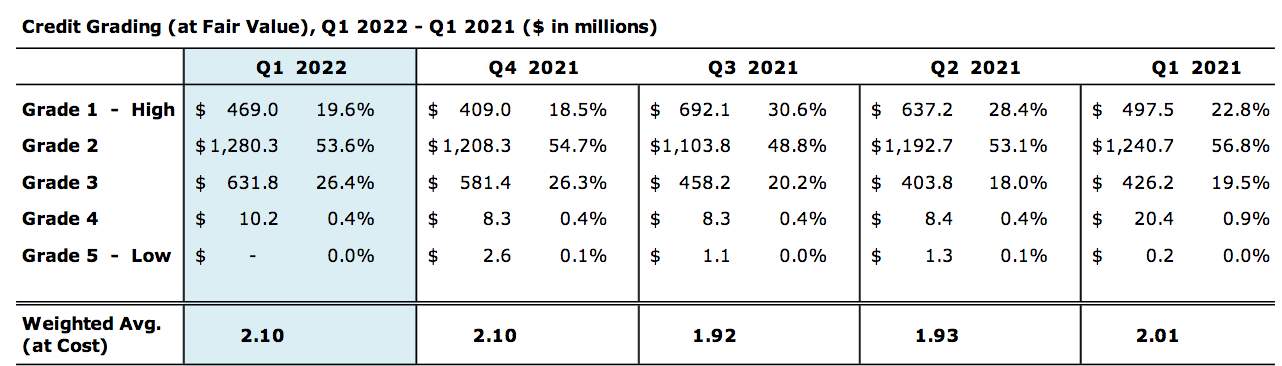
Earnings:
While total Investment Income fell -5% in Q1 ’22, NII rose 3.56% vs. Q1 ’21, due to lower net operating expenses. NII/share was flat, at $.30, and NAV/share was down -4.75%, due to a portion of the distribution coming from previously undistributed assets.
HTGC had a lower weighted average cost of borrowings comprised of interest and fees, of 4.0% in Q1 ’22, vs. 5.5% for Q1 ’21, with interest expense dropping 21%. The decrease is primarily due to the refinancing completed in 2021 and early 2022 and higher utilization of the lower cost SBA loans.
Q1 ’22 Realized gains were -2.38M, due to a non-recurring loss on debt extinguishment of $3.7M.
2021 total investment income fell -2%, with NII falling -4.5%, and NAV/Share ~flat. Interest expense fell -8.7% in 2021:
Hidden Dividend Stocks Plus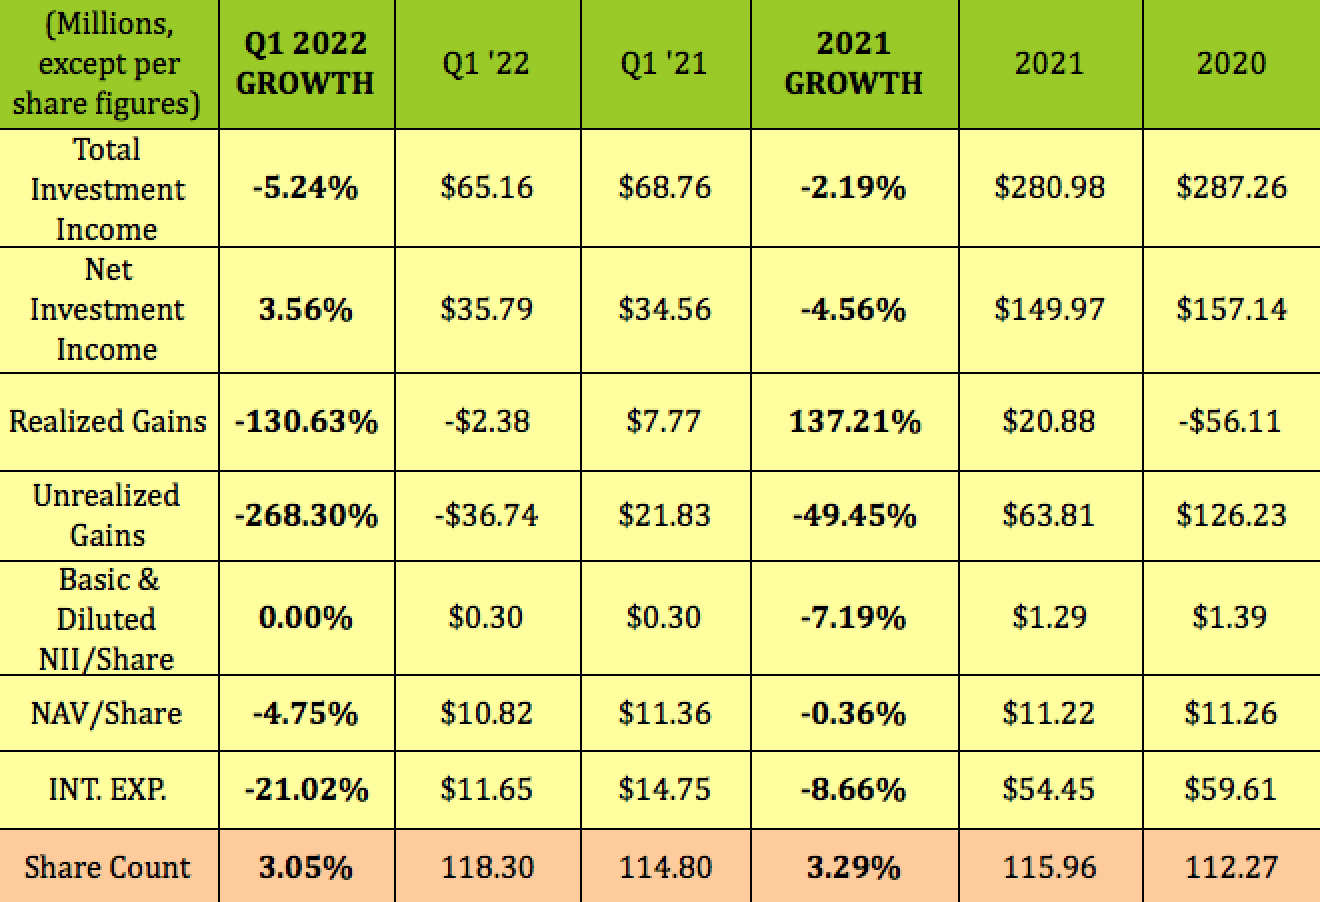
This chart from management shows HTGC having a history of out-sized returns vs. its BDC peers over the past several years:
HTGC site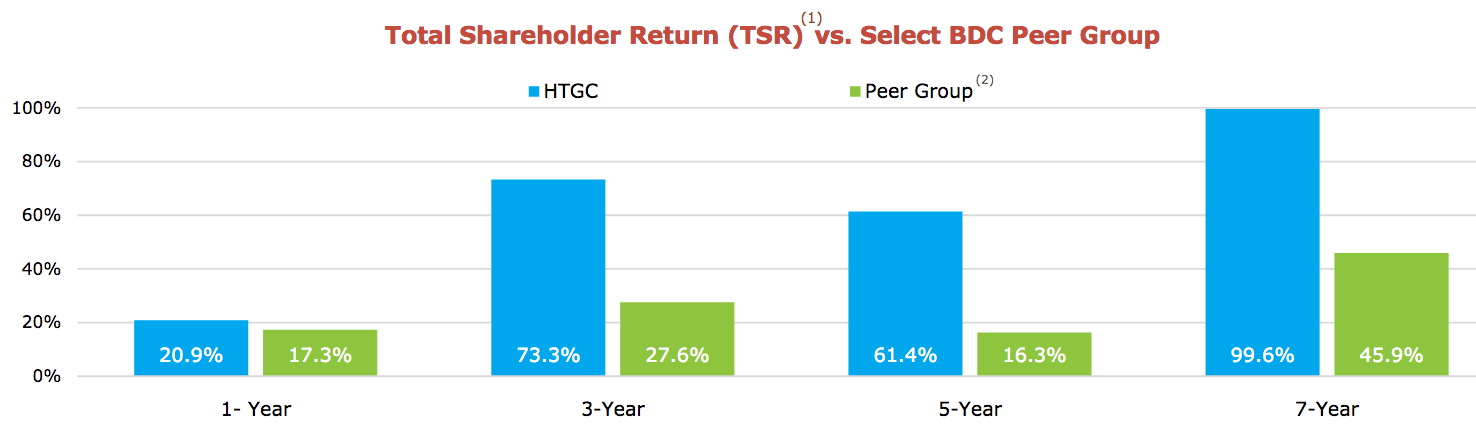
New Business:
HTGC has had 3 companies complete their IPOs so far in 2022, and 5 companies that have registered for their IPOs or have entered into agreements to go public via merger or SPAC transactions.
HTGC had record total gross new debt and equity commitments totaling $615.2M and gross new funding totaling $351.6M in Q1 ’22. This record Q1 originations activity was driven by HTGC’s technology and life sciences teams. HTGC funded capital to 26 different companies in Q1, of which 10 were new borrowers.
Realized early loan repayments were $84.9M, which, along with normal scheduled amortization of $11.3M, resulted in total debt repayments of $96M, which was well below guidance of $150 to $250M, and down vs. $426M in Q4 2021. Although this hampered NII somewhat, it led to a record net debt investment portfolio increase of $190.7M.
HTGC site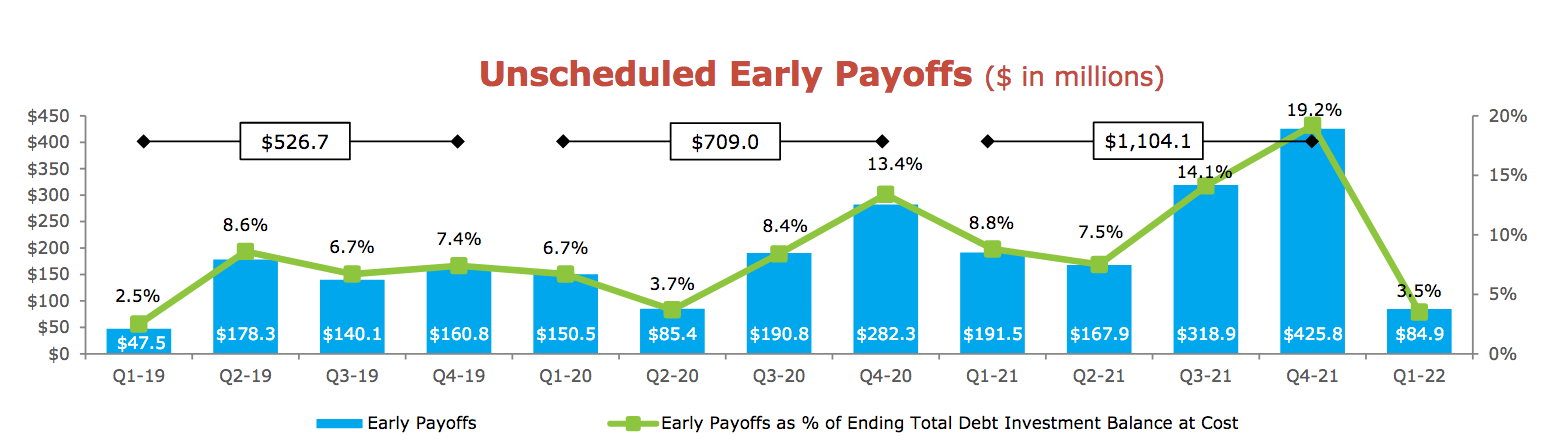
Dividends:
HTGC has a history of paying supplemental distributions, in addition to its base payouts. It has paid $.36 in these extra distributions over the past quarter, with the Q2 amount being $.15.
HTGC’s regular dividends yield 9.82%, while its supplemental dividends yield an additional 4.46%, for a total yield of 14.28%. It should go ex-dividend next on ~8/10/22. Management usually declares the August distribution in late July, so it’ll be awhile before we know if they’ll pay another supplemental payout.
Hidden Dividend Stocks Plus
Coverage for the regular Dividend of $.33 was below 1X in Q1 ’22, at .91X, but has averaged 1X in the trailing 4 quarters. The $.03 shortfall, and the $.15/share supplemental payout were covered by UNII. HTGC had undistributed earnings spillover of over $171 million or $1.39/share, as of 3/31/22.
Hidden Dividend Stocks Plus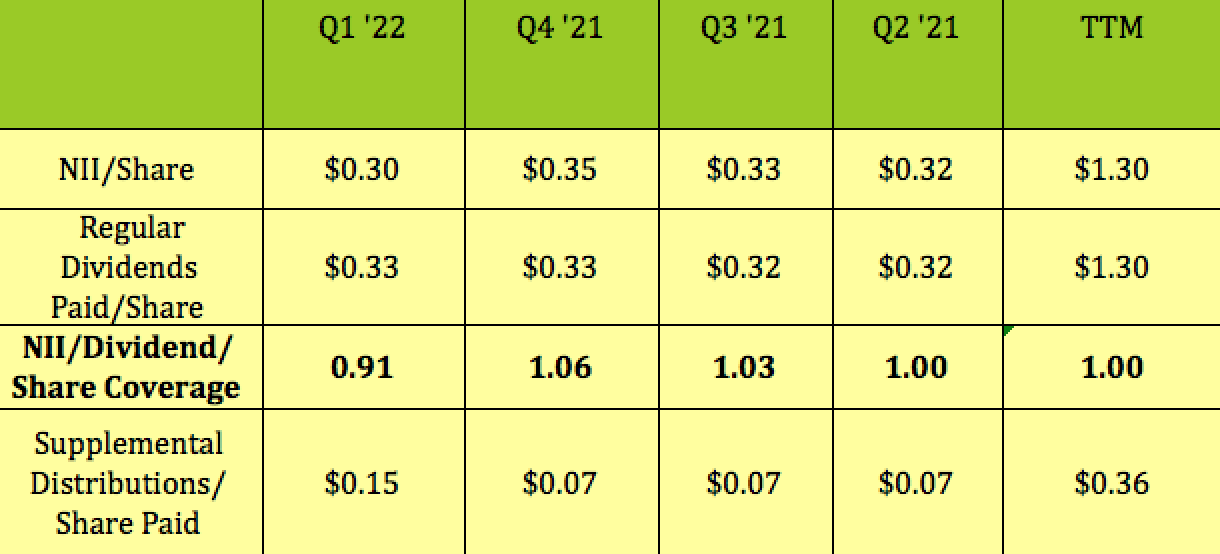
Profitability & Leverage:
ROA and ROA were relatively stable, but a bit below BDC averages, while Debt/NAV of .99X is slightly lower than average. HTGC’s EBIT margin of 75.78% was much higher than average for its industry.
Hidden Dividend Stocks Plus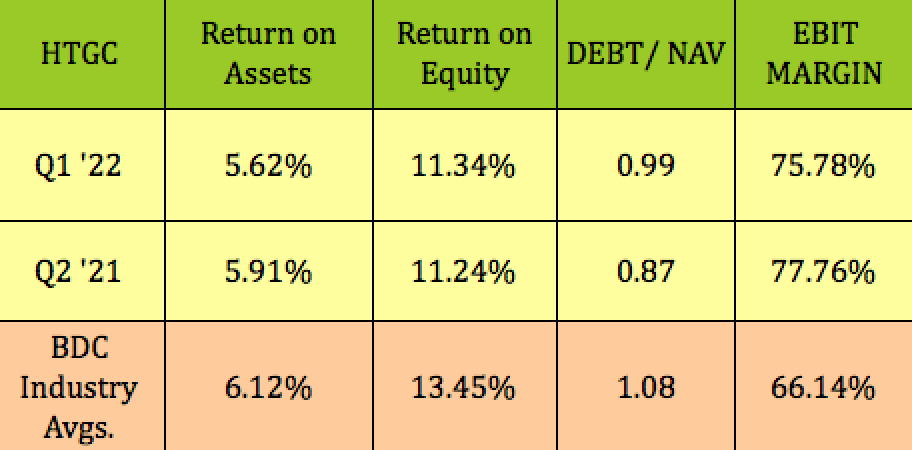
HTGC’s EBIT/Interest coverage of 4.09X is among the higher ratios that we’ve seen in the BDC industry, while its Asset/Debt ratio is in line.
Hidden Dividend Stocks Plus
Debt & Liquidity:
Management uses a diverse array of debt sources for HTGC’s capitalization – ~50% in Equity, 37% in Institutional Notes, 6.5% in SBA loans, and ~5% in credit facilities. Its debt is rated Baa3 by Moody’s.
HTGC site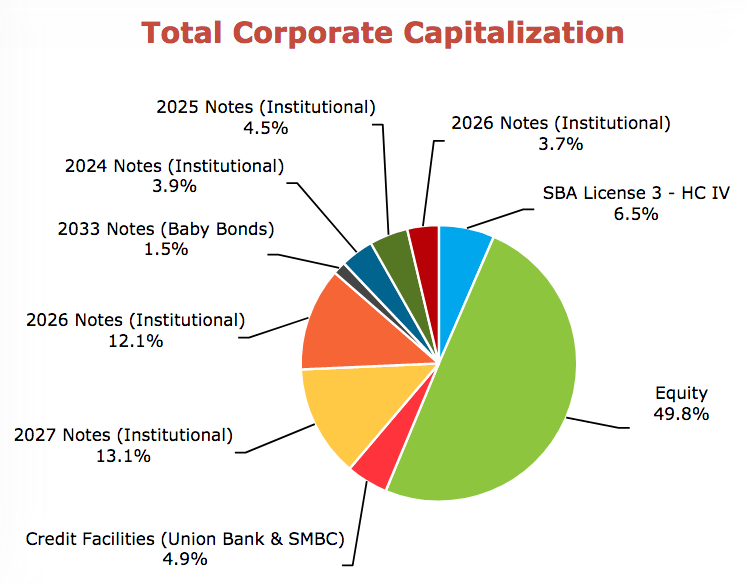
Its debt looks well-laddered into the future, with its 1st maturity of $105M in Notes, coming due in 2024:
HTGC site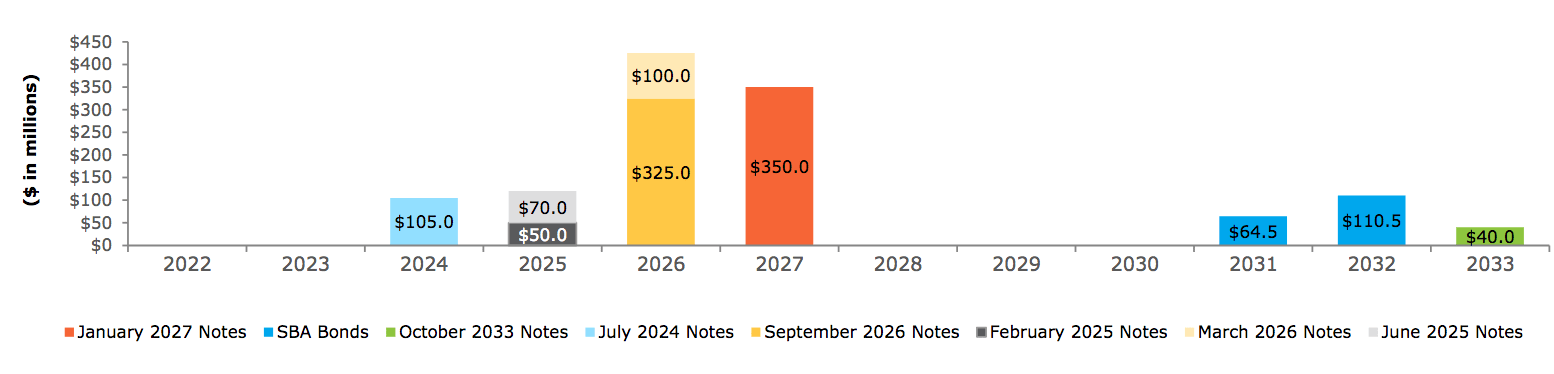
HTGC had $430M in liquidity, as of 3/31/22.
Performance:
It’s a mixed bag for performance – HTGC has outperformed the BDC industry and the market over the past month but has trailed them over the past quarter and year. It has outperformed the market so far in 2022, but has trailed its industry, most likely due to its higher concentration in Tech – the Tech sector is down ~30% in 2022.
Hidden Dividend Stocks Plus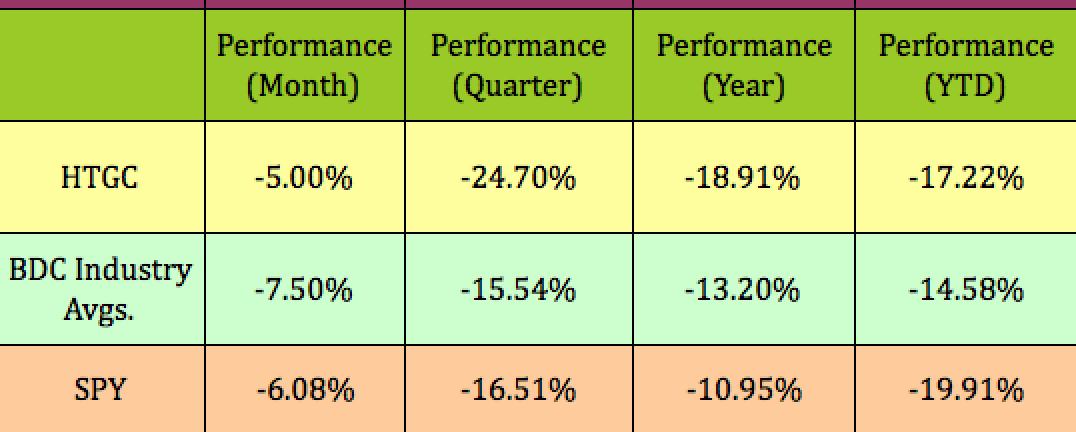
Valuations:
At its 6/29/22 $13.44 closing price, HTGC was trading at a 24.2% premium to its Q1 NAV/Share of $10.82, vs. the BDC industry average of -3%. However, since NAV is affected by dividends, and doesn’t always tell the whole story, Price/NII must also be researched.
HTGC is actually selling at a much lower P/NII of 10.42X, vs. the 13.17X BDC industry average. Its supplemental dividends also give it a higher dividend yield:
Hidden Dividend Stocks Plus
HTGC has a history of selling at a premium to NAV over the past several years – its 2017 – 2021 average premium to NAV is ~1.30X, ranging from 1.11 to 1.47X.
HTGC site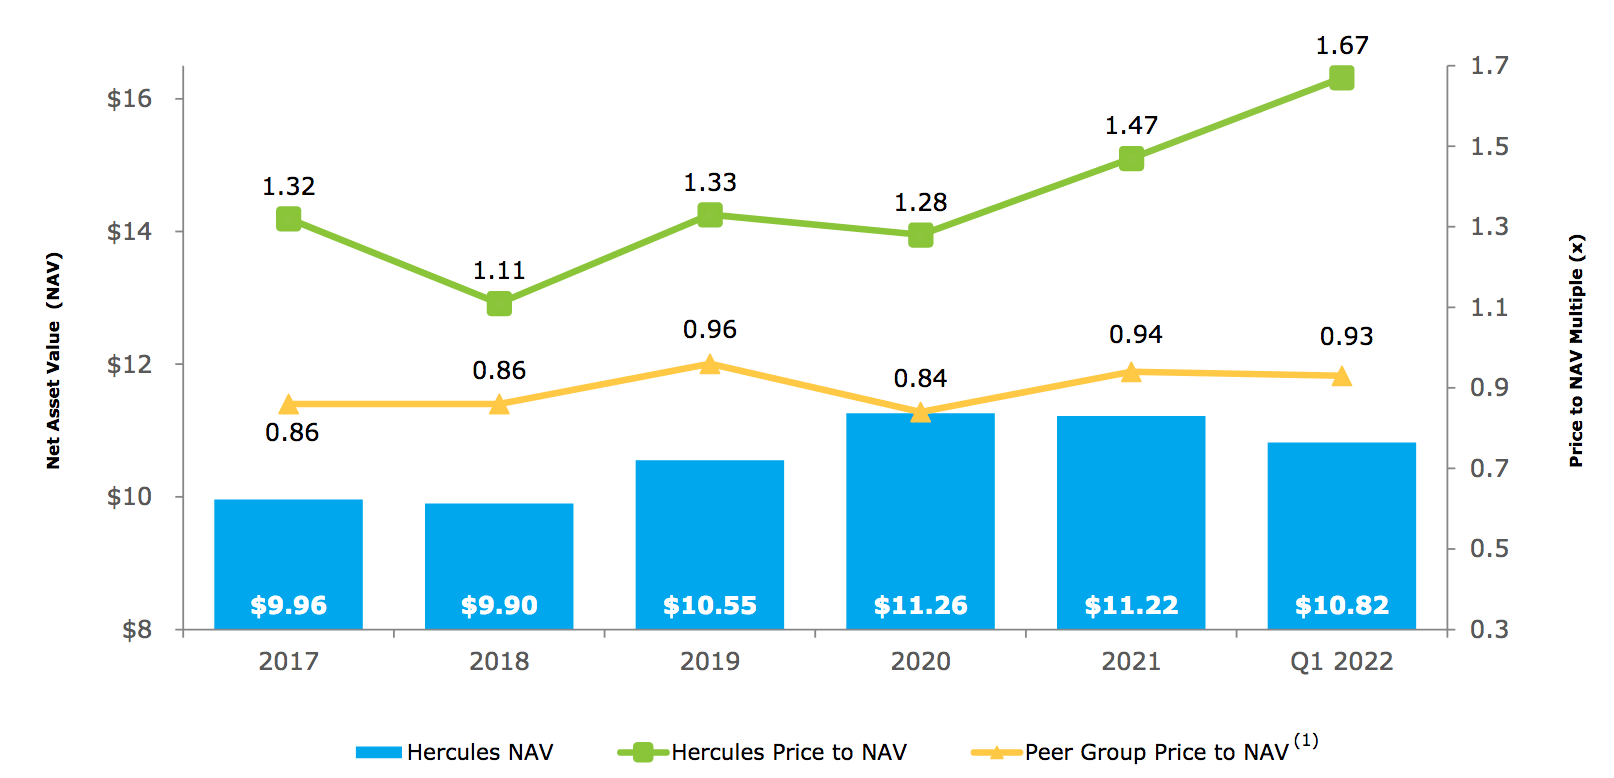
Analysts’ Price Targets:
At its 6/29/22 closing price of $13.44, HTGC was 18.5% below analysts’ lowest price target of $16.50, and 27% below the $18.44 average price target.
Hidden Dividend Stocks Plus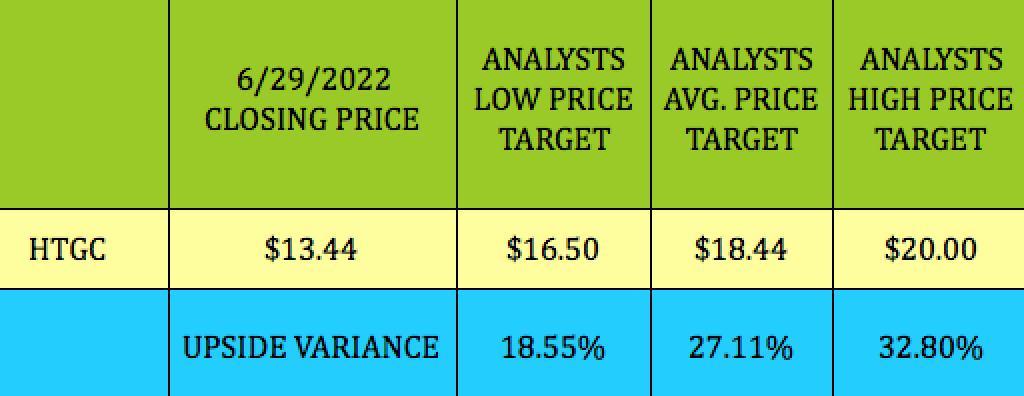
Parting Thoughts:
We consider HTGC a long-term BUY – it’s ~6% above its 52-week low, and, of course, could go lower from here, but its relative P/NII undervaluation, and its UNII cushion for its dividends give us confidence in its long-term prospects as a worthy high yield investment vehicle.
If you’re interested in other high yield vehicles, we cover them every weekend in our articles. All tables furnished by Hidden Dividend Stocks Plus, unless otherwise noted.
Be the first to comment