

FreezeFrames
Introduction
The Tulsa, Oklahoma-based Helmerich & Payne, Inc. (NYSE:HP) released its fiscal fourth-quarter 2022 results on November 16, 2022.
This article is an update of my preceding article, published on September 15, 2022. I have followed HP on Seeking Alpha since September 2014.
1 – Fiscal 4Q22 Results Snapshot
Helmerich & Payne, Inc. announced a fiscal fourth-quarter 2022 net income of $45.54 million, or $0.42 per diluted share, compared to a loss of $0.74 per diluted share in the same quarter a year ago. This quarter, revenues were $631.33 million, up significantly from $343.81 million last year.
President and CEO John Lindsay said in the press release:
Supportive market conditions and our adherence to our business and capital allocation strategy have led to sequentially improving quarterly results in fiscal 2022. We are beginning to recognize economic returns at levels that we have not experienced since 2014. As such, we believe there is significant momentum heading into fiscal 2023,
Net cash provided by operating activities was $117.27 million for the fourth quarter of the fiscal year 2022 compared to $97.75 million in the prior quarter.
H&P’s North America Solutions segment left the fiscal fourth quarter with 176 active rigs in September, up from 174 active rigs in fiscal 3Q.
The company is focused on enhancing returns:
HP Strategy (HP Presentation)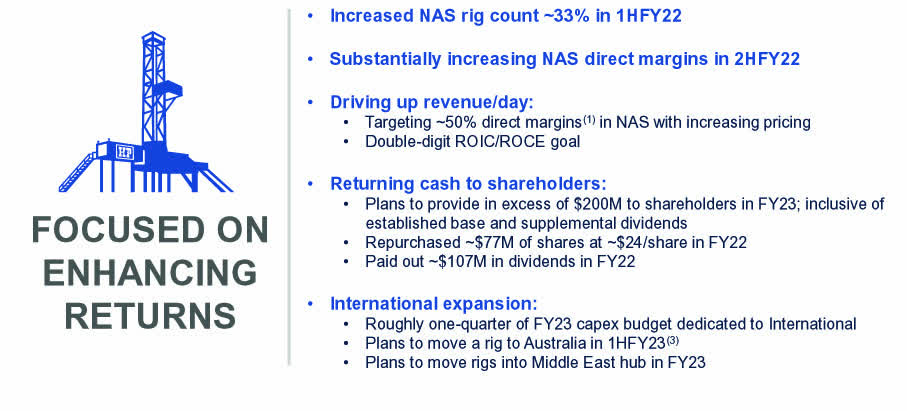
CFO Mark Smith indicated in the conference call:
the demand for FlexRig has primarily been satisfied with readily available hot rigs. This allows us to postpone the investment of bringing a rig out of stack and thus exercise capital discipline.
HP Fleet status (HP Presentation)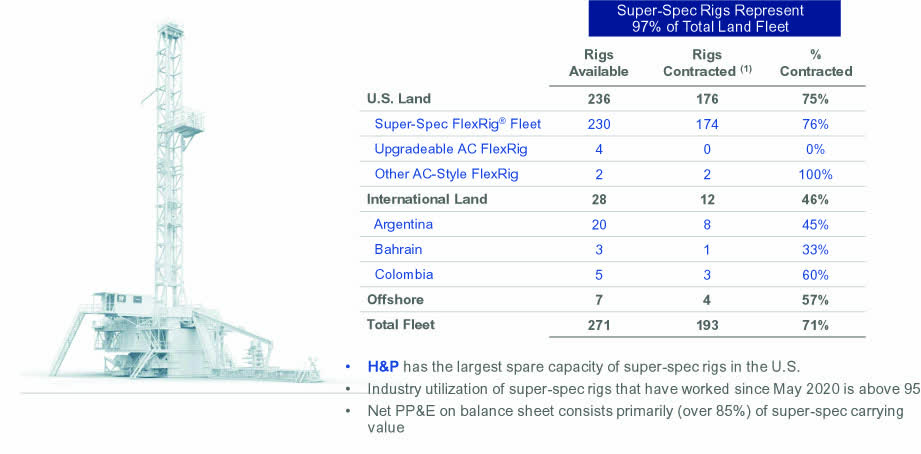
2 – Investment Thesis
Helmerich & Payne released results in-line with analysts’ expectations this quarter. The onshore drilling environment has dramatically improved, and the balance sheet is improving.
CEO John Lindsay said in the conference call:
During the past 2 quarters, the demand for FlexRig has primarily been satisfied with readily available hot rigs. This allows us to postpone the investment of bringing a rig out of stack and thus exercise capital discipline. Here’s an example. In our fourth fiscal quarter, only 1 rig was reactivated out of stack in the quarter. That same quarter, however, we experienced a churn of 14 rigs, and in the third fiscal quarter our churn was 18 rigs with 3 rigs reactivated. The takeaway is that the majority of customer demand in the past couple of quarters has been satisfied by rig churn, not rig reactivations.
However, the risk of recession in 2023 weighs heavily on the industry. The FED is expected to hike by 75-point on December 14, even if the recent October CPI shows that inflation is going down slowly but still at 7.7%.
Because H&P is tightly associated with oil and gas prices, it could easily be the first stock to drop if oil prices fall due to declining demand, a possible scenario based on a recession in 2023.
Therefore, I suggest trading 50% LIFO of your long-term position to protect you from a sudden drop in oil prices. This dual strategy is what I am suggesting in my marketplace, “The Gold and Oil corner.”
Investing in HP demands being well acquainted with the US onshore business. Note: The U.S. Land rigs segment is the most significant revenue for the company and represents 87.5% of the total revenue.
HP Quarterly Revenues per Segment 3Q22 (Fun Trading)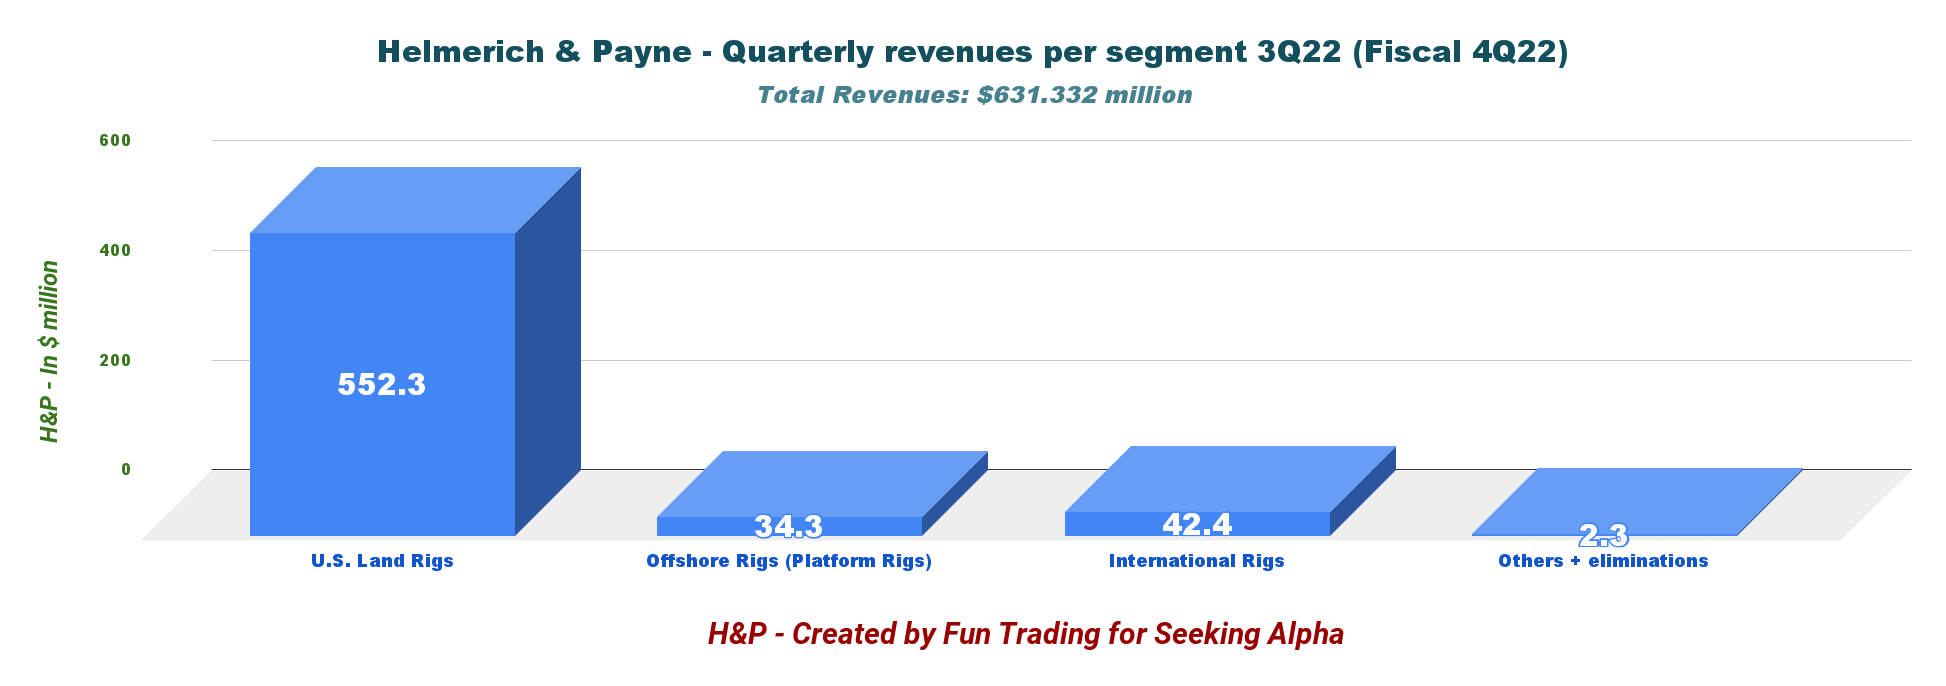
3 – Segment Discussion
3.1 – North America Solutions Segment
Operating income was $92.1 million, compared to $57.4 million last year. The increase in operating income was due to improving contract economics as market pricing continued to increase, coupled with term contracts rolling onto market rates.
Direct margins increased by $35.9 million to $203.5 million as revenues and expenses increased sequentially.
Quarterly operating results were impacted by the costs associated with reactivating rigs: $7.5 million in the fourth fiscal quarter compared to $6.5 million in the previous quarter.
From the press release:
The North America Solutions segment exited the fourth quarter of fiscal year 2022 with 176 active rigs reflecting an increase in revenue per day of approximately $3,000/day or 11% to $29,500/day on a sequential basis, while direct margins per day increased by roughly $2,000/day or almost 20% to $12,600/day.
3.2 – Offshore Gulf of Mexico Segment
Noticeable improvement in this segment. The company recorded an operating income of $6.6 million compared to an operating income of $5.9 million during the previous quarter. Direct margins for the quarter were $9.4 million compared to $8.8 million in the prior quarter.
3.3 – International Rigs Segment
This segment had an operating loss of $0.8 million compared to an operating loss of $6.6 million during the previous quarter. The decrease in operating loss is primarily due to increased activity in Latin America, particularly with operations in Argentina.
Direct margins during the fourth fiscal quarter were $3.3 million compared to a negative $3.2 million during the previous quarter.
Current quarter results included a $1.2 million foreign currency loss compared to a $1.1 million foreign currency loss in the previous quarter.
4 – Stock Performance
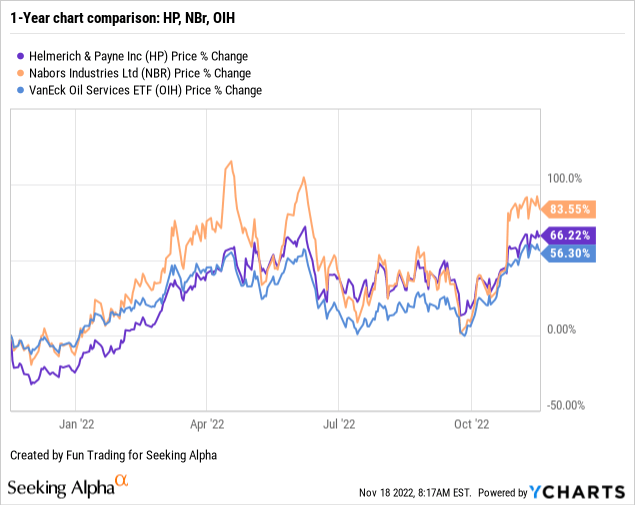
HP is up 66% on a 1-year basis, while Nabors Industries (NBR), its direct competitor, is up 84%. HP outperformed the VanEck Vectors Oil Services ETF (OIH).
CEO John Lindsay said in the conference call:
I’m encouraged to report that our leading-edge pricing levels are now delivering margins in line with that goal. These are results not seen since the 2012, 2014 upcycle. Strong demand from customers coupled with rollovers of term contracts, should help drive average pricing higher across our active fleet and we believe there is significant momentum heading into fiscal 2023.
Helmerich & Payne – Balance Sheet: 3Q22 (Fiscal Fourth-Quarter 2022) – The Raw Numbers
| Helmerich & Payne | 3Q21 (fiscal 4Q21) | 4Q21 (fiscal 1Q22) | 1Q22 (fiscal 2Q22) | 2Q22 (fiscal 3Q22) | 3Q22 (fiscal 4Q22) |
| Total Revenues in $ Million | 343.81 | 409.78 | 467.60 | 550.23 | 631.33 |
| Net income in $ Million | -79.16 | -51.36 | -4.98 | 17.75 | 45.54 |
| EBITDA in $ Million | 3.19 | 47.85 | 105.38 | 124.32 | 175.95* |
| EPS diluted in $/share | -0.74 | -0.48 | -0.05 | 0.16 | 0.42 |
| Operating cash flow in $ Million | 46.62 | -3.72 | 22.61 | 97.75 | 117.27 |
| CapEx in $ Million | 32.98 | 47.89 | 67.14 | 78.15 | 57.71 |
| Free Cash Flow in $ Million | 13.64 | -51.61 | -44.53 | 19.59 | 59.56* |
| Total cash in $ Million | 1,116.23 | 441.26 | 350.58 | 332.99 | 349.23 |
| Long-term debt in $ Million | 1,025.49 | 542.24 | 541.97 | 542.29 | 542.61 |
| Dividend per share in $ | 0.25 | 0.25 | 0.25 | 0.25 | 0.25+0.235 |
| Shares outstanding (Basic) in Million | 107.90 | 107.57 | 105.39 | 106.02 | 106.08 |
Data Source: Company release
* Estimated by Fun Trading
Financials And Balance Sheet Snapshot
1 – Revenues Were $631.33 Million In Fiscal 4Q22
HP Quarterly Revenue History (Fun Trading) Helmerich & Payne reported $631.33 million in the fiscal fourth quarter of 2022, up from $343.81 million in the same quarter a year ago and up 14.7% sequentially. HP posted an income of $0.42 per diluted share versus a loss of $0.74 in the previous year’s quarter. We are finally well in the green, which is an outstanding achievement. Net cash provided by operating activities was $117 million for the fourth quarter of 2022 compared to $98 million for the third quarter of the fiscal year 2022. CEO John Lindsay said in the conference call: Our financial results improved substantially quarter-over-quarter as pricing increases, and better contract economics took hold across more of our FlexRig fleet. You may recall from our previous earnings calls this year, we made the point that our rig pricing needed to improve to a level that provides at least a 50% gross margin in order to achieve returns above our cost of capital.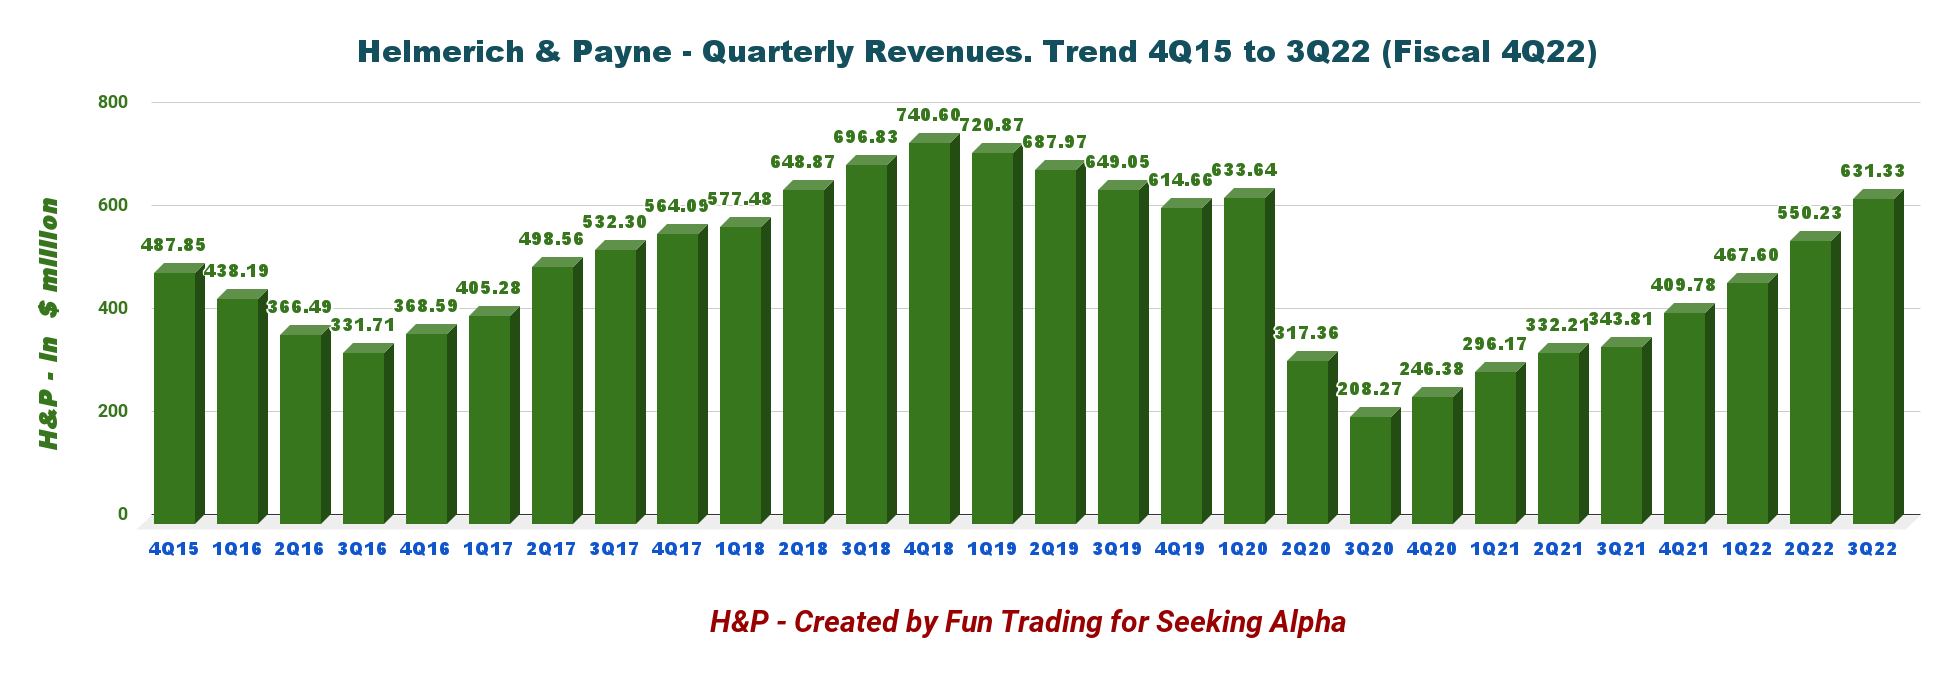
2 – Free Cash Flow was estimated at $59.56 Million In Fiscal 4Q22
HP Quarterly Free cash flow history (Fun Trading)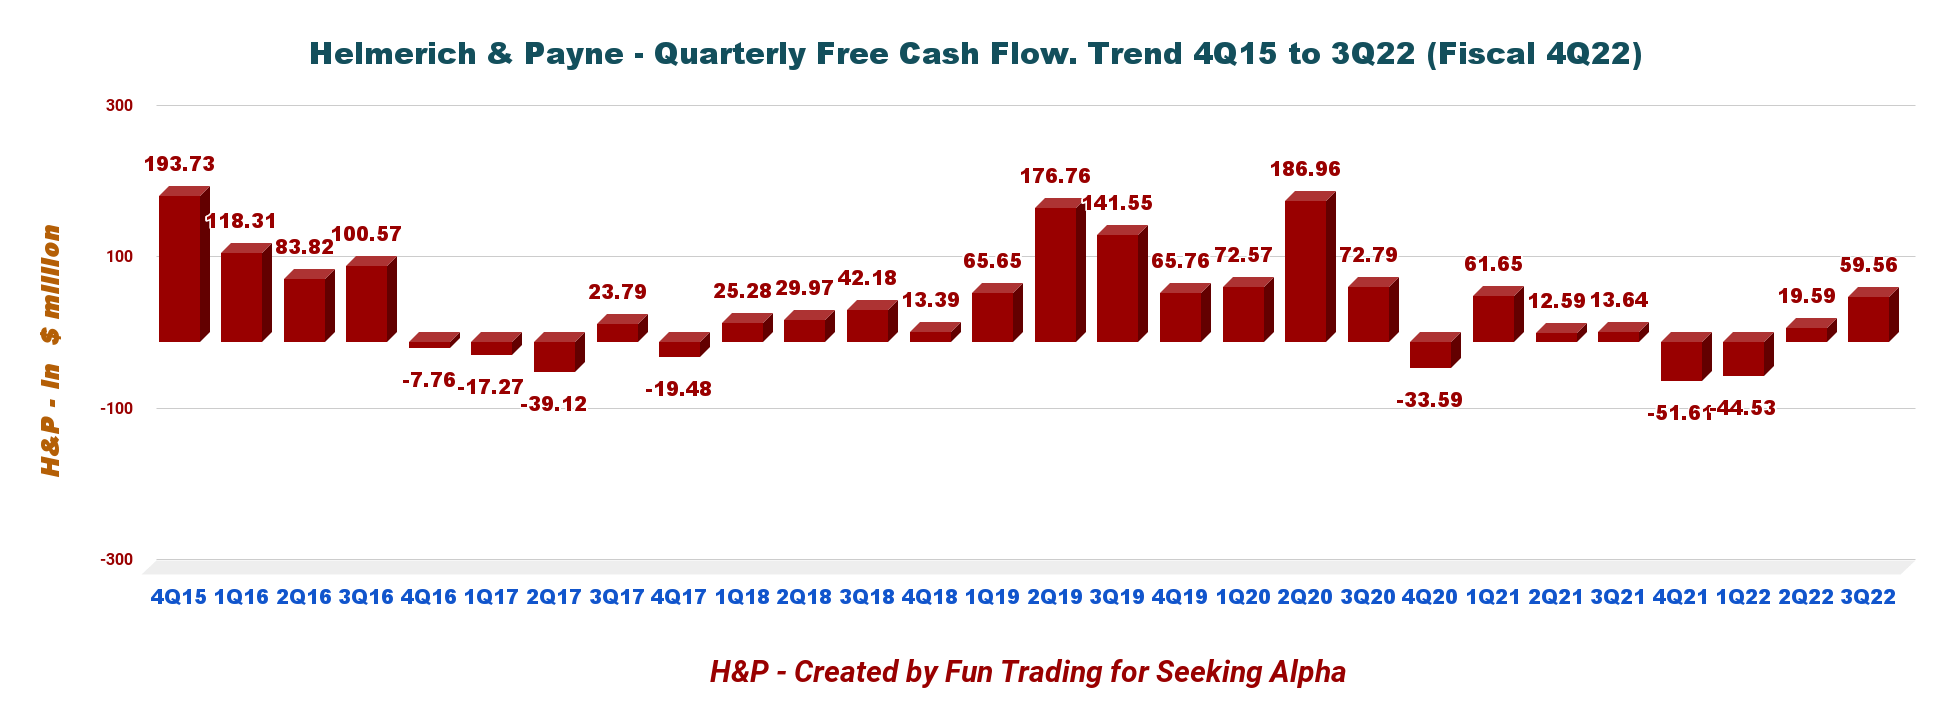
Note: Generic free cash flow is the cash from operations minus CapEx.
The company recorded a negative trailing 12-month FCF of $16.99 million. The free cash flow for the fiscal fourth quarter is estimated at $59.56 million.
On September 7, 2022, H&P declared a quarterly base cash dividend of $0.25 per share, and on October 17, 2022, announced a supplemental cash dividend of $0.235 per share; both dividends are payable on December 1, 2022, to stockholders of record at the close of business on November 15, 2022. The total dividend paid on November 15, 2022, was $0.485 per share.
3 – Net Debt was $193.38 Million In Fiscal 4Q22
HP Quarterly Cash versus Debt history (Fun Trading)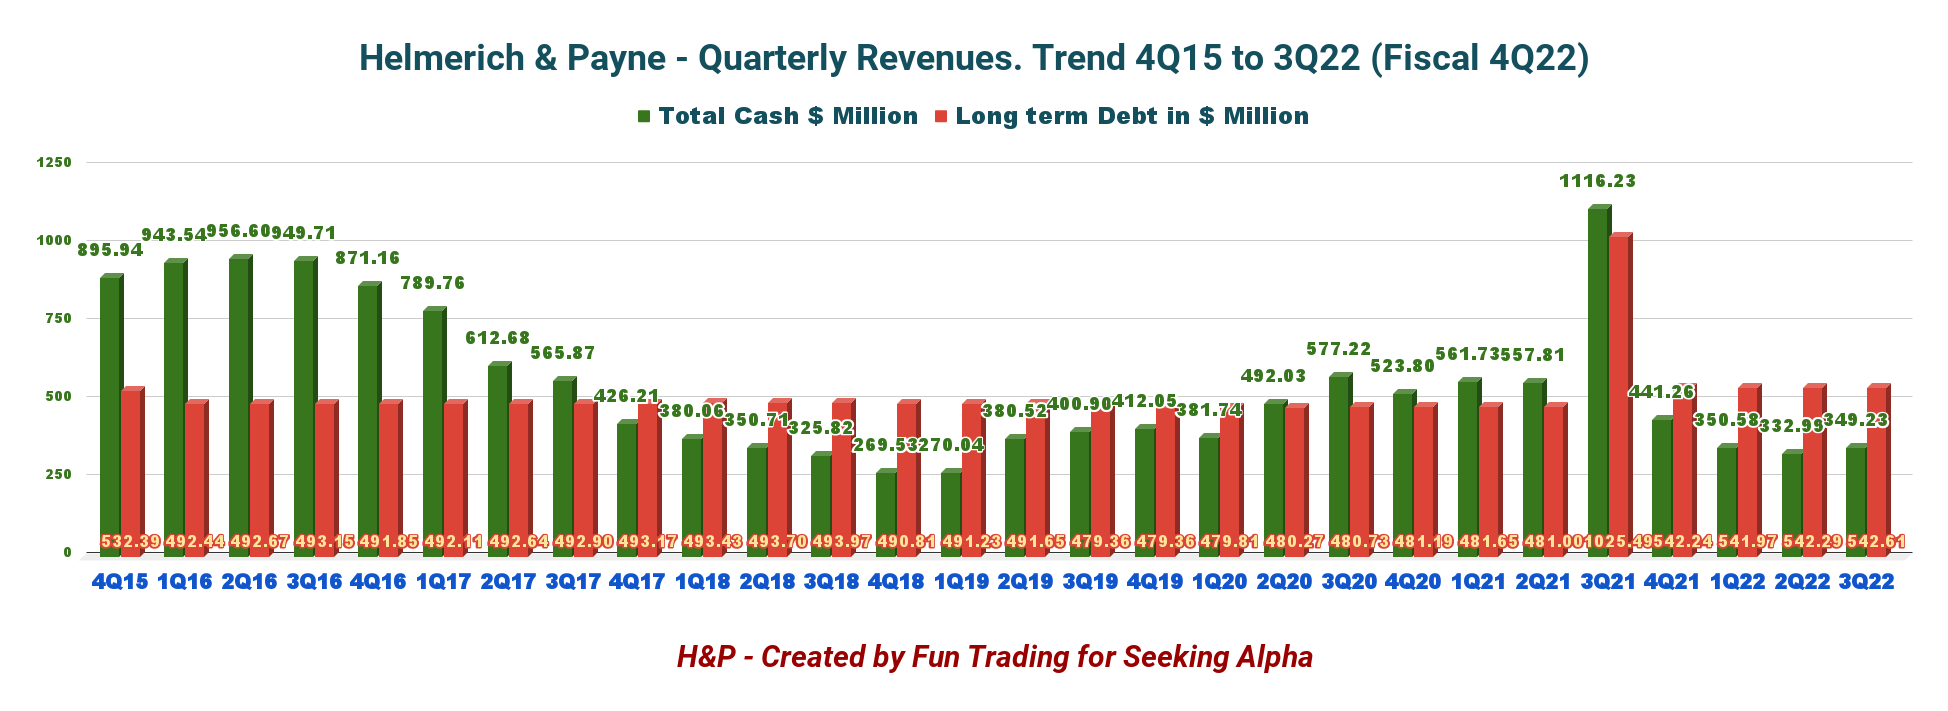
The company shows a net debt of $193.38 million. The debt-to-capitalization of 16.6% is acceptable. The company had $349.23 million in cash and short-term investments, plus $750 million of availability under its committed revolver.
Total liquidity was roughly $1.1 billion on September 30, 2022.17. The debt is a $550 million public bond with maturity in 2031. All indicators show that HP is outperforming its peers.
HP Liquidity and Debt (HP Presentation)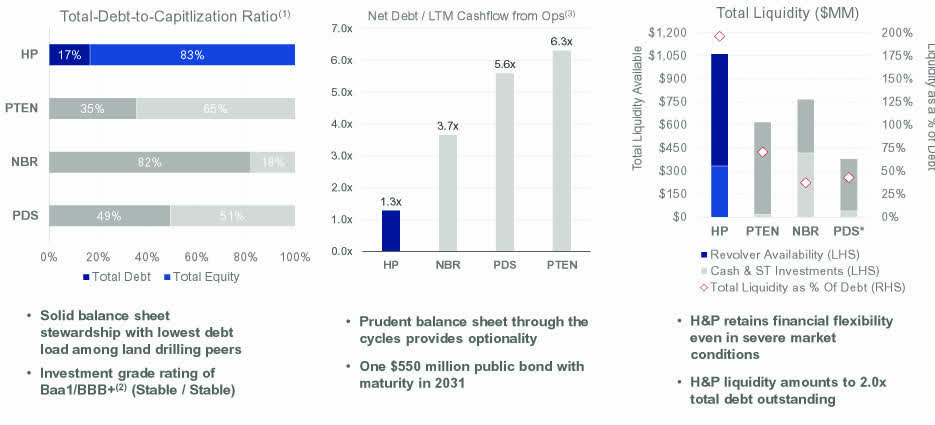
4 – 2022 Guidance
H&P expects to see increased profitability for the Company driving it forward to execute other strategic capital allocation priorities, such as the recently announced 2023 supplemental shareholder return plan and diversification through further investment in international operations.
The fiscal year 2023 CapEx budget ranges between $425 and $475 million.
HP Fiscal 2023 CapEx (HP Presentation)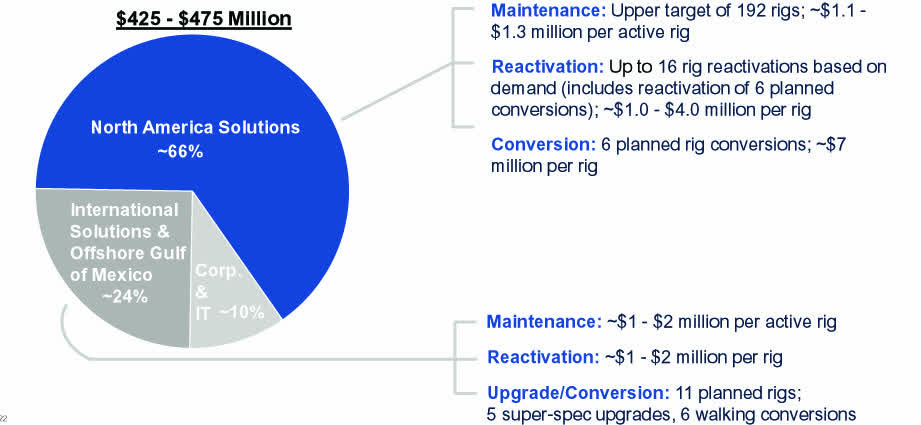
From the press release:
North America Solutions:
- We expect North America Solutions direct margins to be between $250-$270 million, which includes approximately $8.5 million in estimated reactivation costs
- We expect to exit the quarter between approximately 181-186 contracted rigs
International Solutions:
- We expect International Solutions direct margins to be between $7-$10 million, exclusive of any foreign exchange gains or losses
- International Solutions direct margins are expected to be reduced by operating costs related to establishing our Middle East hub
Offshore Gulf of Mexico:
- We expect Offshore Gulf of Mexico direct margins to be between $8-$10 million
Technical Analysis And Commentary
HP TA Chart short-term (Fun Trading StockCharts)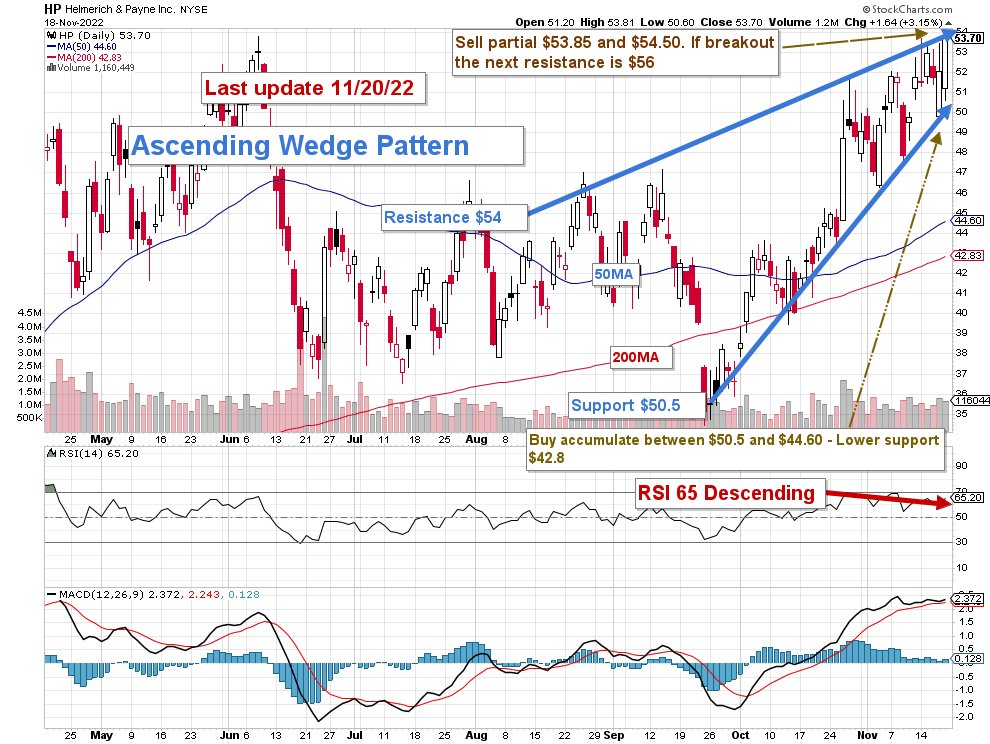
Note: The chart is adjusted for the dividend
HP forms an ascending wedge pattern with resistance at $54 and support at $50.5. The rising or ascending wedge pattern is a bearish chart pattern that suggests an imminent breakout to the downside. An elevated RSI confirms it at 65.
In my preceding article, the short-term trading strategy is to trade LIFO for about 50% of your position, which I still recommend now.
I suggest selling between $53.85 and $54.5 with possible upper resistance at $56 and waiting for a retracement between $50.5 and $44.60 with possible lower support at $42.8.
Watch oil prices like a hawk.
Warning: The TA chart must be updated frequently to be relevant. It is what I am doing in my stock tracker. The chart above has an eventual validity of about a week. Remember, the TA chart is a tool only to help you adopt the right strategy. It is not a way to foresee the future. No one and nothing can.
Author’s note: If you find value in this article and would like to encourage such continued efforts, please click the “Like” button below as a vote of support. Thanks!
Be the first to comment