
peterschreiber.media/iStock via Getty Images
Let’s start by looking at some key excerpts from last week‘s Fed Minutes:
Liquidity conditions became strained in some financial markets during the intermeeting period. Market depth—a gauge of the ability to transact in large volumes at quotes posted by market makers—deteriorated in U.S. Treasury, U.S. equity, and crude oil markets. Trading volumes generally remained within normal ranges in most markets and increased above normal levels in Treasury markets later in the period. Bid–ask spreads did not increase notably in most markets. However, investors reported that strained liquidity at times amplified the volatility of price moves and may have contributed to the particularly large swings in Treasury yields and equity prices late in the intermeeting period.
…..
Credit quality in the commercial real estate sector continued to show some signs of stress. Delinquency rates for commercial mortgage-backed securities (CMBS) collateralized by hotel and retail properties continued to decline in January but remained well above pre-pandemic levels, while those for CMBS in the office sector increased somewhat in January but remained fairly low by historical standards.
…..
Overnight rates on commercial paper (CP) across most sectors also held steady, although rates and spreads on longer-tenor CP and negotiable certificates of deposit increased amid the escalation of the Ukraine invasion. Spreads between three-month forward rate agreements and overnight index swaps widened as borrowers increased precautionary issuance of longer-tenor debt while money market investors preferred shorter-duration investments.
Credit market difficulties occur 1-2 years before a recession. I don’t know if the above notes are broad enough to warrant concern. They do need to be noted.
Regarding inflation, the Fed noted:
Participants remarked that recent inflation readings continued to significantly exceed the Committee’s longer-run goal and noted that developments associated with Russia’s invasion of Ukraine, including the related surge in energy prices, will add to near-term inflation pressures. Some participants noted that elevated inflation had continued to broaden from goods into services, especially rents, and into sectors that had not yet experienced large price increases, such as education, apparel, and health care. A few participants also noted that the number of spending categories experiencing inflation rates above 4 percent had continued to rise, or that the trimmed mean inflation measure from the Federal Reserve Bank of Dallas had risen to its highest level since the early 1980s. Many participants indicated that their business contacts continued to report substantial increases in wages and input prices that were being passed through into higher prices to their customers without any significant decrease in demand. Participants commented on a few factors that might lead the high inflation readings to persist, including strong aggregate demand, significant increases in energy and commodity prices, and supply chain disruptions that were likely to require a lengthy period to resolve. In addition, some participants noted that recent higher inflation could affect future inflation dynamics.
This is an incredibly negative paragraph. Price pressures are spreading while also increasing in overall magnitude. Businesses are more inclined to raise prices; consumers are expecting those price increases and are planning accordingly.
Here’s a chart of the key data:
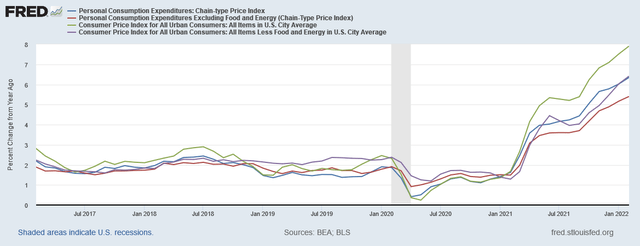
Y/Y percent changed PCE and CPI total and core price indexes (FRED)
Both core and total CPI and PCE price indexes are rising at sharp rates. There is no indication of a plateau in the data.
Let’s turn to the charts, starting with the overall EMA picture:
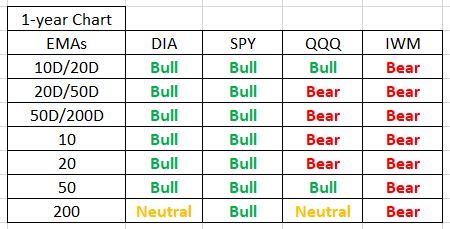
EMAs of 4 main ETFs (Data from StockCharts; author’s spreadsheet)
The ETFs are aligned from conservative on the left to aggressive on the right. The amount of negativity increases with the level of aggressiveness of the ETF.
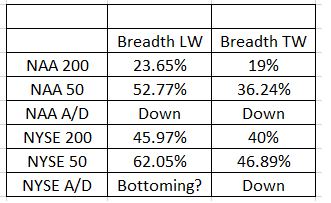
Market breadth last week (LW) and this week (TW) (Data from StockCharts; author’s calculations)
All the market breadth indicators declined this week. All are also mostly bearish.
Finally, let’s look at the charts starting with the YTD time frame:
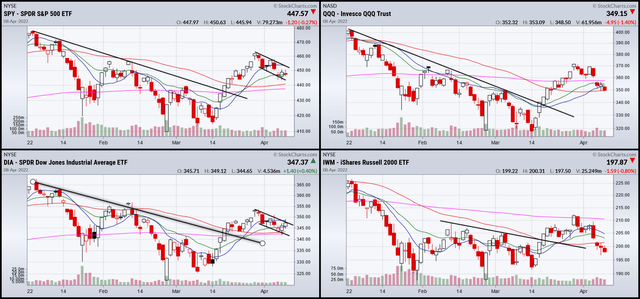
YTD SPY, QQQ, DIA, and IWM (StockCharts)
The overall trend is soft. The indexes declined until mid-March. They then staged a rally lasting to near the end of March. Prices are now trending in a consolidating pennant formation.
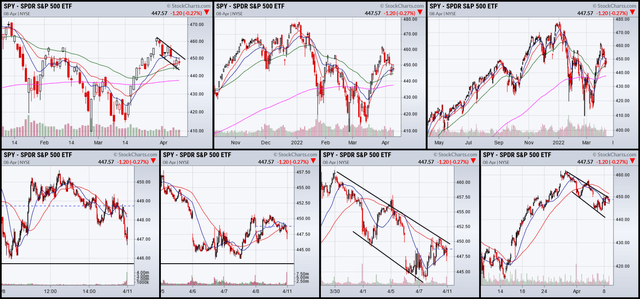
SPY: (lower) 1,5,10, and 30-day charts (upper); 3, 6, and12 month charts (StockCharts)
Right now, the key to the next phase of price action is how the SPY resolves the current downward-sloping channel. Prices are still within that pattern.
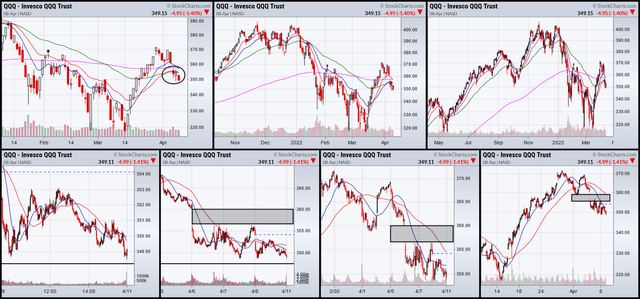
(lower) 1, 5, 10, and 30-day; (upper) 3, 6, and 12-month charts (StockCharts)
The three lower charts show that prices have clearly been contained. The 3-month chart (top left) shows that prices have gapped lower below the 200-day EMA and are now below all the EMAs, which is bearish.
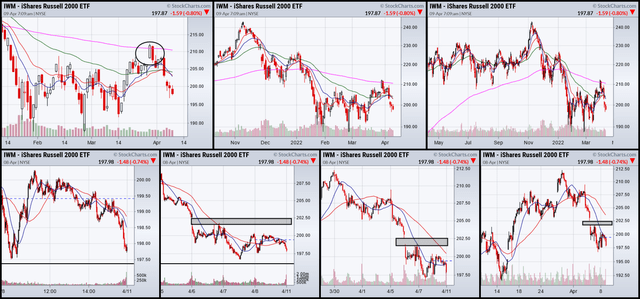
(lower) 1, 5, 10, and 30-day charts; (upper) 3, 6, and 12-month charts (StockCharts)
The key to the IWM charts is that prices hit the 200-day EMA (upper left) and reversed lower. The index is now below all the EMAs. And as noted in the table above, the IWM’s EMA picture is bearish.
The overall trend is bearish. The Fed is raising rates, the credit markets are sending concerning signals, a war is increasing commodity prices, and a Covid resurgence is hampering China. As a result, the markets are trending lower – which is to be expected.


Be the first to comment