

JamesBrey
Thesis
The Guggenheim Strategic Opportunities Fund (NYSE:GOF) showed up on our radar because it currently yields 13.36%, near a peak level in a decade as you can see from the following chart. To wit, the dividend yield for GOF has fluctuated in the past 10 years between 10% and 14% most of the time, with an average of 12%. Hence, its current 13.4% yield is not only far above its historical average (by almost 12% in relative terms) but also close to the peak level in a decade, signaling an undervaluation of its assets.
Source: Seeking Alpha data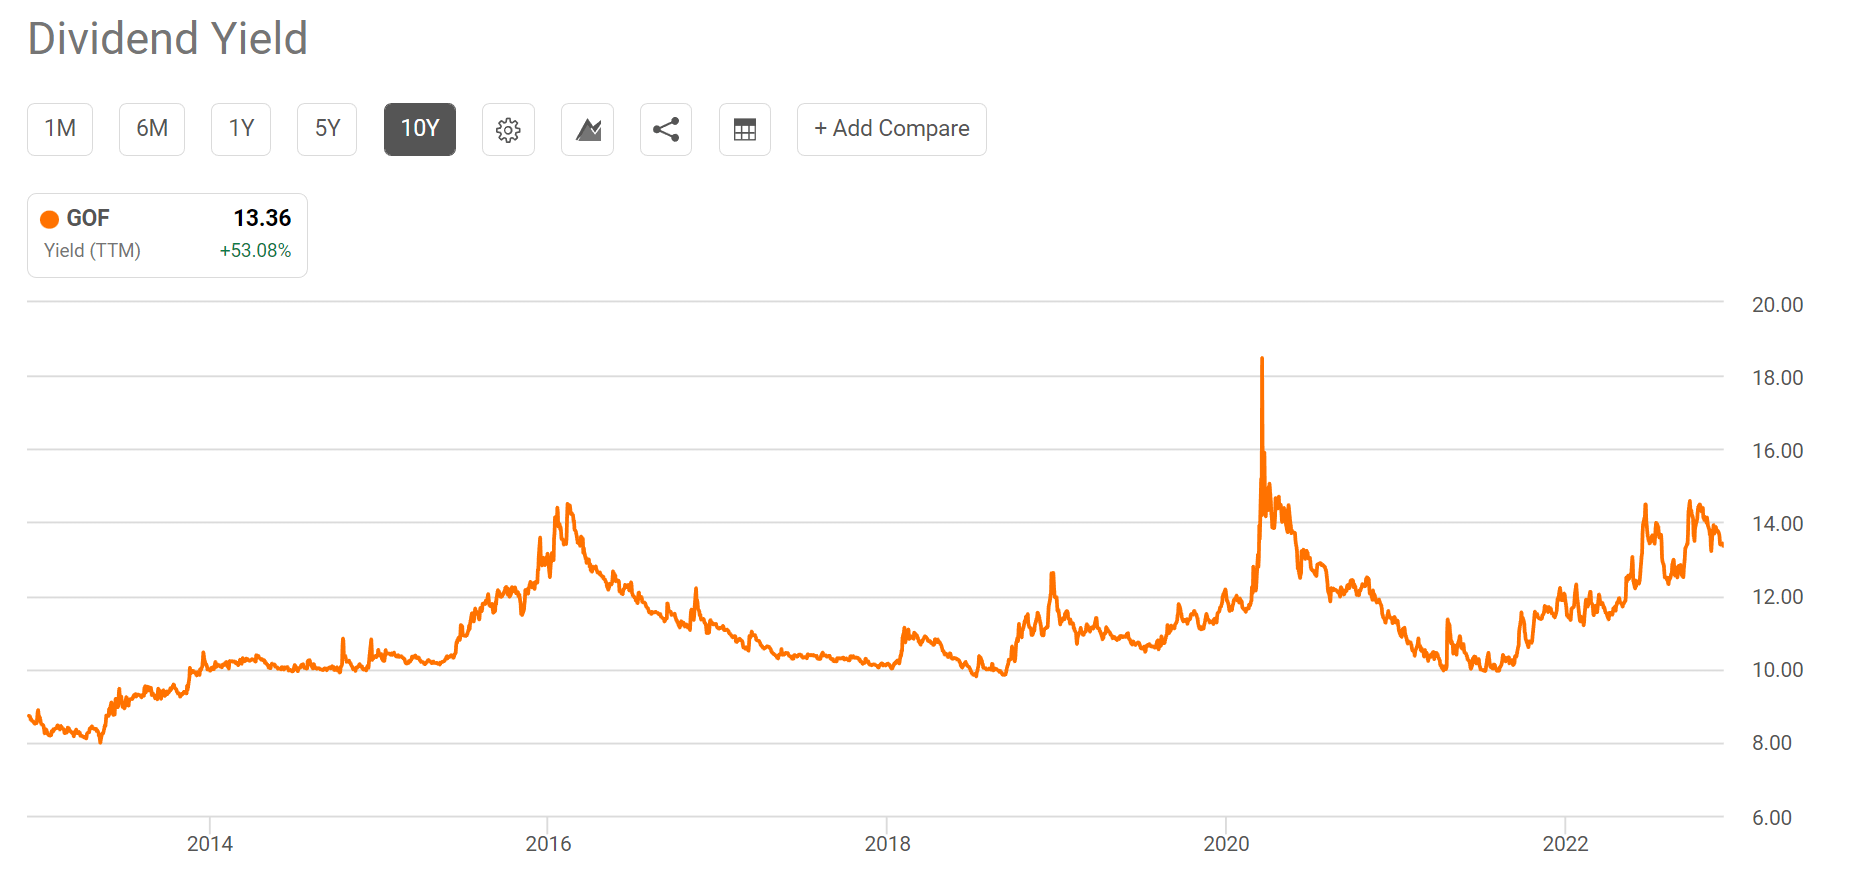
However, digging a bit deeper, the negative is also clear. The fund now trades at a 25.9% premium above its NAV, also near a peak level in 5 years as you can see from the following chart. In terms of its Z-score, it is 0.69 on a 3-month basis, 0.74 on a 6-month basis, and 0.90 on a 1-year basis as seen. For readers unfamiliar with the concept of the Z-score, it’s a measure of a fund’s premium relative to its own historical track record. A higher Z-score means a higher premium according to its historical record, and the timeframe means the length of the history included in the consideration. So here, on a 1-year basis, GOF’s Z-score is 0.9, close to a so-called 1-sigma event, signaling substantial premium beyond random fluctuation noises.
Given the mixed signal, the remainder of this article, therefore, examines the fund more closely. And in the end, my overall conclusion is that I see more positives than negatives here. I feel comfortable rating it as a “hold” on the basis that I see the positives (as to be elaborated next) can easily balance out the high premium.
Source: CEF Connect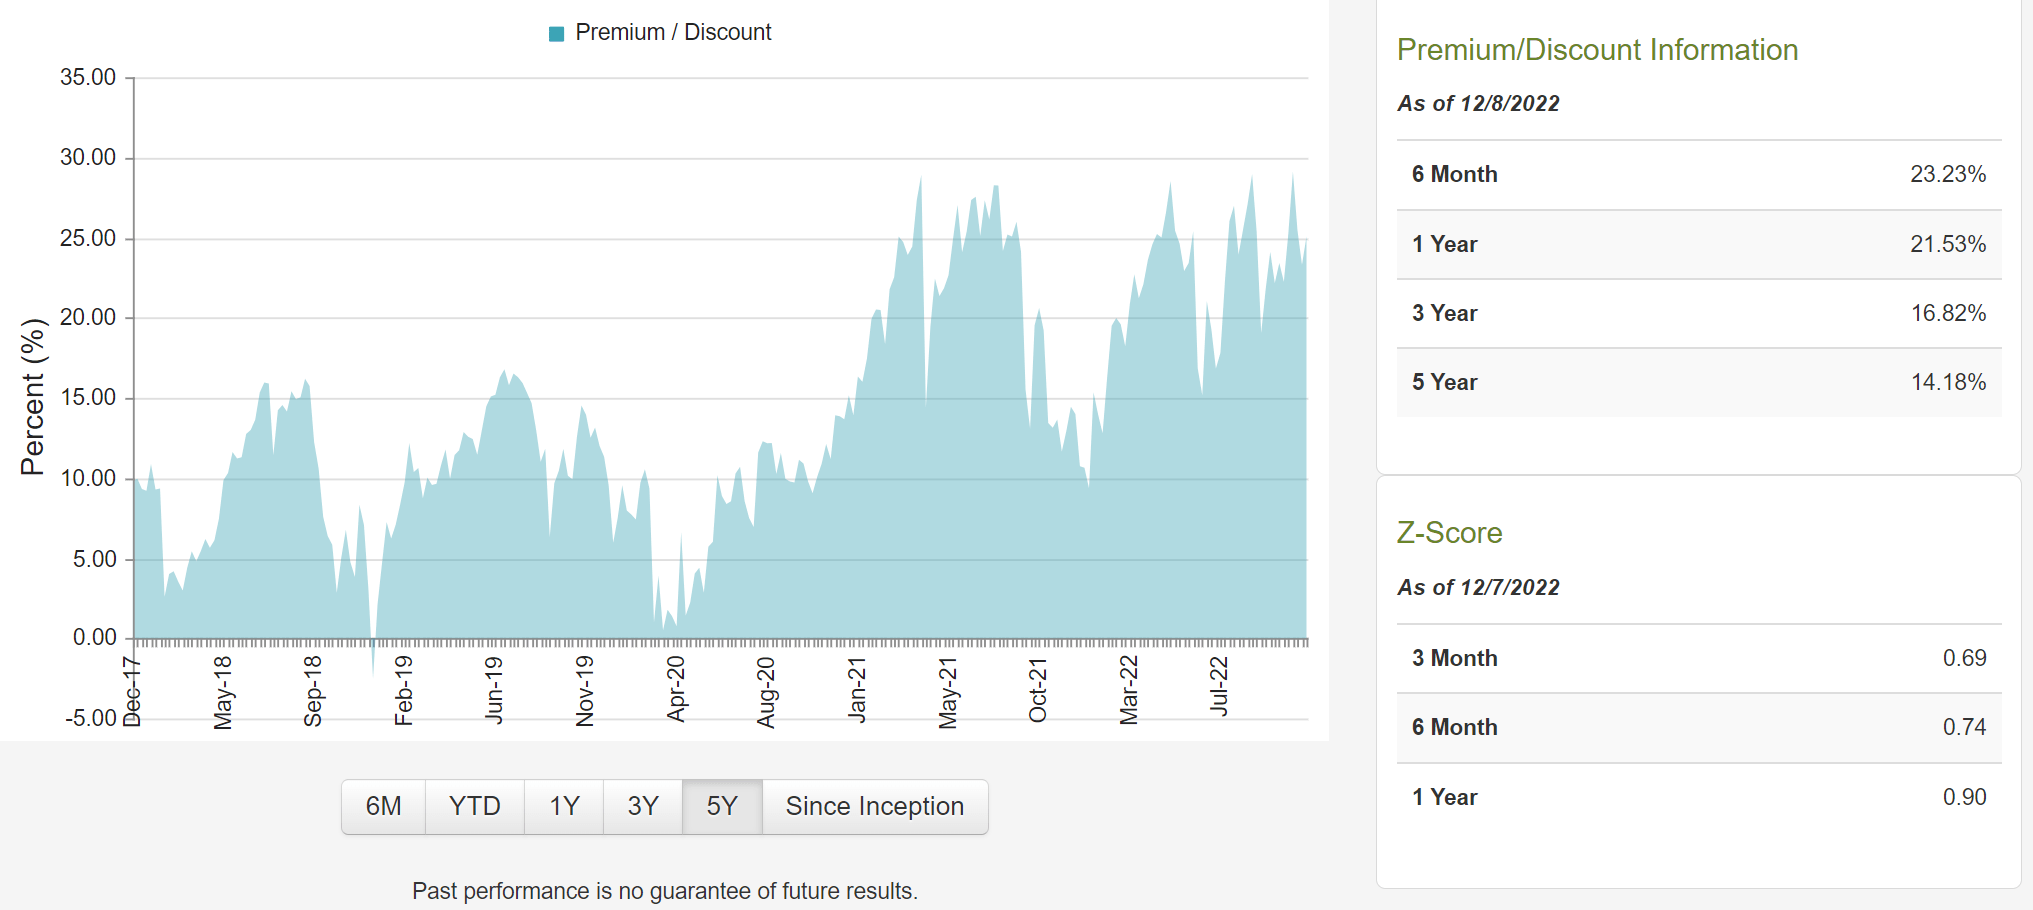
GOF: basic information
First, a quick intro to the fund in case it is new to some readers. As detailed in the fund description below, GOF applies a relative value-based approach to identify investment opportunities in the fixed-income and alternative investments space:
The Fund’s investment objective is to maximize total return through a combination of current income and capital appreciation. The Fund will pursue a relative value-based investment philosophy, which utilizes quantitative and qualitative analysis to seek to identify securities. The fund seeks to combine a credit managed fixed income portfolio with access to a diversified pool of alternative investments and equity strategies.
The fund also applies a leverage of 24.96% as shown in the chart below. As of this writing, GOF’s total investment exposure is $1912M, consisting of $1435M of total common assets and a total debt of $477, translating into an effective leverage ratio of 24.96%.
Source. CEF Connect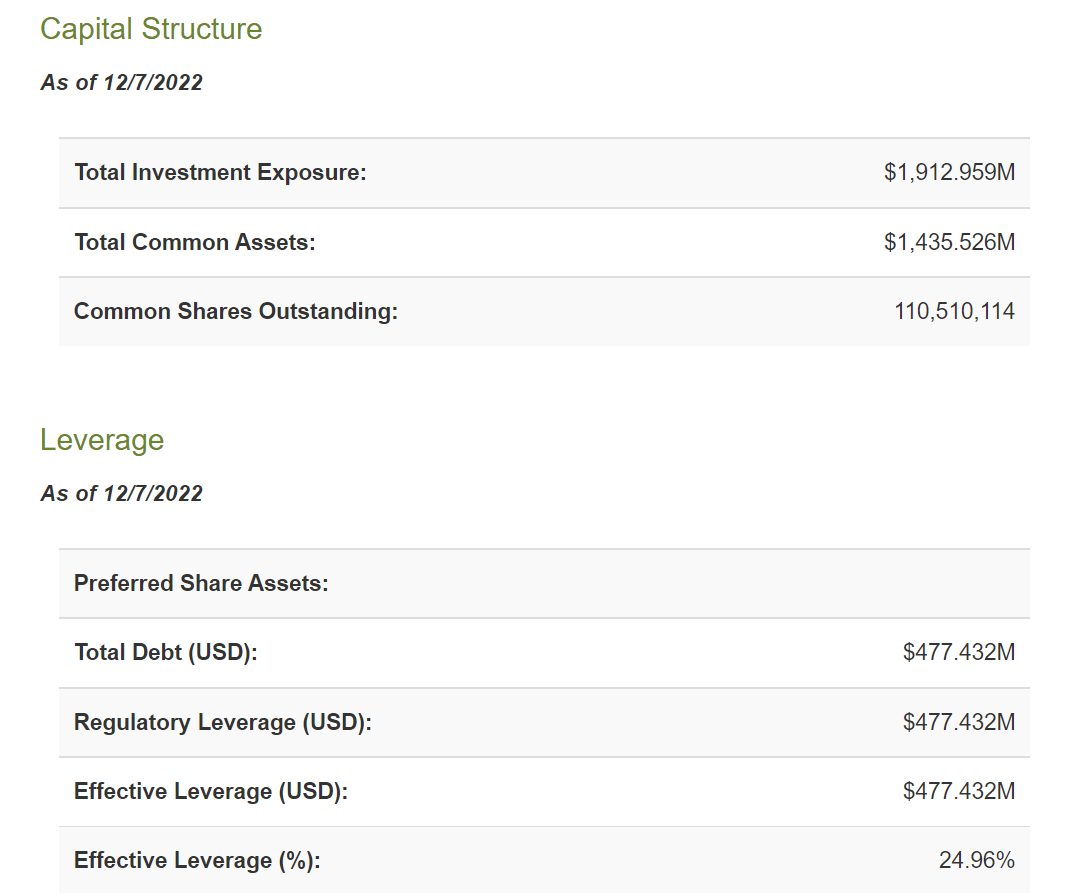
GOF’s superior total return
Besides the high yield as mentioned above, the fund has also delivered superior total returns. As shown in the next chart below, GOF has delivered a total return of 11.2% CAGR since 2008, outperforming both SPY (used to approximate the performance of the overall equity market) and also FOF (as a fund of funds, which I am using FOF to approximate the performance of the overall CEF space). To be more specific, GOF outperformed SPY’s 9.22% CAGR by 1.9% and FOF’s 6.51% by 4.6%. Such large and consistent results are of course partially due to the use of leverage. But the management team’s ability to identify good investment opportunities in niche and alternative spaces must have also played a more fundamental role.
Source: Portfolio Visualizer, Silicon Cloud Technologies LLC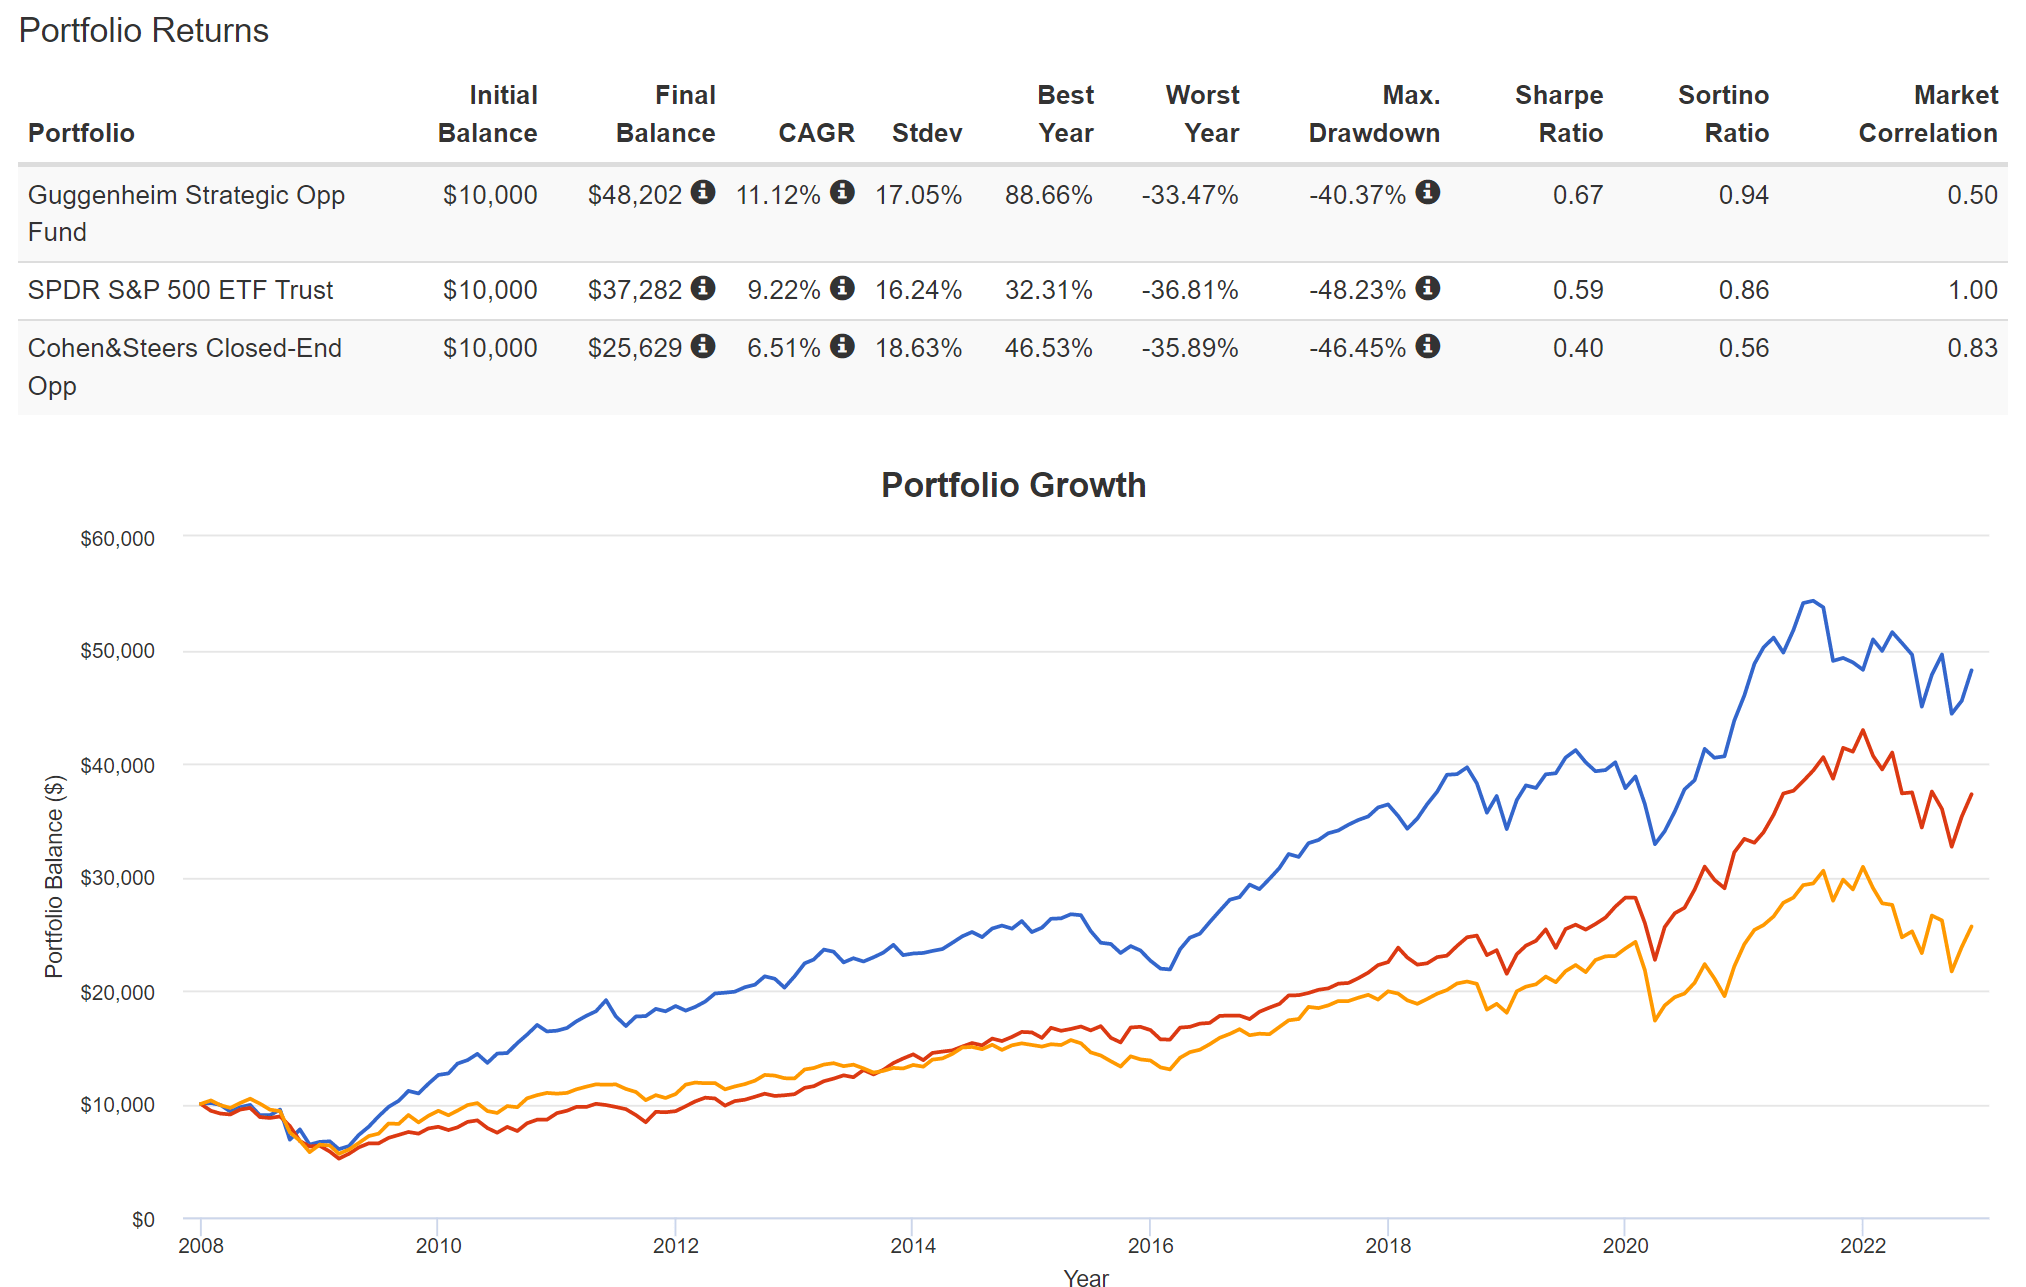
GOF’s lower volatility
It’s even more impressive that GOF achieved the above superior performance with lower, not higher, volatility. As you can see from the chart below, admittedly GOF suffered slightly higher volatility than SPY on average as measured by the standard deviation (as highlighted in the yellow box). To be more specific, its standard deviation of 17.1% is slightly above SPY’s 16.2%. However, as a long-term investor and believer in a barbell model, I always recommend my readers to ignore the daily fluctuations and focus more on the extreme scenarios in the longer term.
As highlighted in the red box below, in terms of worst-year performance, GOF’s 33.5% is actually better than both SPY (-36.8% and FOF -35.9%) despite the use of leverage. And in terms of max drawdown, the picture is even more favorable for GOF. Its worst drawdown has been 40.4%, better than both SPY’s 48.2% and FOF’s 46.5% by a sizable margin.
Source: Portfolio Visualizer, Silicon Cloud Technologies LLC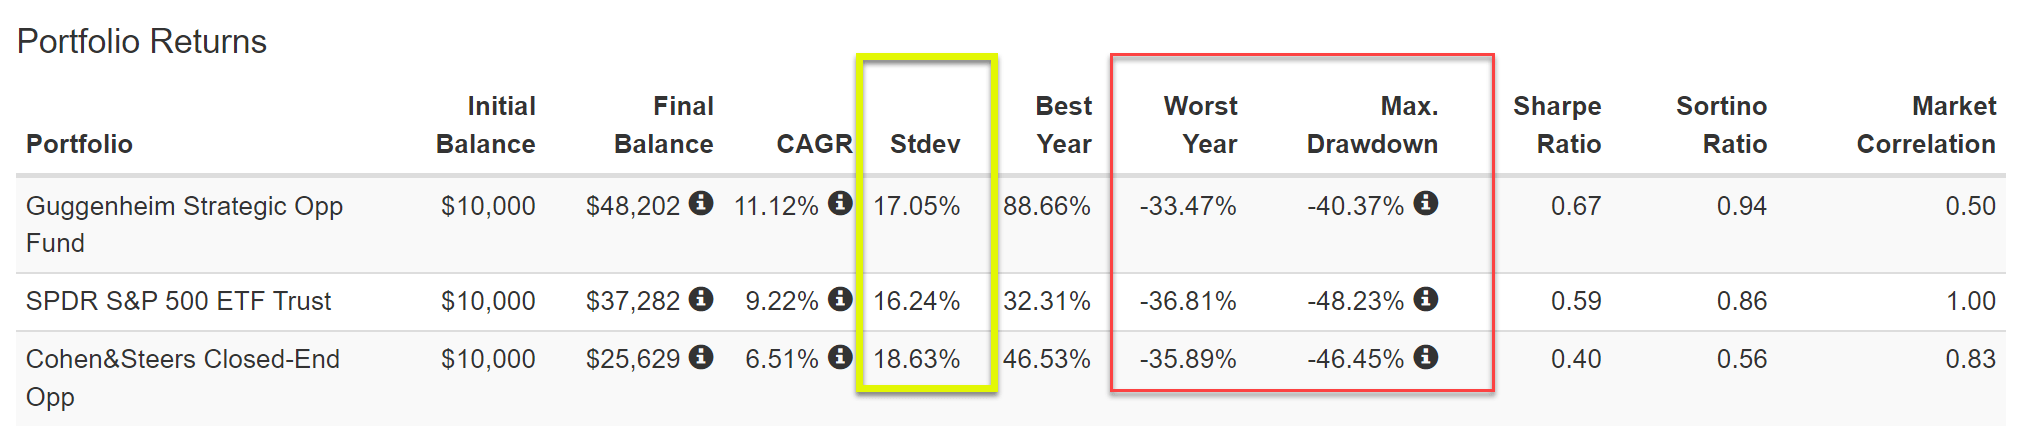
Other risks and final thoughts
Besides the high premium above its NAV, investment in GOF could face other risks as well. For example, interest rates could climb from the current level. Interest rates serve as the gravity of all asset valuation. And a rising interest could pressure the valuation of GOF. At the same time, because GOF applies considerable leverage as aforementioned, a rising interest rate could cause its borrowing cost to rise.
To conclude, the GOF fund combines quite a few ideal traits of a dividend fund: high current yield (13%+), monthly payouts, and also good capital appreciation. However, the fund now trades at a 25.9% premium above its NAV, near a peak level in 5 years. Its premium Z-score on a 1-year basis is 0.9, close to a 1-sigma event and signaling substantial premium beyond random fluctuations.
A closer examination shows that the fund also offers good prospects for total capital appreciation given management’s expertise in niche and alternative opportunities. The fund has outperformed both the broader equity market and the CEF market by a good margin in the past. It is even more impressive that the fund has achieved its superior performance with lower worst drawdowns. As such, I am seeing more positives than negatives here (the only negative really is the high premium as I see).
Be the first to comment