

peshkov/iStock via Getty Images
The risk of recession is rising as the economic data weekends due to several factors.
- high inflation causing consumers to pull back on discretionary spending
- rising interest rates from the Fed (tightening financial conditions)
- tough comps (last year’s record stimulus resulted in a boom year for growth)
The good news is that almost all blue-chip economists expect a mild recession (assuming we get one at all).
Deutsche Bank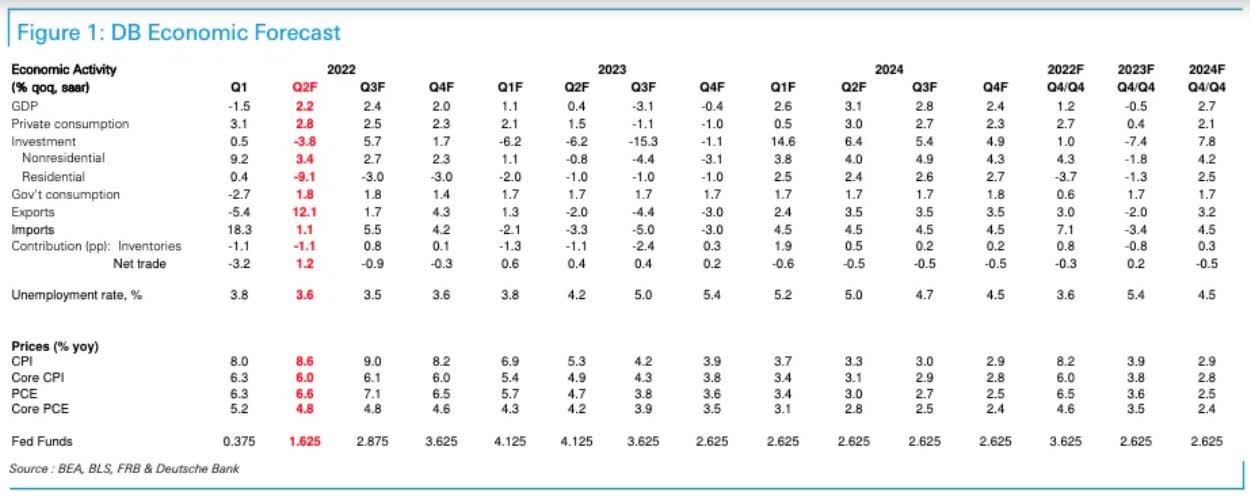
For example, Deutsche Bank is one of the members of the blue-chip consensus.
- the 16 most accurate economist teams based on historical forecasts
DB was one of the first economist teams to forecast a recession in 2023 and their latest forecast is for a six-month recession in the second half of 2023.
- 0.5% total GDP decline in 2023
- the 2nd mildest in US history behind 2021’s 0.4% decline
Here is some further good news?
David Rice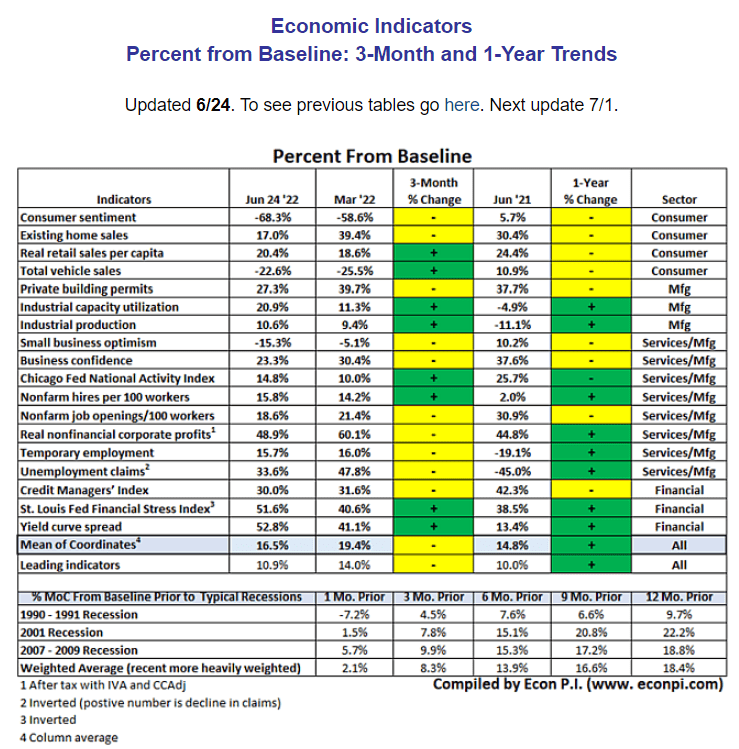
Currently, the average of 18 economic indicators is still 17% above historical baseline since 1991. What does this likely mean?
- a potential recession isn’t likely to start for nine more months
- we might still avoid one entirely (just very slow growth)
JPMorgan, Bank of America, and Goldman Sachs (all blue-chip economist firms) think growth could slow to 1% though we’ll avoid an outright recession.
But what if we do get a recession? In that case, a focus on safety and quality first, and prudent valuation, and sound risk management always is a great way to sleep well at night while protecting your portfolio’s income.
I’ve recently covered a few of my favorite dividend ETFs to help the smart long-term investor ride out the potential 2023 recession in safety and splendor.
- 4 Dividend ETFs You’ll Want To Own In The Next Recession
- 3 Incredible Dividend ETFs You’ll Want To Own In The Next Recession
Today I want to highlight one of my favorite dividend ETFs, one that:
- has grown its earnings in the last two recessions (the 2 worst since the Great Depression)
- has grown its dividends in the last two recessions
- has one of the most impressive annual dividend track records in its industry
What kind of incredible dividend ETF can do such things? Growing its earnings and income in two of the worst recessions of the last 75 years? Surely it must be consumer staples, utilities, or healthcare right?
While all of those defensive sectors tend to outperform in a recessionary bear market, the dividend ETF that’s most likely to grow earnings and dividends in a recession might shock you.
Invesco QQQ Trust (QQQ): The King Of Consistent Growth In Extreme Recessions
- Note that (QQQM) is identical to QQQ and was invented to create a lower-cost version
- 0.15% expense ratio vs 0.2%
- QQQ is more liquid and thus preferred by institutional investors
First let me prove that the Nasdaq, while not a perfect dividend ETF, is absolutely incredible when it comes to growing earnings, cash flows, and dividends in even the most severe economic times.
Annual Growth Rates Of QQQ
FactSet Research Terminal
In 2008 and 2009 QQQ’s earnings grew 16%, while in the pandemic they grew 9%.
Dividends rose by 17% during the Great Recession and 9% during the Pandemic.
Cash flow grew 17% in the Great Recession and 11% in the Pandemic.
Sales grew 4% in the GFC and 6% during the Pandemic.
How impressive are these achievements? Let’s compare them to the S&P 500 and defensive (recession-resistant) sector ETFs.
Annual Growth Rates Of SPY (S&P 500)
FactSet Research Terminal
In 2008 and 2009 SPY’s earnings grew contracted by 30%, while in the pandemic they shrank 14%.
Dividends shrank 20% during the Great Recession and 3% during the Pandemic.
Cash flow shrank 7% in the Great Recession and 7% in the Pandemic.
Sales contracted 11% in the GFC and 5% during the Pandemic.
This is actually pretty consistent with the S&P 500’s historical growth rates in recessions.
Multipl.com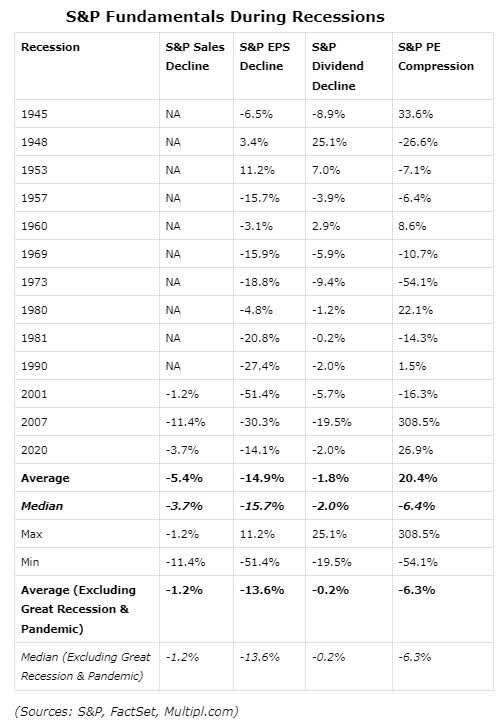
The historically average earnings decline in recessions since WWII is about 15% and 13.6% excluding the Pandemic and GFC.
What about defensive sectors like healthcare, consumer staples, and utilities?
Annual Growth Rates Of IYK (Consumer Staples)
FactSet Research Terminal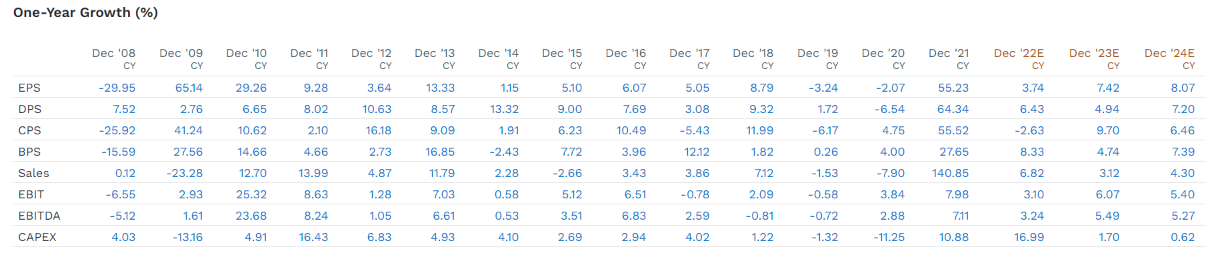
In 2008 and 2009 IYK’s earnings contracted by 16%.
- Though that included a 30% contraction in 2008
During the pandemic, they shrank by 2%.
Dividends grew 11% during the Great Recession and fell 7% during the Pandemic.
Cash flow grew 4% in the Great Recession (though contracted by 26% in 2008) and grew 5% in the Pandemic.
Sales contracted 23% in the GFC and 8% during the Pandemic.
Annual Growth Rates Of VHT (Healthcare)
FactSet Research Terminal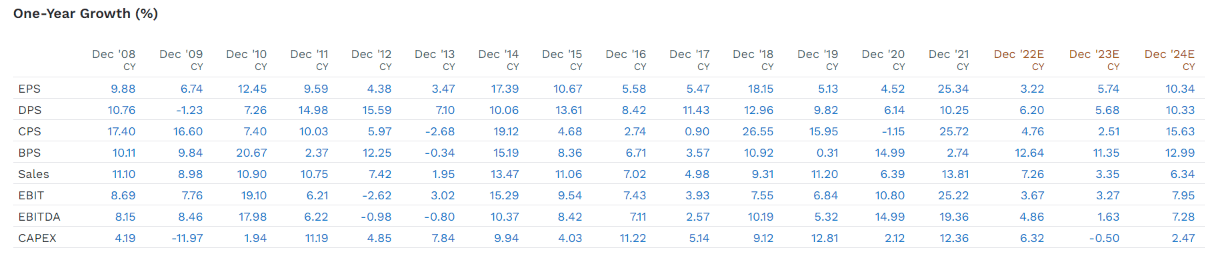
In 2008 and 2009 VHT’s earnings grew by 17%. During the pandemic, they grew by 5%.
Dividends grew 10% during the Great Recession (though slightly fell in 2009) and grew 6% during the Pandemic.
Cash flow grew 37% in the Great Recession and fell 1% in the Pandemic.
Sales grew 21% in the GFC and 6% during the Pandemic.
Annual Growth Rates Of VPU (Utilities)
FactSet Research Terminal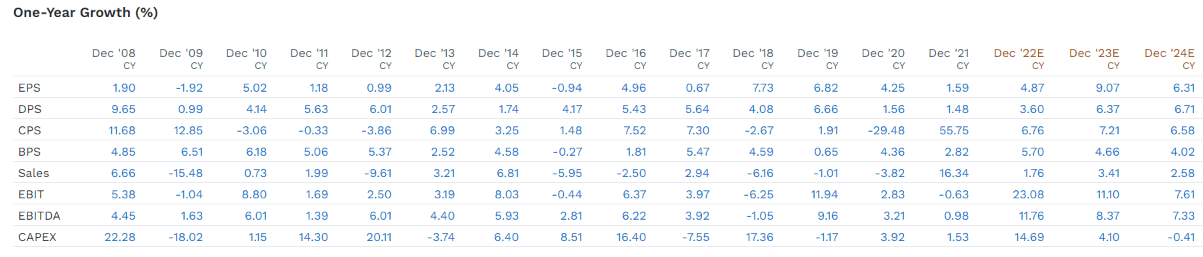
In 2008 and 2009 VHT’s earnings were flat. During the pandemic, they grew by 4%.
Dividends grew 11% during the Great Recession and grew 2% during the Pandemic.
Cash flow grew 27% in the Great Recession and fell 30% during the Pandemic.
Sales shrank 9% in the GFC and 4% during the Pandemic.
Bottom Line: QQQ Is The Only Dividend ETF I Know Of To Grow Sales, Earnings, Cash Flow, And Dividends In All 3 Recessionary Years Since 2008
QQQ might not be low volatility, and thus a traditionally defensive ETF, but when it comes to corporate fundamentals it’s as defensive as it gets.
So let’s take a closer look at why QQQ and QQQM are my favorite tech-focused dividend growth ETFs.
Fundamentals: Very Strong But Not Without Fault
There is one major flaw in how QQQ and QQQM is constructed.
Morningstar Summary
Illogical index construction overshadows tremendous performance.
Invesco QQQ has turned in exceptional performance over the past 15 years, but its Nasdaq-only focus arbitrarily restricts its opportunity set and breeds sector concentration. It retains its Morningstar Analyst Rating of Neutral.
The rules underpinning the construction of the Nasdaq-100 Index, which this fund tracks, are borne out of Nasdaq’s desire to promote their exchange–not investment rationale. The benchmark plucks the 100 largest non-financials firms listed on the Nasdaq and weights them by market cap. It automatically excludes stocks listed elsewhere, which shrinks the fund’s opportunity set for no economic reason. Some of the large-cap market’s best recent performers, like AbbVie ABBV and Eli Lilly LLY, are excluded because of their New York Stock Exchange listings. And should one of the fund’s marquee holdings move from the Nasdaq, the fund would have no choice but to sell it.” – Morningstar
The major downside to QQQ as Morningstar points out is that it’s a Nasdaq-only ETF.
- so no LOW or MA, for example, which are NYSE
It also has some of the highest sector concentrations of any major ETF.
Portfolio Fundamentals
(Source: Morningstar)
The Nasdaq’s forward PE is still a bit elevated relative to its long-term average of 19.
Though on a cash-flow basis it’s potentially as much as 30% undervalued according to Morningstar analysts.
Almost 13% long-term growth is what analysts expect from QQQ over time.
- vs 8.5% for the S&P 500 and 8.9% for the dividend aristocrats
Currently, analysts expect 13.7% long-term total returns from the Nasdaq.
- similar to its historical returns
(Source: Morningstar)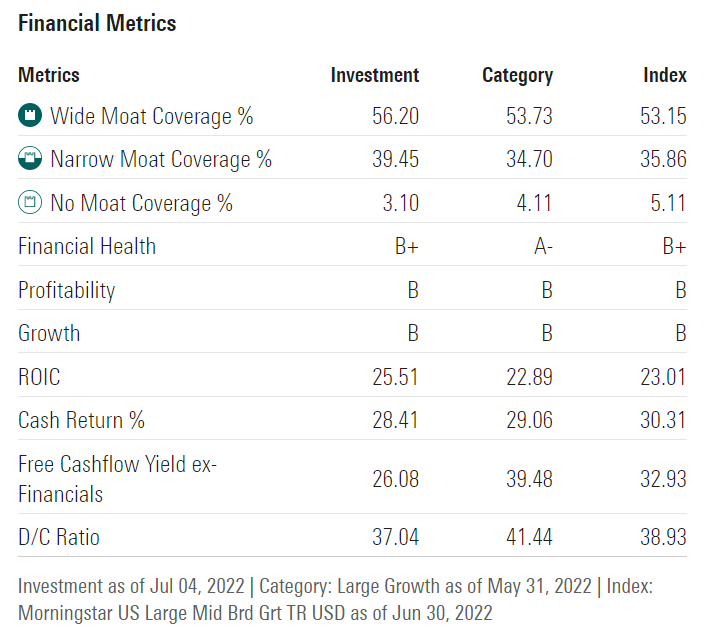
97% wide and narrow moat companies are exceptional as is B+ financial health.
- B+ is the 2nd highest financial health score I’ve seen from any dividend ETF
Free cash flow yield of 26% is very attractive as is the 37% payout ratio on dividends.
(Source: Morningstar)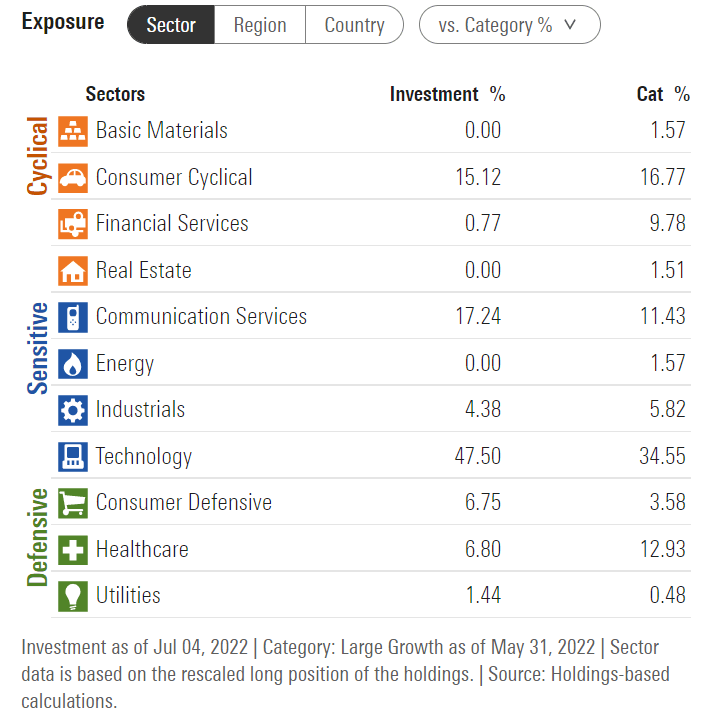
How tech-heavy is the Nasdaq 100? 65% including communications (GOOG and FB). Add in AMZN and TSLA (40% of consumer discretionary) and it’s about 71% tech.
- zero basic materials, energy, and REIT exposure
- QQQ needs to be diversified with individual companies/other ETFs if you want to own it
- but as far as tech ETFs go, it’s one of the best
(Source: Morningstar) (Source: Morningstar) (Source: Morningstar)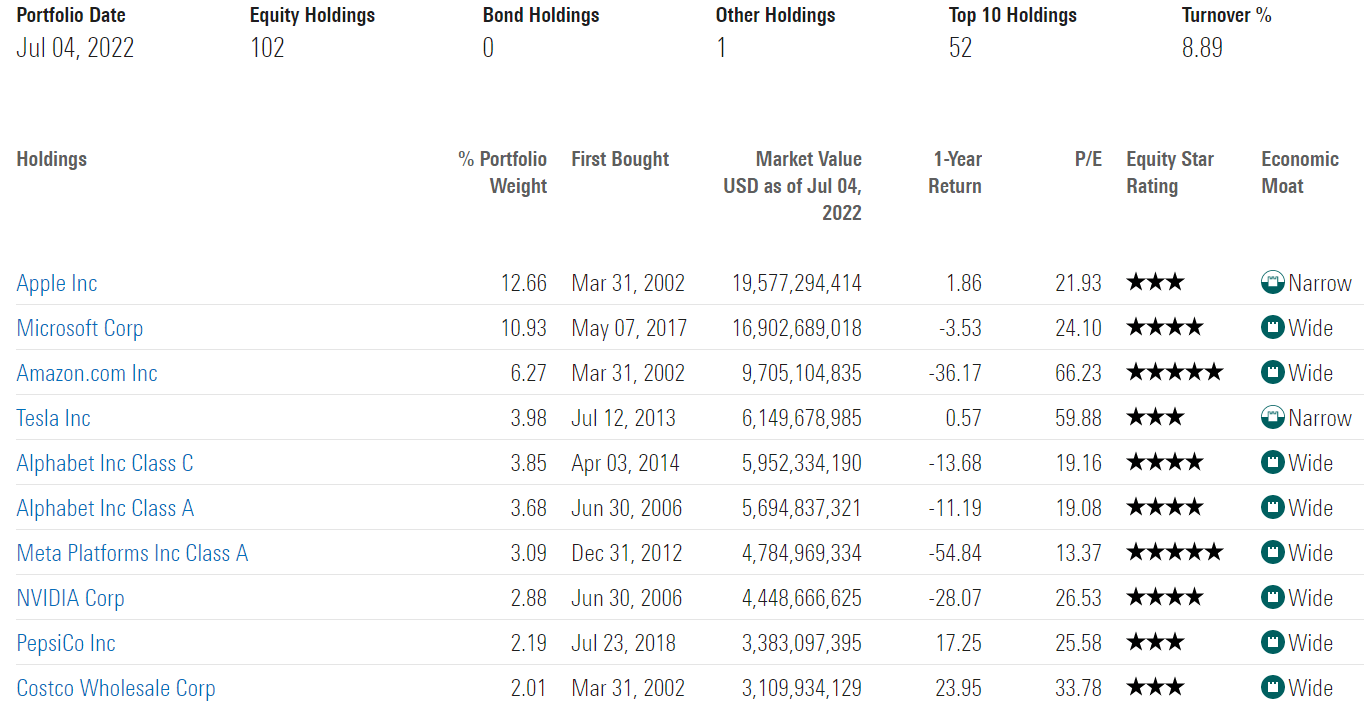
QQQ is kind of like the Berkshire approach to wide moat large-cap growth.
- very concentrated in the world’s best companies
- 51% in the top 10 names
You might be surprised that owning QQQ means owning relatively large positions in PEP, COST, and HON.
- one of the most Ultra SWAN concentrated portfolios in the world
- 6 of the top 10 QQQ holdings are Ultra SWANs
Historical Returns: QQQ Is The King Of Growth ETFs
There are a lot of excellent alternatives to the Nasdaq when it comes to large-cap growth.
Both of these low-cost ETFs offer far more diversified portfolios of the best growth companies in America.
- the top half of each respective index
Both avoid the inherent flaw of owning just Nasdaq listed companies, but none can match QQQ (and QQQM) for historical returns.
The future doesn’t repeat, but it often rhymes.” – Mark Twain
Past performance is no guarantee of future results, but studies show that blue-chips with relatively stable fundamentals over time offer predictable returns based on yield, growth, and valuation mean reversion.
Bank of America
So let’s see how QQQ compares to its more diversified and better-constructed peers.
Historical Returns Since November 2000 (Tech Crash)
(Source: Portfolio Visualizer Premium)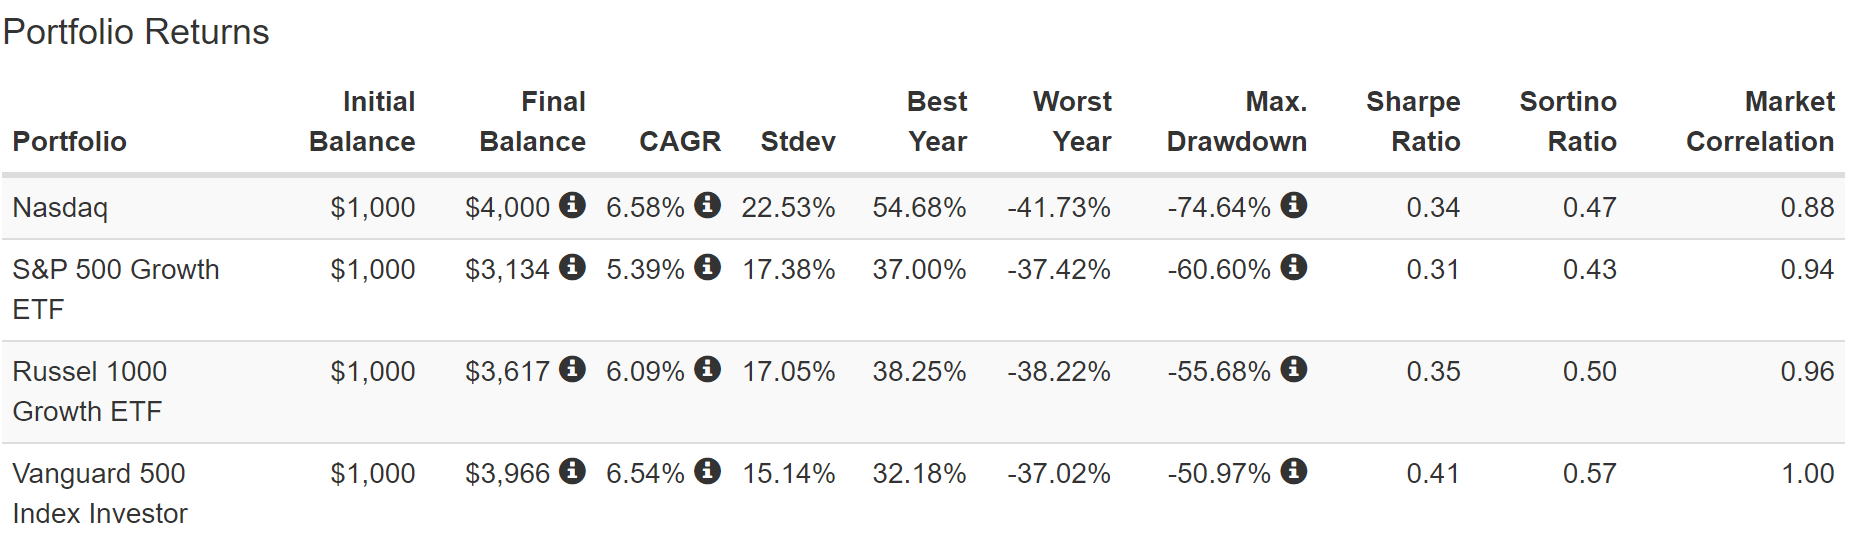
QQQ slightly outperformed SPYG and IWF though with far higher volatility. It also kept up with the S&P 500 over the last 22 years.
But wait a second? If QQQ delivered market-level returns with higher volatility, then why would anyone want to own it?
(Source: Portfolio Visualizer Premium)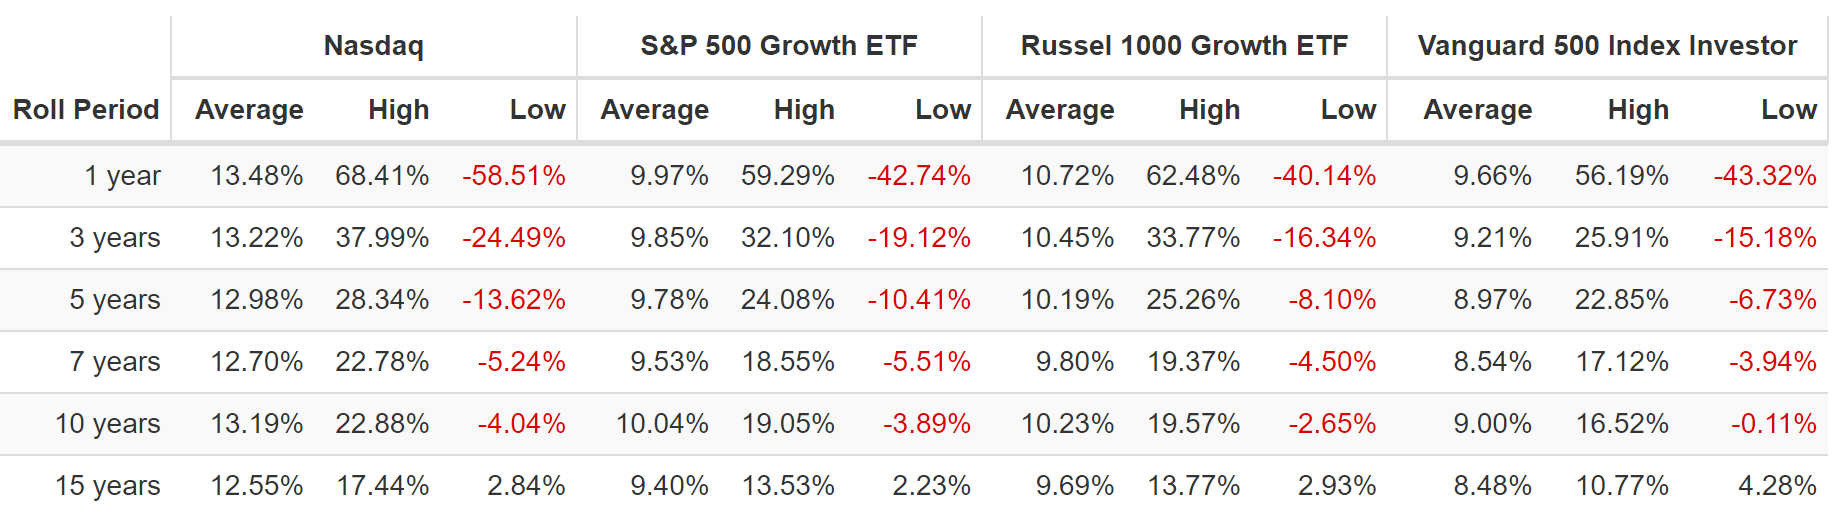
Because its average annual return was 13.5%, which is about 35% more than its growth peers.
Even the average 15-year return of 12.6% was far better than its growth alternatives.
Note that QQQ’s historical returns of 12.5% to 13.5% are what analysts expect in the future.
(Source: Portfolio Visualizer Premium)
During the Great Recession, growth didn’t outperform the S&P 500 despite much better fundamentals.
- in a market panic/margin call correlations tend to approach one
But during the Pandemic growth did outperform the market with QQQ proving the standout.
- for context, a 60/40 fell 12% and QQQ basically matched it
(Source: Portfolio Visualizer Premium)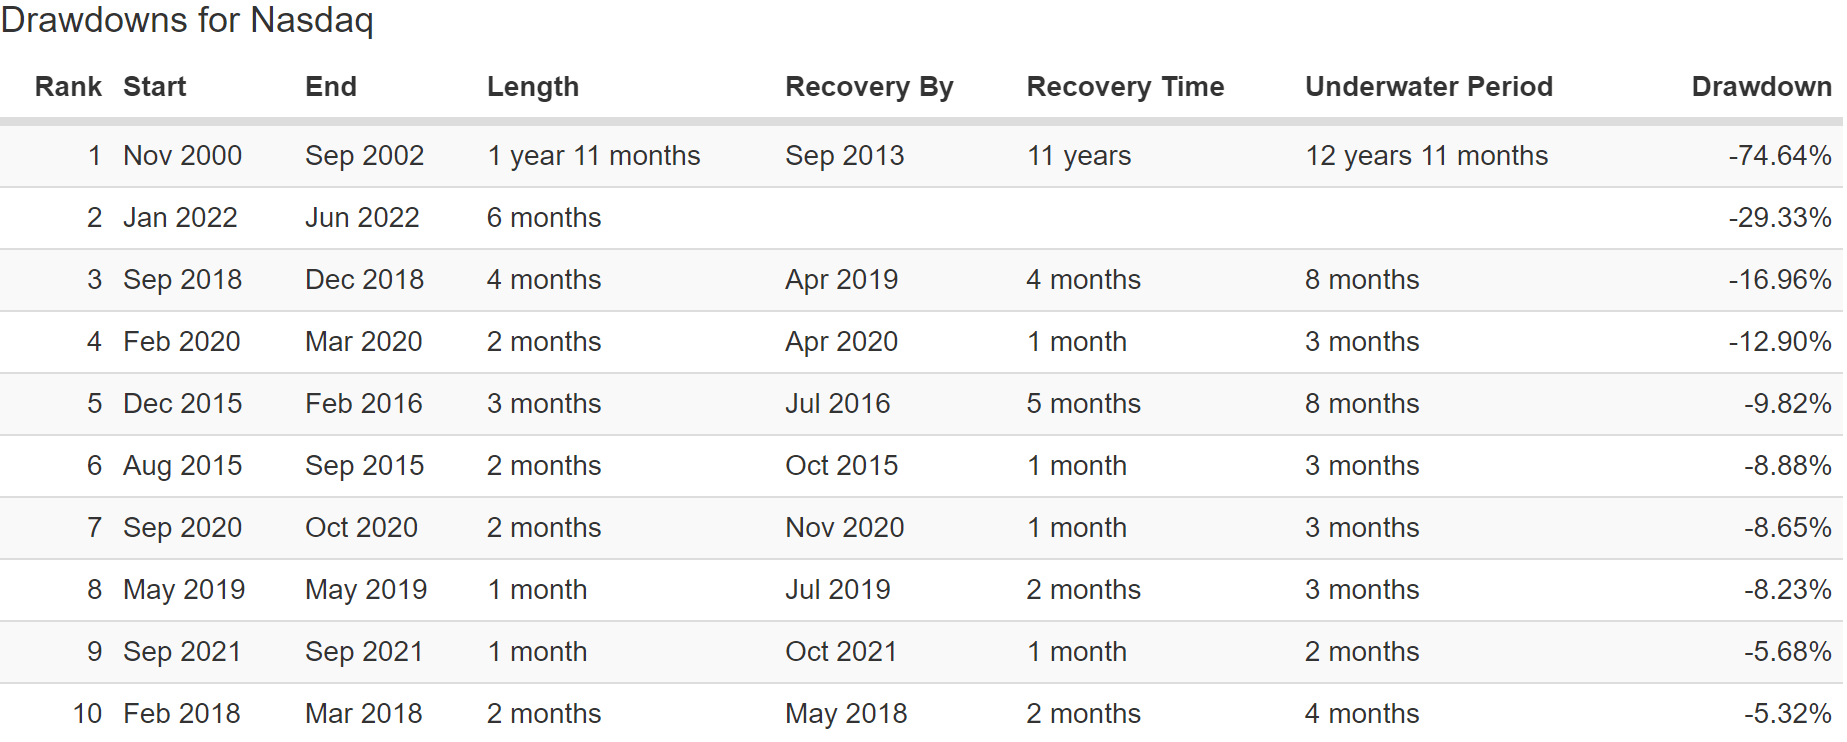
Not surprisingly given that this bear market was kicked off by soaring interest rates, the Nasdaq is having a bad year.
- -29% vs -28% SPYG, -28% IWF, and -20% S&P
But take a look at how QQQ does when it comes to what income investors care most about, long-term income growth.
The King Of Long-Term Dividend Growth
| Portfolio | 2005 Income Per $1,000 Investment | 2021 Income Per $1,000 Investment | Annual Income Growth | Starting Yield |
2021 Yield On Cost |
| S&P 500 | $18 | $65 | 8.36% | 1.8% | 6.5% |
| S&P 500 Growth | $4 | $26 | 12.41% | 0.4% | 2.6% |
| Russel 1000 Growth | $6 | $25 | 9.33% | 0.6% | 2.5% |
| Nasdaq | $2 | $24 | 16.80% | 0.2% | 2.4% |
(Source: Portfolio Visualizer Premium)
Over the last 16 years, the S&P has delivered a respectable 8.4% annual dividend growth rate while most growth ETFs did even better.
But when it comes to dividend growth no growth ETF comes close to the Nasdaq’s almost 17% annual growth rate. What about the future?
| Analyst Consensus Income Growth Forecast | Risk-Adjusted Expected Income Growth | Risk And Tax-Adjusted Expected Income Growth |
Risk, Inflation, And Tax Adjusted Income Growth Consensus |
| 17.1% | 12.0% | 10.2% | 7.6% |
(Source: Portfolio Visualizer Premium)
Analysts expect very similar dividend growth from the Nasdaq in the future, of about 17%. When you adjust for the risk of these companies not growing as expected, inflation, and taxes you get a more modest 8% real expected income growth rate.
Now compare that to what they expect from the S&P 500.
| Time Frame | S&P Inflation-Adjusted Dividend Growth | S&P Inflation-Adjusted Earnings Growth |
| 1871-2021 | 1.6% | 2.1% |
| 1945-2021 | 2.4% | 3.5% |
| 1981-2021 (Modern Falling Rate Era) | 2.8% | 3.8% |
| 2008-2021 (Modern Low Rate Era) | 3.5% | 6.2% |
| FactSet Future Consensus | 2.0% | 5.2% |
(Sources: S&P, FactSet, Multipl.com)
What about a 60/40 retirement portfolio?
- 0.5% consensus inflation, risk, and tax-adjusted income growth.
In other words, the Nasdaq offers
- almost 4X its long-term inflation-adjusted consensus income growth potential
- 15X better long-term inflation-adjusted income growth than a 60/40 retirement portfolio
- much safer dividends than the S&P 500 historically
This is the power of wide-moat dividend growth investing in some of the best growth stocks on earth.
Bottom Line: The Nasdaq Is The Most Likely Dividend ETF To Grow Its Earnings, Cash Flow, And Dividends In A Recession
The Nasdaq tends to have higher volatility than the broader market and so isn’t traditionally thought of as defensive. But in terms of fundamentals, such as sales, earnings, cash flow, and dividends, it’s the most defensive dividend growth ETF I’ve ever found.
And in a 2023 recession, the Nasdaq might actually start to act defensively for one major reason.
Daily Shot 
Tech is the most rate-sensitive sector historically and a mild 2023 recession is likely to be categorized by two main features.
- falling interest rates (a tailwind for tech which is one of the most beaten-down sectors)
- weak/negative growth for most sectors
What sector is likely to do relatively well when growth is weak? The one with the strongest secular growth trends.
What sector is likely to do relatively well when rates are falling? The one that’s the most rate sensitive.
Don’t get me wrong, I don’t quite agree with Morningstar’s analysts that the QQQ is almost 30% undervalued.
- 9.6X cash flow for almost 13% growth rates does fit Peter Lynch’s growth at a reasonable price though
- as does the forward cash-adjusted PE of 12.7X
Could QQQ and QQQM (the low-cost version of the ETF) keep falling? Absolutely, no one can say with certainty when this bear market will end.
Could interest rates end up going much higher than the bond market is currently pricing in?
- a peak Fed funds rate of 3.25%
Absolutely they could. In fact, Research Affiliates thinks that inflation could peak at close to 11% by the end of the year.
But if the blue-chip economist consensus is right? That we get a mild recession in 2023 that causes inflation to fall back to 2.5% and sees interest rates fall from current levels?
Then blue-chip dividend growth tech giants like what QQQ and QQQM are packed to the rafters with could be a very attractive long-term investment opportunity.
No the QQQ’s construction isn’t optimal. And no, its yield of 1.0% is hardly something that will appeal to all income investors.
But if your goal is a dividend growth ETF that has the best long-term income growth potential, as well as the ability to deliver superior long-term returns?
If your goal is a wide moat Ultra SWAN quality portfolio of the world’s best cash-rich companies that historically grow sales, earnings, cash flow, and dividends in even severe recessions?
Well, then QQQ and QQQM are two of the best choices right now. In fact, I consider them the best way to gain diversified tech exposure for the average dividend growth investor.
Be the first to comment