

Dan Dalton/iStock via Getty Images
Acquiring stock in rapidly growing companies can be incredibly rewarding. At the same time, however, that strategy is fraught with risks. The biggest risk is overpaying for a firm relative to the growth that it can achieve, particularly at a time when extreme market volatility makes investors cautious. But once the company in question experiences that volatility, upside potential could be on the table. One company that I follow that has taken a rather negative trajectory despite its continued growth happens to be Grocery Outlet Holding Corp (NASDAQ:GO), a firm that operates as a high-growth, extreme-value retailer that has 431 locations nationwide. Over the past couple of months, shares have taken a beating, driven by mixed bottom line results and the fact that shares looked incredibly pricey to begin with. While I wouldn’t exactly say that the company has attractive upside moving forward, I do think that it is much closer to fair value than it was previously. Because of this, I have decided to change my rating on the company from a ‘sell’ to a ‘hold’, reflecting my belief that it should generate returns that more or less match the broader market for the foreseeable future.
A wild ride
Back in early August of this year, I wrote a bearish article on Grocery Outlet. I found myself impressed with the company’s business model, including the financial performance that the model allowed the company to achieve over an extended timeframe. Although the growth of the company continued into the 2022 fiscal year, I could not get past the fact that shares looked incredibly pricey. That led me to rate the company a ‘sell’, reflecting my belief at that time that shares would measurably underperform the broader market moving forward. So far, that call has proven to be pretty good. While the S&P 500 is down by 9.7%, shares of Grocery Outlet have dropped by 29.7%.
Author – SEC EDGAR Data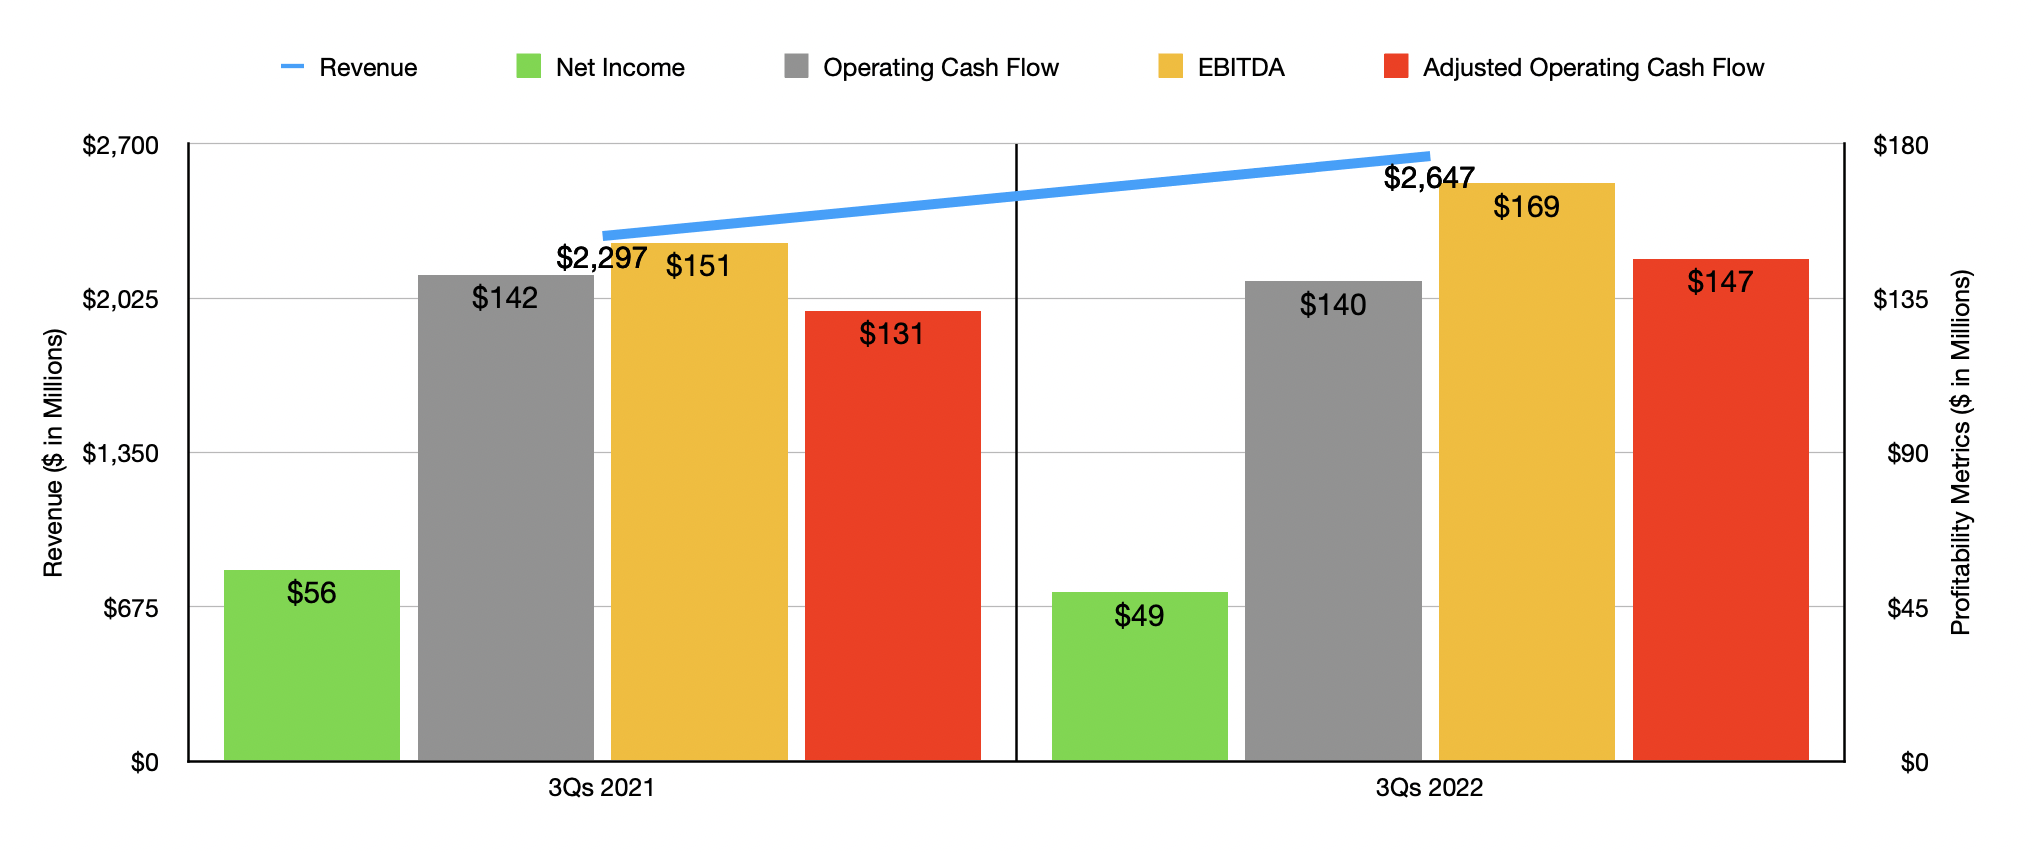
To see why this disparity exists, we should first dig into the fundamental performance of the company recently. When I last wrote about it, we only had data covering through the first quarter of its 2022 fiscal year. Fast forward to today, and we now have data covering through the third quarter. For the first three quarters of the 2022 fiscal year in their entirety, sales came in at $2.65 billion. That’s 15.2% above the $2.30 billion generated the same time last year. This increase was driven by two primary factors. First and foremost, the company saw the number of stores it has an operation rise from 407 last year to 431 this year. And second, the company benefited from a 10.6% increase in comparable store sales. For the latest quarter alone, sales of the company came in at $918.2 million. That’s 19.4% higher than the $768.9 million reported the same time last year. The big driver was certainly the 15.4% increase in comparable store sales that the company benefited from. This is interesting to note because it shows that financial results in the latest quarter have been showing signs of improvement relative to earlier quarters this year.
It’s great to see sales increase. But this is only one measure of the health of the company. The more important measure would be profitability. For the first nine months of the 2022 fiscal year, net income for the business has been a bit weak, totaling $49.2 million in all. That’s down from the $55.7 million generated the same time last year. Other profitability metrics were rather mixed. As an example, operating cash flow also dropped, falling from $141.8 million to $139.9 million. If we adjust for changes in working capital, however, the metric would have risen from $131.3 million to $146.5 million. Meanwhile, EBITDA for the company also improved, shooting up from $151.1 million to $168.5 million.
Author – SEC EDGAR Data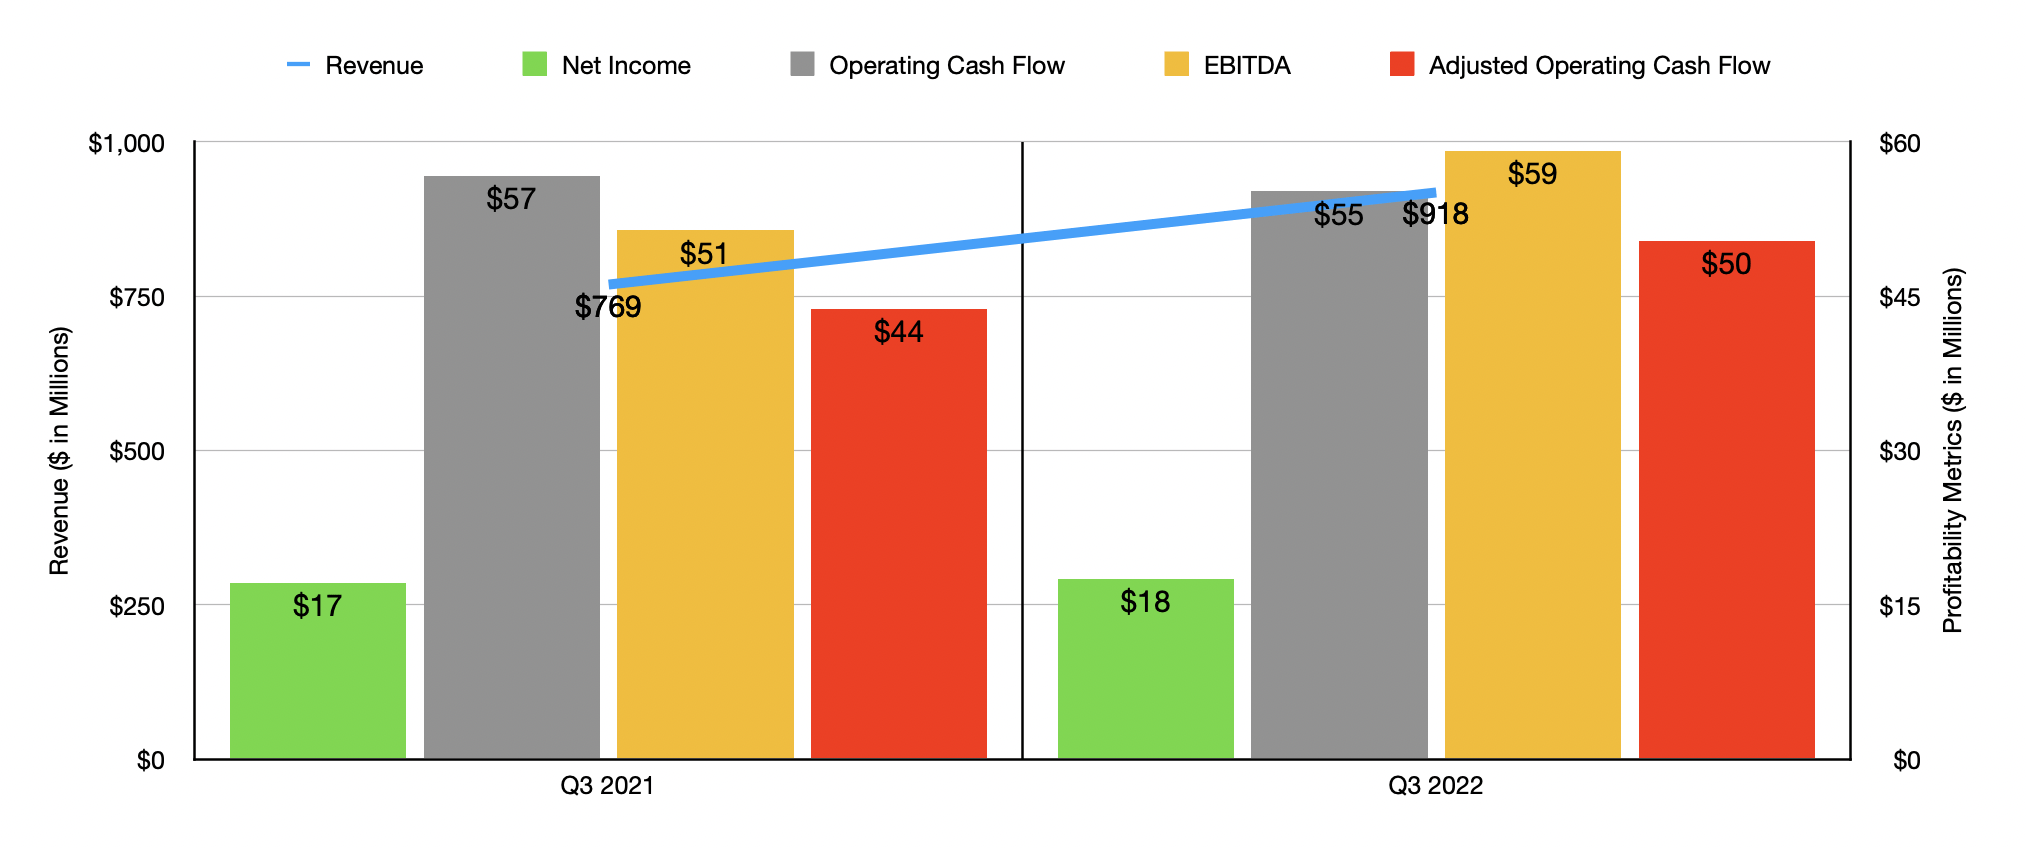
Just as was the case with sales, the bottom line results for the company’s third quarter alone have been looking up. Net income inched up from $17.1 million in the third quarter of 2021 to $17.5 million the same time this year. Admittedly, operating cash flow still fell, dropping from $56.7 million to $55.2 million. But if we adjust for changes in working capital, it would have risen from $43.8 million to $50.4 million. And over that same window of time, we also would have seen a healthy improvement in EBITDA, with the metric climbing from $51.4 million last year to $59.1 million this year.
Mixed fundamental performance in the early parts of this year may have had an impact on investor sentiment. At the same time, it’s great to see some of the fundamental performance figures for the company improve. Still, any sort of volatility at a time of tremendous market uncertainty is bound to have some impact on investor sentiment. But more importantly, there’s also the fact that shares of the company just looked significantly pricey. Today, that price is coming down. You see, at present, management is forecasting revenue of $3.55 billion for the year. That’s up from the prior expected range of between $3.46 billion and $3.48 billion. This should be driven by an 11% rise in comparable store sales, up from the 8% to 8.5% management previously thought. The company is also expecting to add 26 net new stores, down from 28 in prior guidance. The increase in sales for the company is expected to improve profitability as well. For instance, EBITDA should now be around $224 million. Prior guidance called for it to be between $218 million and $223 million. Meanwhile, earnings per share should be around $1, translating to net income this year of $100.5 million. No guidance was given when it came to adjusted operating cash flow. But given the path that EBITDA it’s taking, a good estimate for that this year would be $192.6 million.
Author – SEC EDGAR Data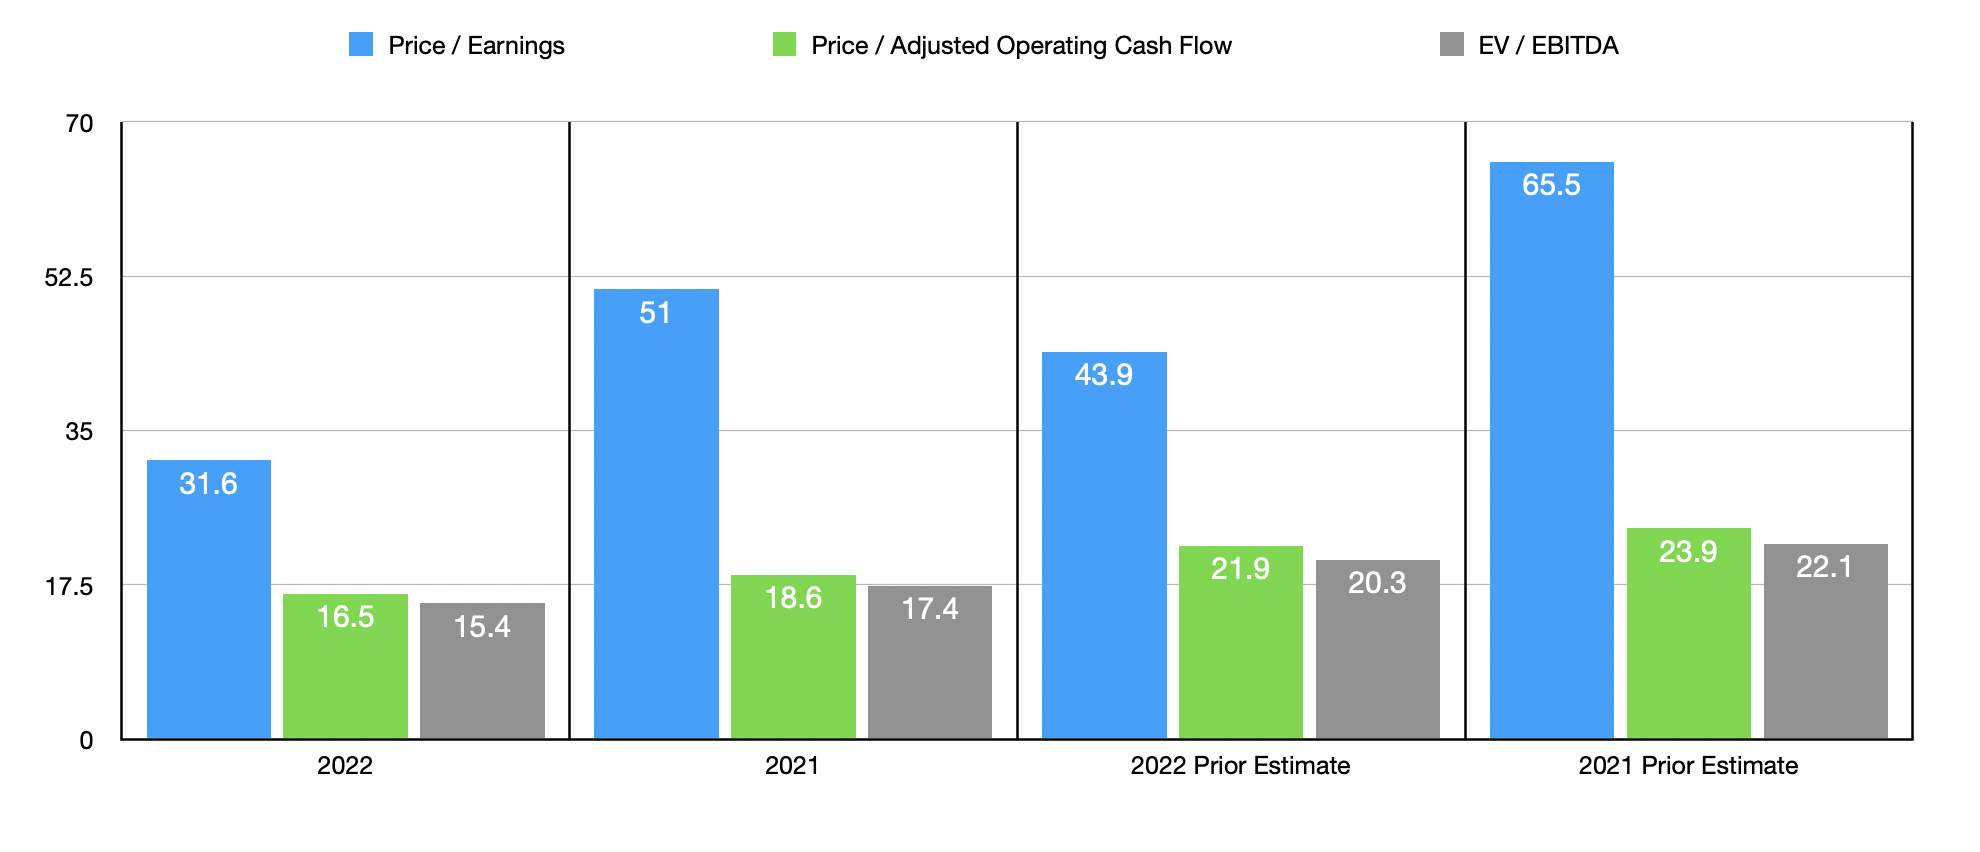
Taking these figures, I calculated that the company is trading at a forward price-to-earnings multiple of 31.6, a forward price to adjusted operating cash flow multiple of 16.5, and a forward EV to EBITDA multiple of 15.4. As you can see in the chart above, this pricing is more favorable than if we used data from the 2021 fiscal year. It also represents a meaningful improvement over how shares were priced when I last wrote about the firm. As part of my analysis, I also compare the company to five similar businesses. On a price-to-earnings basis, these companies ranged from a low of 6.9 to a high of 23.4. Using the price to operating cash flow approach, the range was between 3.7 and 10.6. And using the EV to EBITDA Approach, the range was between 3.2 and 11.8. In all three cases, Grocery Outlet was the most expensive of the group.
| Company | Price / Earnings | Price / Operating Cash Flow | EV / EBITDA |
| Grocery Outlet Holding Corp | 31.6 | 16.5 | 15.4 |
| Sprouts Farmers Market (SFM) | 14.4 | 9.1 | 5.2 |
| Natural Grocers by Vitamin Cottage (NGVC) | 10.1 | 5.1 | 4.1 |
| The Kroger Co (KR) | 14.6 | 6.5 | 6.0 |
| Albertsons Companies (ACI) | 6.9 | 3.7 | 3.2 |
| Casey’s General Stores (CASY) | 23.4 | 10.6 | 11.8 |
Takeaway
Typically, you wouldn’t want to buy a company with shares that are trading above what their peers are trading for. Having said that, the rapid growth achieved by Grocery Outlet has been impressive and will likely continue for the foreseeable future. I still do think shares are a bit lofty and I seriously struggled between rating at a ‘hold’ and keeping it at the ‘sell’ I had it at previously. So long as the company can continue to expand, I do think that it’s an interesting prospect for investors to consider. And while shares are expensive, I would make the case that the growth the company has achieved and continues to achieve does warrant some sort of premium relative to similar businesses. But given how pricey the stock is on an absolute basis still, and when factoring in broader economic uncertainty, I do think a ‘hold’ rating for the company now makes sense.
Be the first to comment