

JHVEPhoto
Investment Thesis
- In this comparative analysis on Alphabet (NASDAQ:GOOG) (NASDAQ:GOOGL) and Meta (NASDAQ:META), I come to the conclusion that I would select Alphabet over Meta if I could only invest in one of the two companies.
- Alphabet has a higher brand value than Meta ($263,425M compared to Facebook’s brand value of $101,201M as according to Brand Finance), a higher cash position ($124,997M in Total Cash & ST Investments compared to $40,489M) and a stronger credit rating by Moody’s (Aa2 compared to A1).
- I see an investment in Alphabet as being less risky, particularly due to the fact its business is less dependent on advertising than Meta’s.
- I currently rate Meta as a buy and Alphabet as a strong buy. I consider Alphabet to be even more attractive when it comes to risk and reward.
- My investment thesis is underlined by the results of the HQC Scorecard in which Alphabet scores 91/100 while Meta scores 80/100. Furthermore, it is supported by the results of the Seeking Alpha Quant Ranking, in which Alphabet is ranked 2nd within the Interactive Media and Services Industry while Meta is ranked 14th (both out of 61).
- At the current stock prices, I expect a compound annual rate of return of about 18% for Alphabet and one of 16% for Meta. Both are based on the calculations of my DCF Models.
The Competitive Positions of Alphabet and Meta
For both Alphabet and Meta I see the enormous amount of data and their ability to analyse and use this data as strong competitive advantages over their rivals in the Interactive Media and Services Industry. In addition to that, both companies are among the top 10 of the world’s most valuable brands: according to Brand Finance, Google is ranked 3rd with a brand value of $263,425M and Facebook is ranked 7th with a brand value of $101,201M.
Both Alphabet and Meta have a proven ability of successfully integrating new businesses into their companies. One of Alphabet’s most successful acquisitions was YouTube, for which the company paid $1.65 billion back in 2006. Meta acquired Instagram for $1.0 billion in 2012 and WhatsApp for $19 billion in 2014.
The enormous financial strength of Alphabet and Meta provide them with another significant competitive advantage: while Alphabet has $124,997M in Total Cash & ST Investments at this moment in time, Meta currently disposes of $40,489M. Having a high amount of cash puts both companies in a position to make large acquisitions in order to ensure further future growth. This financial strength is also backed up by a Moody’s credit rating of Aa2 for Alphabet and A1 for Meta.
Both Alphabet and Meta have strong competitive advantages. However, I would like to summarize that Alphabet is slightly ahead of Meta when it comes to brand value (Alphabet has a brand value of $263,425M while the one of Facebook is $101,201M) and when considering financial strength (Alphabet has a higher cash position and a stronger credit rating by Moody’s). This supports my investment thesis to prefer Alphabet over Meta.
The Valuation of Alphabet and Meta
Discounted Cash Flow [DCF]-Model
In terms of valuation, I have used the DCF Model to determine the intrinsic value of Alphabet and Meta. The method calculates a fair value of $141.71 for Alphabet and $190.02 for Meta. At the current stock prices, this gives Alphabet an upside of 42.90% and Meta an upside of 35.30%.
My calculations are based on the following assumptions as presented below (in $ millions except per share items):
|
Alphabet |
Meta |
|
|
Company Ticker |
GOOG |
META |
|
Revenue Growth Rate for the next 5 years |
8% |
5% |
|
EBIT Growth Rate for the next 5 years |
8% |
5% |
|
Tax Rate |
15.7% |
16.7 |
|
Discount Rate [WACC] |
7.75% |
7.75% |
|
Perpetual Growth Rate |
4% |
3% |
|
EV/EBITDA Multiple |
12x |
7.2x |
|
Current Price/Share |
$99.17 |
$140.41 |
|
Shares Outstanding |
13,044 |
2,688 |
|
Debt |
$28,810 |
$16,679 |
|
Cash |
$17,936 |
$12,681 |
|
Capex |
$29,816 |
$32,000 |
Source: The Author
Based on the above, I calculated the following results:
Market Value vs. Intrinsic Value
|
Alphabet |
Meta |
|
|
Market Value |
$99.17 |
$140.41 |
|
Upside |
42.90% |
35.30% |
|
Intrinsic Value |
$141.71 |
$190.02 |
Source: The Author
Internal Rate of Return for Alphabet
The Internal Rate of Return [IRR] is defined as the expected compound annual rate of return earned on an investment. Below you can find the Internal Rate of Return as according to my DCF Model (when assuming different purchase prices for the Alphabet stock).
At Alphabet’s current stock price of $99.17, my DCF Model indicates an Internal Rate of Return of approximately 18% for the company (while assuming a Revenue and EBIT Growth Rate of 8% for the next 5 years and a Perpetual Growth Rate of 4% afterwards). (In bold you can see the Internal Rate of Return for Alphabet’s current stock price of $99.17.) Please note that the Internal Rates of Return below are a result of the calculations of my DCF Model and changing its assumptions could result in different results.
|
Purchase Price of the Alphabet Stock |
Internal Rate of Return as according to my DCF Model |
|
$75.00 |
26% |
|
$80.00 |
24% |
|
$85.00 |
22% |
|
$90.00 |
21% |
|
$95.00 |
19% |
|
$99.17 |
18% |
|
$100.00 |
18% |
|
$105.00 |
16% |
|
$110.00 |
15% |
|
$115.00 |
13% |
|
$120.00 |
12% |
|
$125.00 |
11% |
Source: The Author
Internal Rate of Return for Meta
At Meta’s current stock price of $140.41, my DCF Model indicates an Internal Rate of Return of approximately 16% for the company (while assuming a Revenue and EBIT Growth Rate of 5% for the next 5 years and a Perpetual Growth Rate of 3% afterwards). (In bold you can see the Internal Rate of Return for Meta’s current stock price of $140.41.)
|
Purchase Price of the Meta Stock |
Internal Rate of Return as according to my DCF Model |
|
$120.00 |
21% |
|
$125.00 |
20% |
|
$130.00 |
19% |
|
$135.00 |
17% |
|
$140.00 |
16% |
|
$140.41 |
16% |
|
$145.00 |
15% |
|
$150.00 |
14% |
|
$155.00 |
13% |
|
$160.00 |
12% |
|
$165.00 |
12% |
|
$170.00 |
11% |
Source: The Author
Relative Valuation Models
The P/E [FWD] Ratio for Alphabet and Meta
Alphabet’s P/E [FWD] Ratio is currently 19.05, which is 31.55% below its 5 Year Average (27.84), providing us with an indicator that the company is currently undervalued.
Meta’s current P/E [FWD] Ratio is 14.30, which is 42.78% below its 5 Year Average of 24.99, indicating that Meta is also currently undervalued.
Fundamentals: Alphabet vs. Meta
Alphabet’s market capitalization is currently $1.29T, more than three times higher than the one of its competitor Meta ($377.36B). Meta currently has a slightly lower P/E [FWD] Ratio of 14.30 when compared to Alphabet (19.05).
Although Meta’s EBIT Margin (33.41% compared to Alphabet’s 29.65%) and Free Cash Flow Yield [TTM] (9.27% compared to 4.97%) are higher, the following contributes to the fact that I would select Alphabet if I had to choose one of the two companies from the Interactive Media and Services Industry:
Alphabet’s ROE of 29.22% is higher than Meta’s (25.48%), which implies that Alphabet is even more efficient in converting its equity financing into profits.
Alphabet’s Average EBIT Growth Rate [CAGR] over the last three years of 33.92% is also higher than that of Meta (with an EBIT Growth Rate [CAGR] of 22.80% in the same period of time).
In addition to that, Alphabet’s EPS Growth Rate Diluted [FWD] of 27.01% is higher than the one of Meta (3.12%), indicating that Alphabet is growing its profitability with a higher rate.
Additionally, Alphabet’s Free Cash Flow Per Share Growth Rate [FWD] of 24.39% is significantly superior to Meta’s (4.23%), demonstrating that Alphabet’s potential to produce cash and profits is growing faster than its rival’s.
This analysis of the companies’ fundamentals strengthens my investment thesis that Alphabet is currently the more attractive of the two. Below you can find an overview of selected financial data for both Alphabet and Meta.
|
Alphabet |
Meta |
||
|
General Information |
Ticker |
GOOG |
META |
|
Sector |
Communication Services |
Communication Services |
|
|
Industry |
Interactive Media and Services |
Interactive Media and Services |
|
|
Market Cap |
1.29T |
377.36B |
|
|
Profitability |
EBIT Margin |
29.65% |
33.41% |
|
ROE |
29.22% |
25.48% |
|
|
Valuation |
P/E GAAP [FWD] |
19.05 |
14.30 |
|
P/E GAAP [TTM] |
18.36 |
11.61 |
|
|
Growth |
Revenue Growth 3 Year [CAGR] |
23.32% |
24.02% |
|
Revenue Growth 5 Year [CAGR] |
22.88% |
29.20% |
|
|
EBIT Growth 3 Year [CAGR] |
33.92% |
22.80% |
|
|
EPS Growth Diluted [FWD] |
27.01% |
3.12% |
|
|
Free Cash Flow |
Free Cash Flow Yield [TTM] |
4.97% |
9.27% |
|
Free Cash Flow Per Share Growth Rate [FWD] |
24.39% |
4.23% |
|
|
Dividends |
Dividend Yield [FWD] |
– |
– |
|
Dividend Growth 3 Yr [CAGR] |
– |
– |
|
|
Dividend Growth 5 Yr [CAGR] |
– |
– |
|
|
Consecutive Years of Dividend Growth |
– |
– |
|
|
Dividend Frequency |
– |
– |
|
|
Income Statement |
Revenue |
278.14B |
119.41B |
|
EBITDA |
96.89B |
48.03B |
|
|
Balance Sheet |
Total Debt to Equity Ratio |
11.28% |
13.26% |
Source: Seeking Alpha
The High-Quality Company [HQC] Scorecard
“The aim of the HQC Scorecard that I have developed is to help investors identify companies which are attractive long-term investments in terms of risk and reward.” Here you can find a detailed description of how the HQC Scorecard works.
Overview of the Items on the HQC Scorecard
“In the graphic below, you can find the individual items and weighting for each category of the HQC Scorecard. A score between 0 and 5 is given (with 0 being the lowest rating and 5 the highest) for each item on the Scorecard. Furthermore, you can see the conditions that must be met for each point of every rated item.”
Source: The Author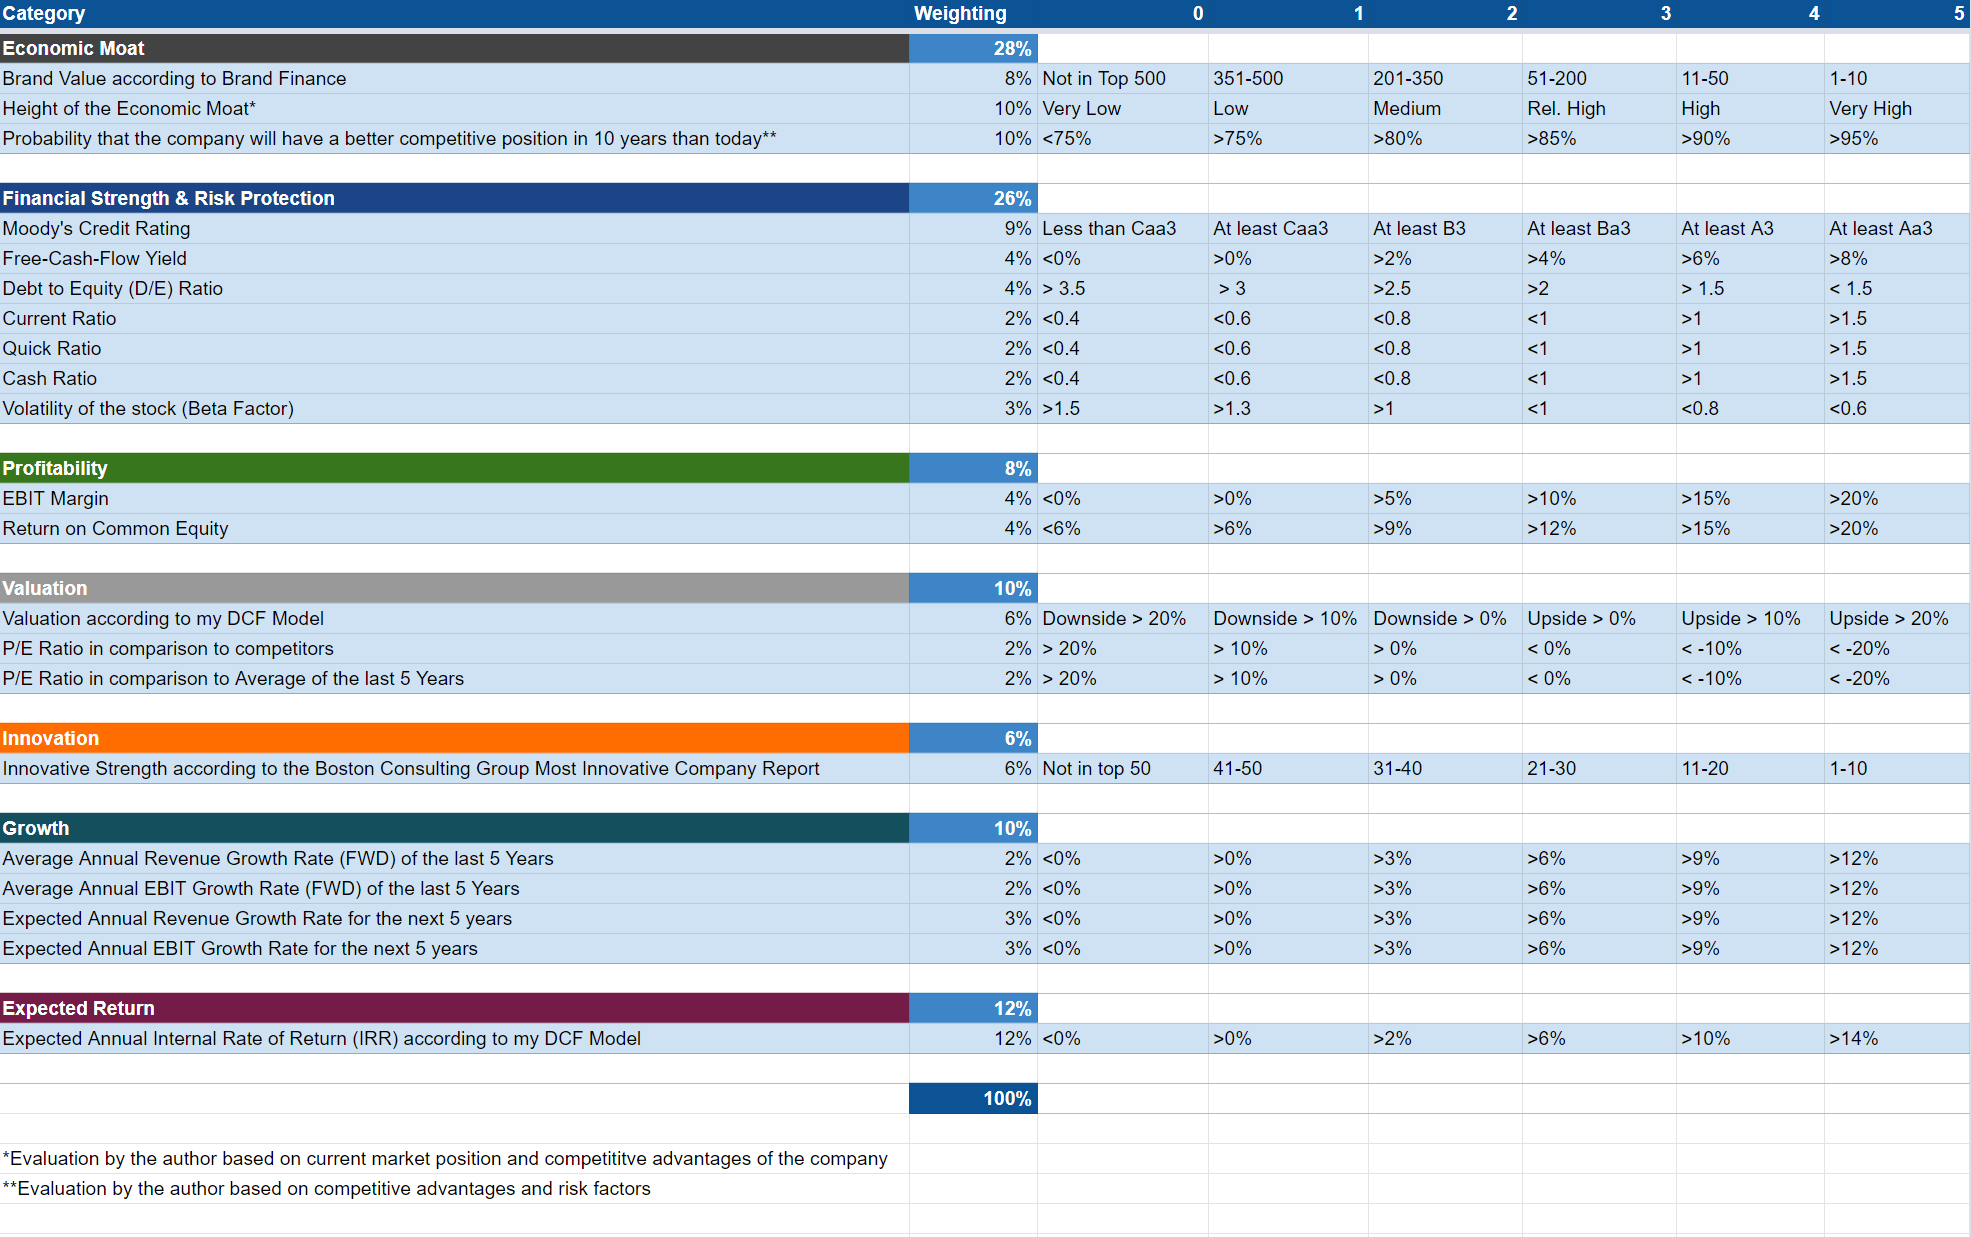
Alphabet and Meta According to the HQC Scorecard
Source: The Author
Although both companies are rated as very attractive as according to the HQC Scorecard, Alphabet’s overall score (91/100) is slightly higher than the one of Meta (80/100).
In the category of Economic Moat, Alphabet scores 93/100 points while Meta only reaches 57/100.
In terms of Financial Strength, both are rated as very attractive. These strong results are a consequence of both companies having a low Total Debt to Equity Ratio, as well as a high Current Ratio (Alphabet’s is 2.81 and Meta’s is 2.52), Quick Ratio (2.62 and 2.34) and Cash Ratio (2.0 and 1.8).
In the category of Profitability, both companies are rated with 100/100 points, a result of having high EBIT Margins (Alphabet’s is 29.65% and Meta’s is 33.41%) and high ROE’s (29.22% and 25.48%).
For Valuation, Alphabet receives 80/100 while Meta gets 92/100. Meta’s higher scoring in this category is a consequence of its even lower P/E [FWD] Ratio of 14.30 as compared to Alphabet’s 19.05.
For Growth, Alphabet receives 88/100 and Meta gets 76/100.
For Expected Return, both receive 100/100 points, this is mostly due to the high Expected Internal Rate of Return for the companies as according to my DCF Model.
Alphabet’s higher overall rating (91/100) as according to the HQC Scorecard, strengthens my opinion of choosing the company over Meta at this moment in time.
Alphabet and Meta According to the Seeking Alpha Quant Factor Grades
When taking into consideration the Seeking Alpha Quant Factor Grades, we can see that Meta is rated slightly better in terms of Valuation (with a C-) as compared to Alphabet (D rating). In terms of Growth, however, Alphabet (C- rating) is better rated than Meta (D- rating). For Profitability, both companies receive an A+ rating. For Momentum, Alphabet is more appealing (C+) than Meta (C rating).
Alphabet’s better rating in terms of Growth and Momentum once again underlines my investment thesis.
Source: Seeking Alpha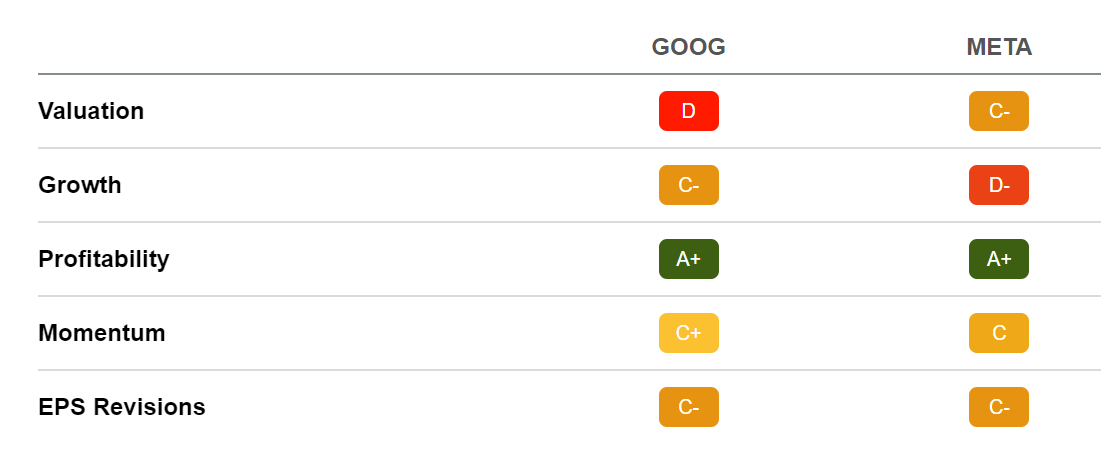
Alphabet and Meta According to the Seeking Alpha Quant Ranking
My investment thesis is also underlined by the results of the Seeking Alpha Quant Ranking where Alphabet is ranked significantly better than Meta: while Alphabet is 2nd in the Interactive Media and Services Industry, Meta is ranked 14th (both out of 61). Within the Communication Services Sector, Alphabet is currently ranked 7th and Meta is in 52nd place (both out of 247). The Seeking Alpha Quant Ranking reinforces my opinion to select Alphabet over Meta.
Source: Seeking Alpha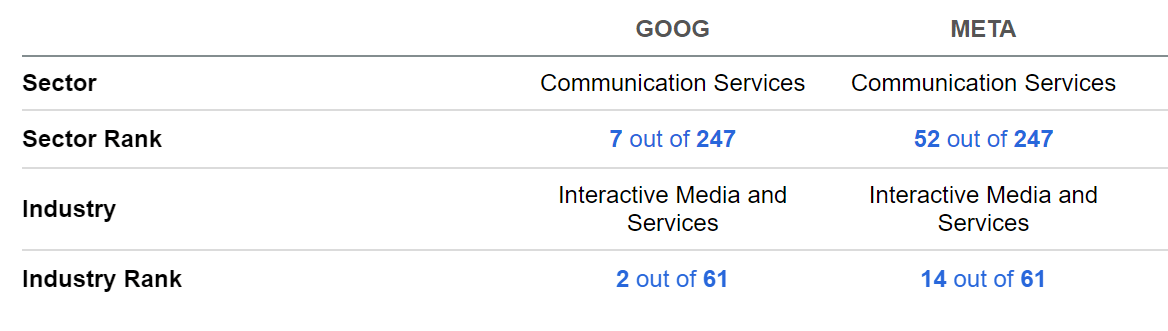
Alphabet and Meta According to the Seeking Alpha Authors Rating and Wall Street Analysts Rating
As according to the Seeking Alpha Quant Rating, Alphabet is currently a strong buy and Meta a hold. The Seeking Alpha Authors rate both companies as a buy while the Wall Street Analysts rate Alphabet as a strong buy and Meta as a buy.
Source: Seeking Alpha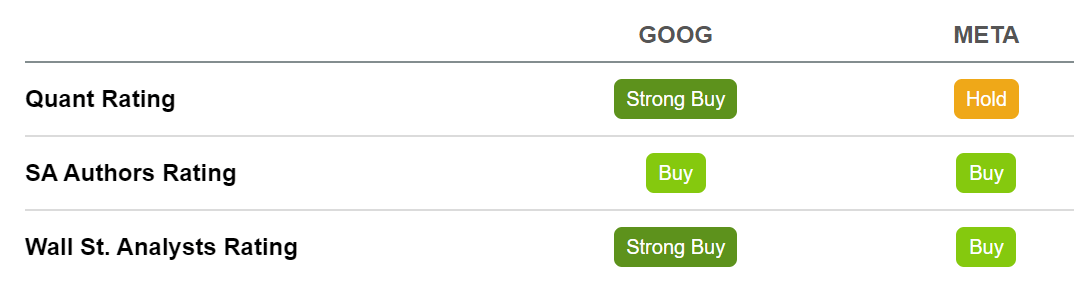
Risks
One of the main risk factors I see for both Alphabet and Meta is the fact that the largest portion of the companies’ business results depend on advertising.
When taking a closer look at Alphabet, it can be highlighted that 80% of the company’s revenue is generated by its business unit Google Advertising. However, Alphabet’s other business units are becoming more and more important (in 2Q22, Google Cloud accounted for 9% of Alphabet’s total revenue while it was only 7.5% in the same quarter of the year before).
While having a deeper look into Meta’s business, we find that its dependency on advertising is even higher than that of its competitor: 98% of the company’s revenue is generated by advertising from Facebook and Instagram.
This comparison of the companies’ advertising dependency indicates that a reduction in customer spending on marketing would impact Meta’s business to a higher amount than it would affect Alphabet. Meta’s significantly higher dependence on advertising contributes to the fact that I see an investment in Alphabet as being less risky.
Another additional risk factor when investing in Meta is the company’s high spending to build the metaverse. In 2021 alone, the company spent about $10 billion through its Reality Labs division in order to build the metaverse. This amount is five times higher than what the company paid to buy Oculus VR business in 2014 and 10 times higher than the amount it paid to buy Instagram back in 2012. Although the investments could pay off in the future, they currently represent a risk for the shareholders due to the fact that the success of this project is not yet foreseeable.
Additionally, I see the effect that data privacy will continue to have on the operating results of Meta as an additional risk factor for the company. At the beginning of this year, Alphabet announced new privacy restrictions which cut tracking across apps on its Android devices, following a similar move to Apple (NASDAQ:AAPL). This resulted in a decrease of Meta’s revenue by about $10 billion.
Summarizing, I see Alphabet as the lower-risk investment when compared with Meta, which once again underlines my thoughts on picking Alphabet out of the two. This lower risk also contributes to the fact that I would overweight the Alphabet position in an investment portfolio. On the other hand, the higher risk factors concerning Meta, contribute to my opinion of giving the company a small position in a long-term investment portfolio.
The Bottom Line
I consider the valuation of both Alphabet and Meta to currently be very appealing. However, when considering risk and reward, I came to the conclusion of selecting Alphabet over Meta. My opinion is based on the following facts and thoughts:
Alphabet’s ROE of 29.22% is higher than the one of Meta (25.48%), implying that Alphabet is even more efficient in converting its equity financing into profits. Furthermore, Alphabet’s Average EBIT Growth Rate [CAGR] over the last three years of 33.92% is also higher than the one of Meta (which has an EBIT Growth Rate [CAGR] of 22.80% over the same period).
Alphabet’s higher brand value ($263,425M as compared to Meta’s $101,201M), as well as its higher cash position ($124,997M in Total Cash & ST Investments vs. $40,489M) and higher credit rating (Aa2 credit rating by Moody’s compared to A1) additionally support my investment thesis to select the company over Meta.
My opinion is further underlined by the rating of the HQC Scorecard in which Alphabet scores 91/100 points while Meta scores 80/100. Additionally, the theory is strengthened by the results of the Seeking Alpha Quant Ranking, where Alphabet is ranked 2nd in the Interactive Media and Services Industry while Meta is 14th (both out of 61).
When it comes to risk, I also see Alphabet as being ahead of Meta. Alphabet is less dependent on its advertising business: while 98% of Meta’s revenue is from Facebook and Instagram advertising, Alphabet generates about 80% of its revenue from advertising. Furthermore, Alphabet is becoming more independent from its advertising business through the increasing revenue of its cloud business. In addition to that, Meta’s high spending in the metaverse implies an additional risk factor for the Meta shareholder.
The investment thesis of selecting Alphabet over Meta is also reflected in my own personal long-term investment portfolio, in which Alphabet holds one of my largest positions, while Meta only has a small position. My investment decision has been based on the fact that I consider Alphabet to be significantly more attractive than Meta in terms of risk and reward.
Which is your favorite out of Alphabet and Meta?
Be the first to comment