

Darren415
This article was first released to Systematic Income subscribers and free trials on Aug. 17.
In this article, we catch up on fiscal Q3 (calendar Q2) results from the Business Development Company Golub Capital (NASDAQ:GBDC). GBDC is currently trading at a total dividend yield of 8.4% and a valuation of 93%.
The company has a non-cyclical allocation focus with overweights in software and healthcare, among other sectors – not atypical of the BDC space. GBDC also boasts one of the better-diversified portfolios by the number of company holdings at over 300 – more than 2.5x the sector average.
GBDC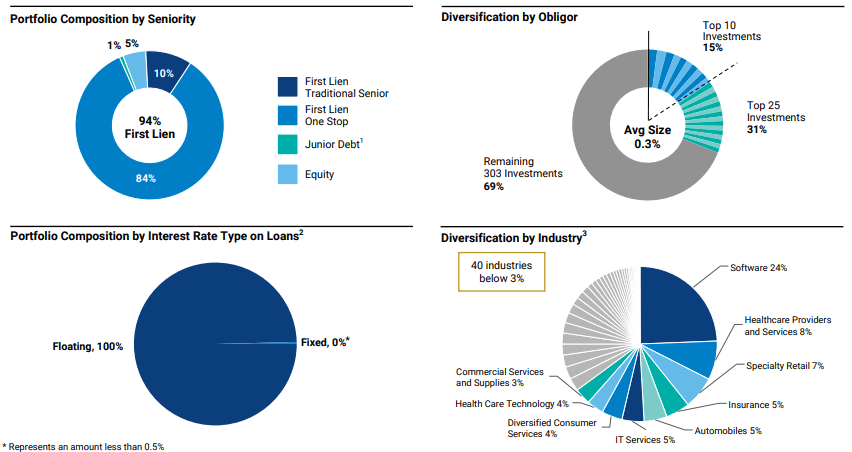
GBDC has a relatively attractive fee structure with a low management fee and, unusually, a lifetime total return lookback for incentive fees. This, along with its very low level of interest expense, means it doesn’t have to reach for risk as many other BDCs to drive the same kind of return for investors. This is particularly the case due to its below-average valuation. In our view, GBDC remains well positioned for the current macro and market environment which is why we continue to hold it in our Income Portfolios.
Quarter Update
GBDC NAV fell 1.4% during the calendar Q2 – quite a bit stronger than the sector median as the following chart shows.
Systematic Income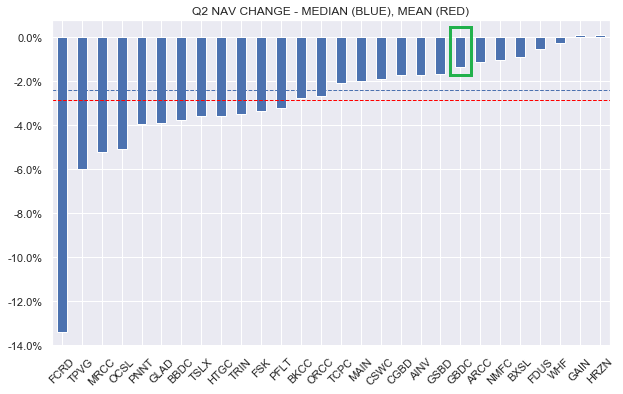
The drop was primarily due to unrealized losses related to broad credit spread widening in the quarter. Management view this as likely to reverse over time.
GBDC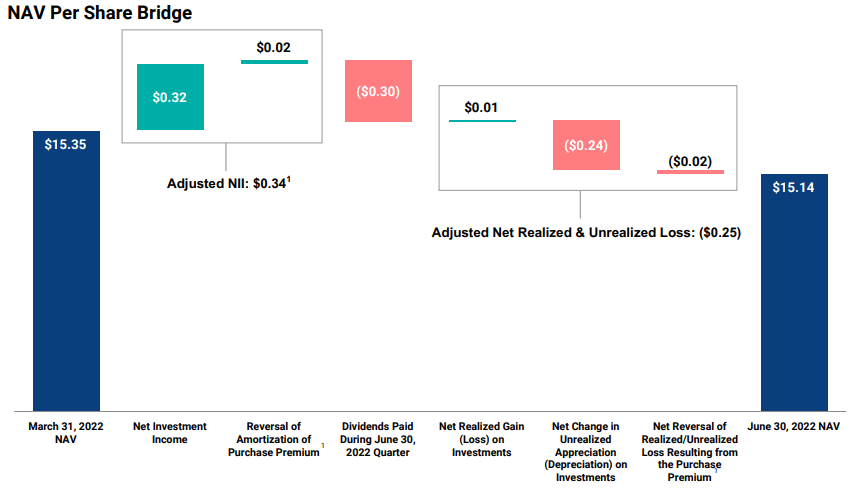
Total NAV return in the quarter was +0.6% or about 1% above the sector average.
Systematic Income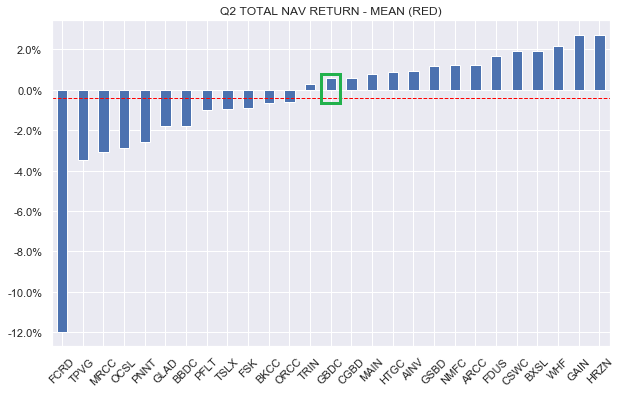
GAAP net investment income increased sharply. GBDC publishes two flavors of adjusted net income – one that adjusts for merger accounting and another which adjusts for the capital gains incentive fee. The first one was mentioned on the earnings call; however, we use the second one as that’s more in line with the version that’s used by other BDCs. This adjusted NII rose by 3% to $0.31 (red bars below). The clear trend of this metric has been higher over the last couple of years. Current dividend coverage based on it is 103%.
Systematic Income BDC Tool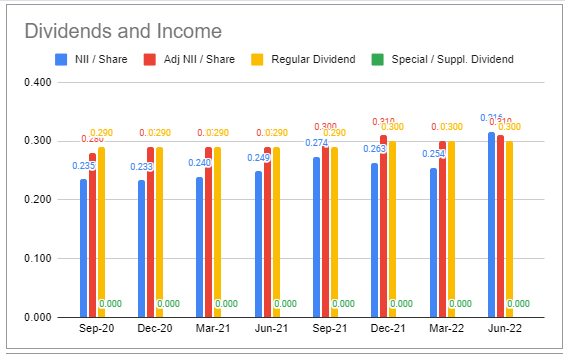
Income Dynamics
Net new investments remained positive with a +3.3% gain. This will continue to support net income in the medium term.
Systematic Income BDC Tool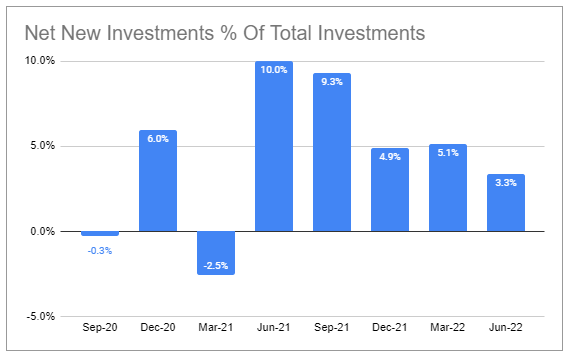
Positive net new investments along with a drop in the NAV resulted in a significant uptick in leverage.
Systematic Income BDC Tool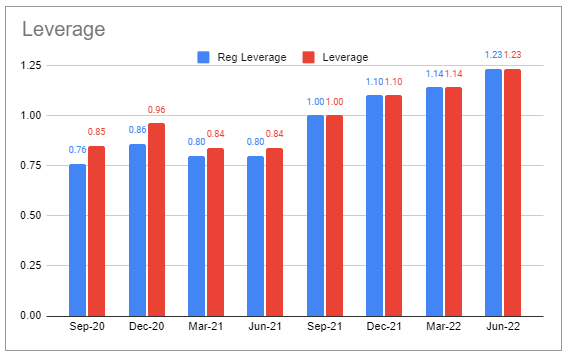
Average asset yield (excluding fee income) rose by 0.2% to 7.1%. Interest expense rose by the same amount to 3%. Although the net investment spread remained the same, there are significantly more assets than liabilities which will support net income. GBDC has the lowest interest expenses in our coverage.
Systematic Income BDC Tool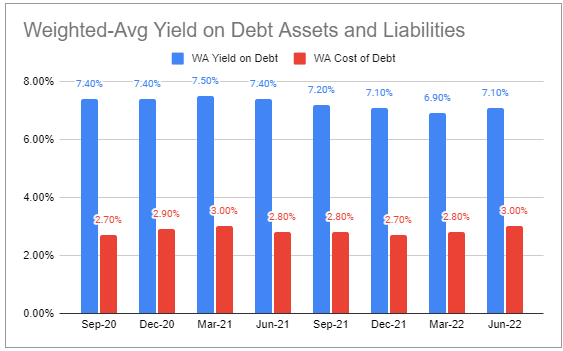
All else equal, net investment income should rise by over 17% from a 1% bump in short-term rates. Its high floating-rate asset profile (100% vs. 91% sector-average) as well as relatively high leverage means GBDC has very strong income upside in the current environment.
Systematic Income BDC Tool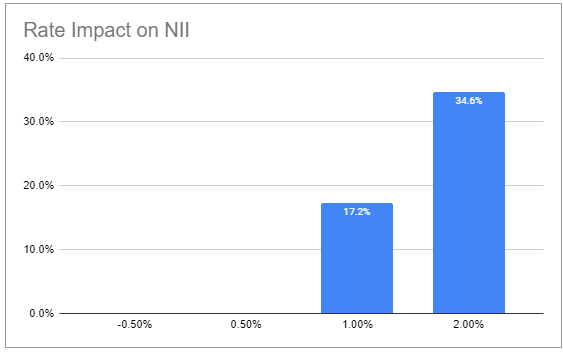
Historically, when short-term rates are increasing, credit spreads are decreasing because, typically, the economy is doing very well when rates are moving higher. However, this is not the case now as the Fed is hiking into a cooling economy and a weak market setting. This means that while in a typical market environment credit spreads offset the rise in rates this is not the case now. In short, we should expect a higher level of pass-through from the rise in short-term rates than historically although we also don’t expect it to hit the “theoretical” 17%.
Portfolio Quality
Non-accruals stayed flat at 1.1% of fair-value – slightly below the sector average. Subsequent to the end of the quarter one of the non-accruals was repaid at par.
Systematic Income BDC Tool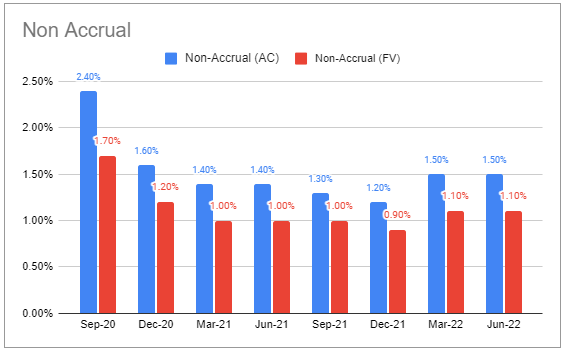
The average internal portfolio quality rating (right-hand chart) worsened very slightly.
Systematic Income BDC Tool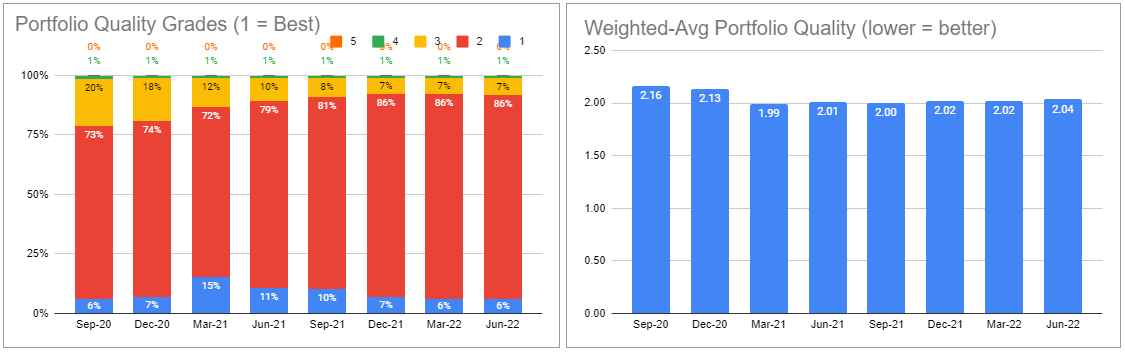
There were net realized gains for the 6th quarter in a row – a nice track record to see.
Systematic Income BDC Tool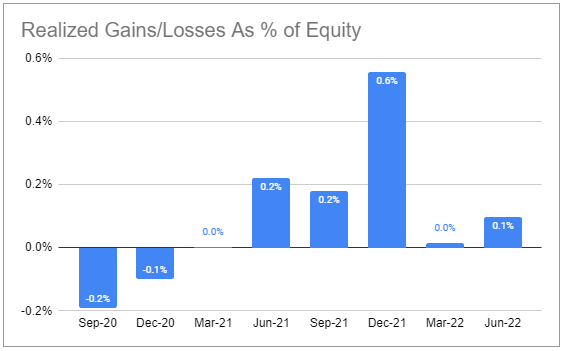
Valuation And Return Profile
The GBDC valuation has recovered nicely recently along with the rest of the market. However, it is still trading at a historically low level of close to 15% below its historic average.
Systematic Income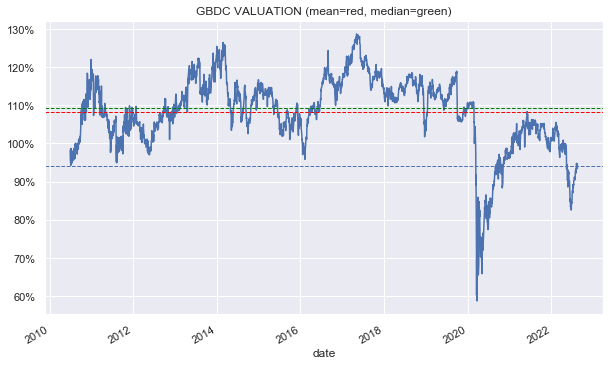
This shift to a lower valuation is not due to a revaluation of the broader sector (orange line) as the following chart shows. Rather, it is explained by a cheapening of GBDC relative to the sector.
Systematic Income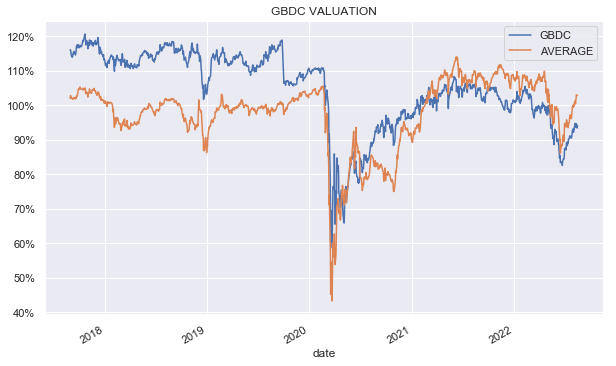
This cheapening is not totally random and, in our view, is explained by a downshift in the performance of GBDC relative to the sector. As the following chart shows, 10Y total NAV returns of GBDC exceed the sector average while shorter-term (i.e. 3Y) total NAV returns lag the sector. In short, the performance of GBDC has downshifted over recent years.
Systematic Income BDC Tool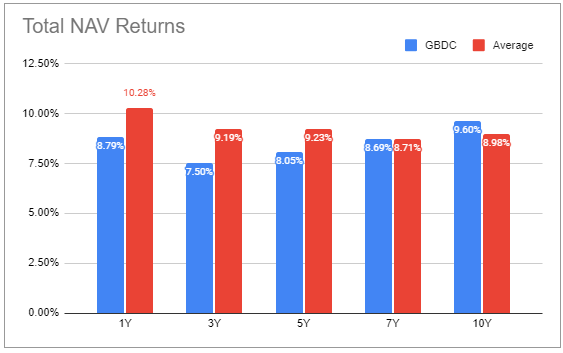
If we look at a more granular picture we see that up to the COVID shock GBDC was performing pretty much in line with the sector average and a bit better on occasion. However, after the COVID shock the company started to underperform, only clawing back to the average recently. The yellow line which shows the trailing twelve-month average relative performance vs. the sector makes this clear (below zero = underperformance and vice-versa).
Systematic Income BDC Tool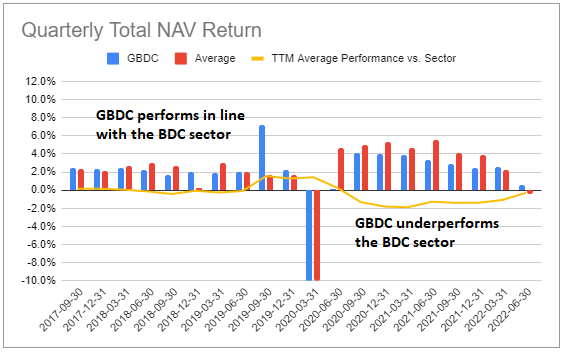
It might be tempting to conclude that GBDC ran into an avalanche of losses in the aftermath of the COVID shock which caused it to underperform. However, a look at its net realized gains/losses figures shows this is not actually the case. Yes, there were some realized losses in 2020 but they were very small in the broad scheme of things and were more than fully offset by net realized gains in 2021.
Systematic Income BDC Tool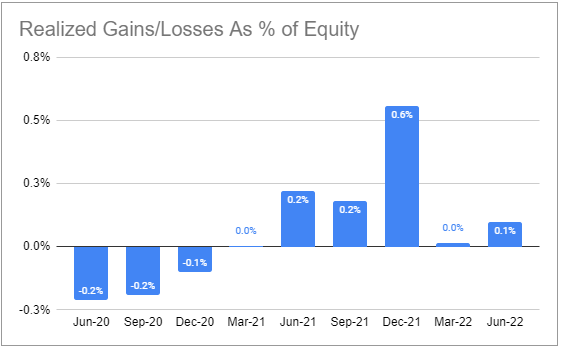
The explanation for its underperformance has much more to do, in our view, with the mistake it made in 2020 which was to batten down the hatches. Specifically, it ran a hugely NAV-dilutive rights offering we discussed earlier. It also deleveraged significantly, only to increase leverage in later quarters as the following chart shows.
Systematic Income BDC Tool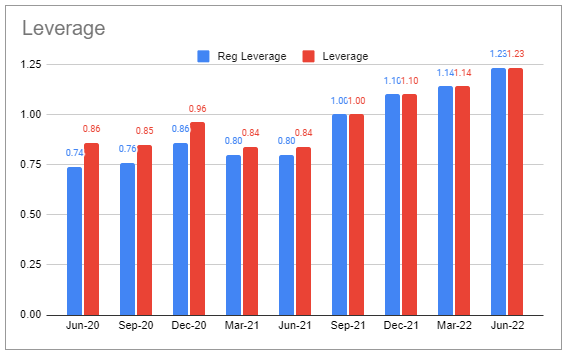
In short, this downshift in performance was due to a one-off issue. Obviously, no one knew how well 2020 would turn out for the market but, in retrospect, it seems clear that GBDC was overly cautious. And although this miscall could carry over into future decisions, the COVID shock seems a rare enough event that we can give GBDC a pass this time around.
In short, we would overweight the company’s longer-term returns over its 2020 performance in gauging its fair valuation. We expect GBDC to perform in line with the sector average over time which is why its 9% below-average valuation (93% vs 103% sector average) remains attractive in our view.
Takeaways
GBDC has a number of attractive features in the current environment. Its higher-quality, diversified portfolio makes it a more resilient option in an environment of slowing leading indicators. Secondly, given its low fee structure and low interest expense, it doesn’t need to take more risk and try to shoot the lights out to deliver a decent return. Finally, it is also one of the best BDCs positioned for rising short-term rates – another asset in the current environment. We continue to hold GBDC in our Income Portfolios.
Be the first to comment