

Chris Hondros/Getty Images News
The Goldman Sachs Group, Inc. (NYSE:GS) delivers a broad range of financial services across four distinct business segments. Total revenues in 2021 were up 33%, which was on top of a 22% increase in 2020. The bank is investing heavily in new growth areas, such as transaction and consumer banking and asset and wealth management. The investments have already produced results, with consumer banking delivering revenue growth of 23% in 2021 and 25% growth for wealth management. In addition, overall deposits at the bank grew 40% year-over-year in the fourth quarter. The bank will benefit further in future periods as consumers increase their borrowing activity.
In addition to delivering solid growth, GS pays an annual dividend of $8.00 per share, which is over 5x greater than the payout of $1.40 in 2010. The dividend continues to grow at double-digit rates and is expected to be over $10.00 in 2024. At this level, investors would have a yield-on-cost of over 3%.
Strong fundamentals have not made GS immune to the broader market selloff. Shares in the stock are down 20% over the past three months and are currently trading near their lows. Ahead of earnings, shares appear to be oversold. At present pricing, an attractive entry point exists for shareholders looking to add a quality component of the DJIA to their diversified portfolios.
The Business
GS is a leading global financial institution that operates in four business segments: Investment Banking; Global Markets, Asset Management; and Consumer and Wealth Management. In 2021, GS reported total revenues of +$59B. This was up 33% from 2020 and 62% from 2019.
Author’s Summary of Total Revenues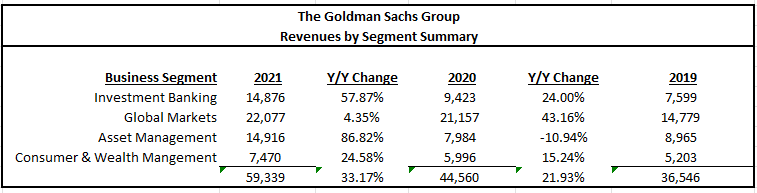
Nearly 40% of total revenues were attributable to the Global Markets segment. This segment generates revenues from intermediation and financing activities for clients who buy and sell financial products, raise funding, and manage risk. While revenues in the segment were up 4% in 2021, growth was not as strong as in 2020, where the firm benefited from record trading volumes. Though asset management and investment banking each only account for 25% of revenues, growth in both segments were 58% and 87%, respectively.
As a participant in the global financial services industry, GS is subject to extensive regulation and supervision worldwide. Regulations that impact companies in this industry are unique and pertain to those primarily found in the Dodd-Frank Act, enacted in 2010. As such, the firm is obligated to conform to strict capital and liquidity requirements that involve the calculation of risk-based capital and leverage ratios and the performance of stress tests and capital planning, among other requirements.
The Charts
GS is currently trading at about $310. This is down from their all-time high of $424 within the past year but above their five-year average of $255. The stock has been on a steady uptrend since its lows in 2020. Since its peak however, it is now down 20% over the past three months. The broader S&P, on the other hand, is down just 5%.
YCharts – GS Historical Pricing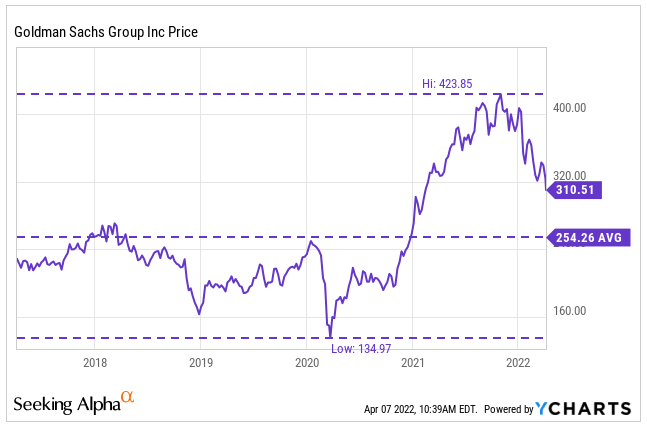
Compared to peers, GS has lagged in total returns. Over a ten-year timespan, GS delivered total annualized returns of 12%. While this is far better than Citigroup (C) and not far behind the 14.5% returns delivered by JPMorgan Chase (JPM), it is well below the nearly 19% and 17.5% delivered by Morgan Stanley (MS) and Bank of America (BAC), respectively.
YCharts – Historical Returns of GS Compared to Competitors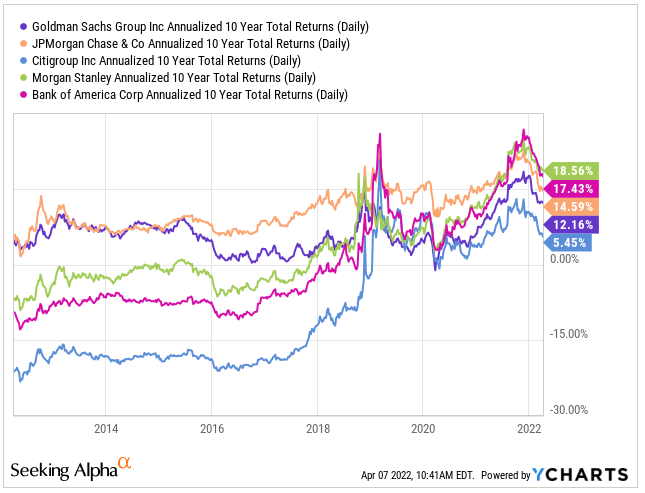
Goldman’s price-to-book ratio is also at a gap to their peers. For investors, the belief has been that the success of GS has typically been associated with the cyclical nature of markets and not tied to newer business units, such as consumer and transaction banking and asset and wealth management. The ability of GS to grow and build up these new units is one catalyst that can help narrow the gap to their peers.
YCharts – Price-To-Book Ratio of GS and Their Competitors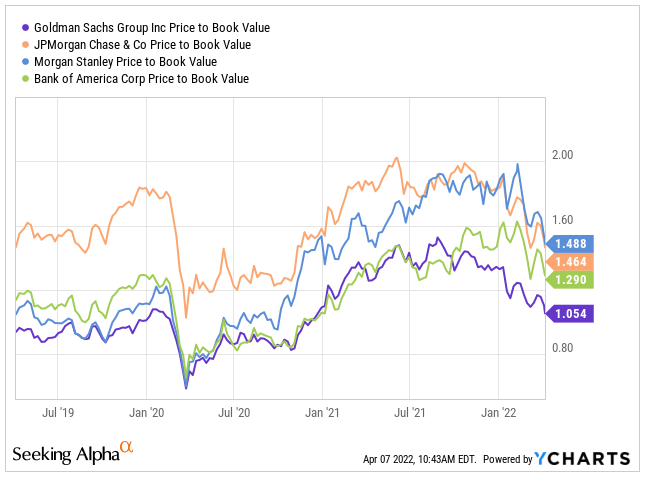
Prior to January 2022, GS was trading comfortably above their 200-day moving average. Shortly after their earnings release, however, they crossed below and have yet to cross above it. In late February, it came close but hit resistance and traded back down. At that point, the 200-day average crossed over the 50-day average. This was confirmation of bearish sentiment, which signaled further losses ahead. Currently, the stock is trading well below their 50-day average, so it’s possible the sentiment in the shares will remain bearish in the near term.
YCharts – GS 50/200 Day Moving Averages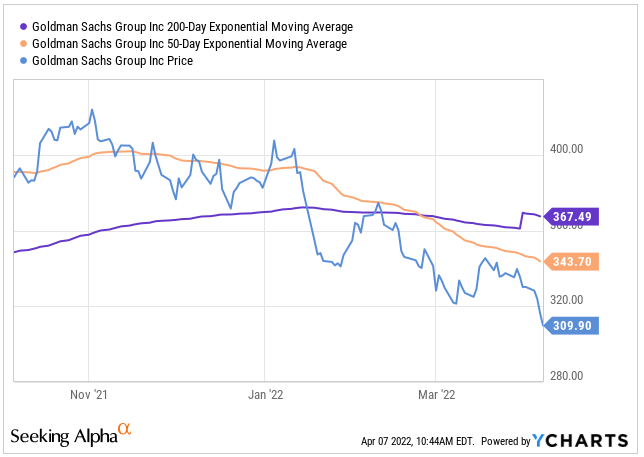
The RSI, however, is suggesting the stock is entering oversold territory. It’s possible the stock has dropped too far. A reversal may be possible at some point in the near future, perhaps as soon as the next earnings release, which will be on April 14, 2022.
YCharts – GS RSI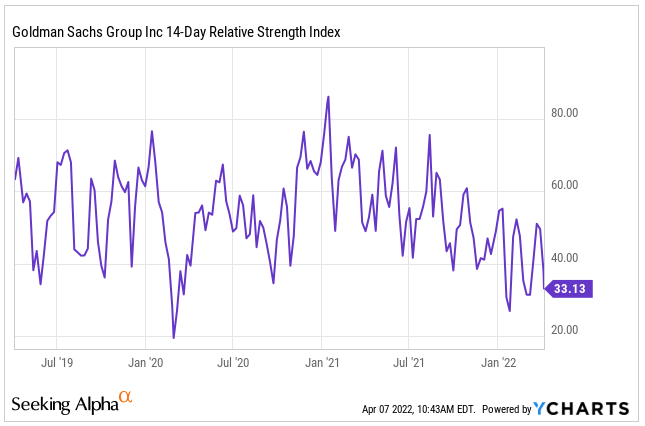
GS is down from their all-time highs and down 20% over the past three months. At present, shares are currently trading near their 52-week lows and are lagging the broader market. While sentiment is bearish, it appears the stock is entering oversold territory. A reversal at some point is likely, potentially as soon as the upcoming earnings release. To have a more complete picture, however, an analysis of the firm’s fundamentals is necessary.
The Fundamentals
Author’s Assessment of Strength of Fundamentals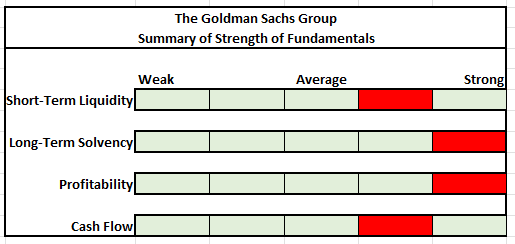
On December 31, 2021, GS reported total assets of +$1.5T and total liabilities of +$1.4T. Most of the firm’s assets are in the form of their trading assets and investment-related holdings.
The leverage ratio, which measures the proportion of equity and debt the firm uses to finance assets, was 13.3x at the end of 2021. This is greater than the 12.1x reported in 2020, driven primarily by the increase in deposits of +$100B during the year, which partly contributed to the +$287B increase in liabilities. The debt-to-equity ratio in 2021 was 2.3x versus 2.2x in 2020. Leverage, therefore, increased but not by a significant level.
Another point to consider is Goldman’s cash on hand balance of +$261B. This balance is greater than most of their individual liability line items, so there are clearly no concerns regarding liquidity risks.
Partial Balance Sheet – Form 10-K
Net earnings in 2021 were up over 100% from the prior two years, driven by strong earnings generated in all business segments, especially in the investment banking and asset management divisions. Return on average common equity was also up significantly in most segments, which translated into an overall return on equity in excess of 20% compared to 11% and 10% in the prior two years.
Author’s Summary of Net Earnings and Return on Average Common Equity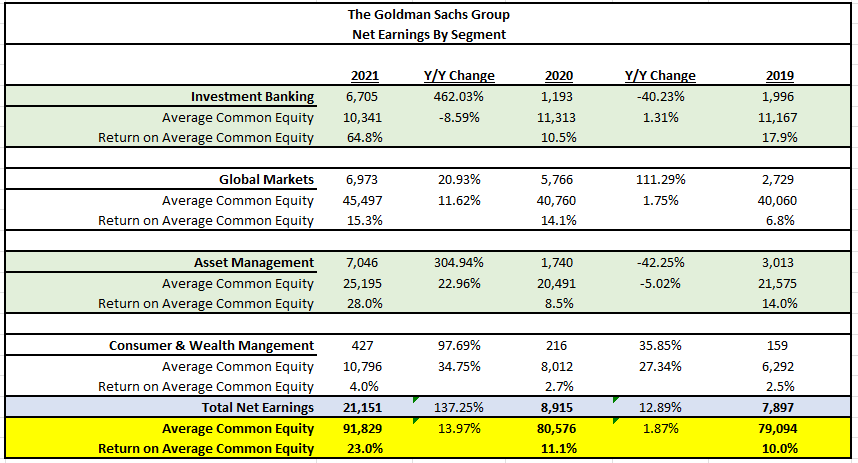
While net income was higher in 2021, operating cash flow was down due to negative adjustments relating to collateralized agreements, which the firm enters to facilitate client activities. Aside from this adjustment, there were no other significant adjustments to operating activities.
Partial Cash Flow Statement – Form 10-K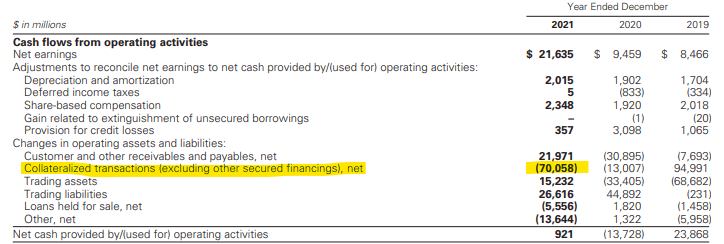
GS ended 2021 with +$261B in cash versus +$156B in 2020 and +$134B in 2019. The increase in cash in the current year was due to increased deposits of +$104B, which is included within the financing activities section. These deposits were related to increases in consumer, banking, and private bank deposits. During the year, the firm returned +$7.9B to common shareholders in the form of dividends and buybacks. The dividend payout is less than 15% of net income, and, when including repurchases, the total payouts are still less than 50% of net income, which indicates a high degree of coverage.
Author’s Summary of Cash Flow Statement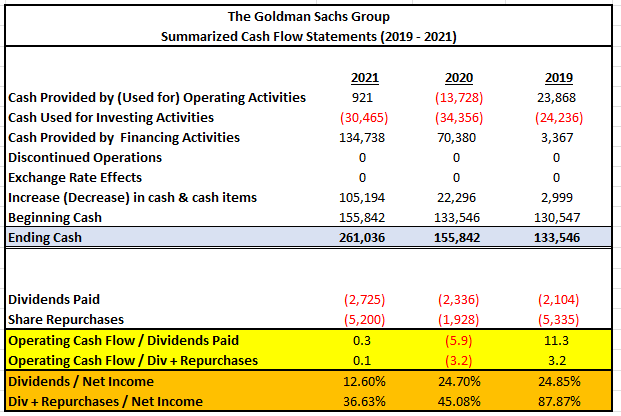
The dividend is well-covered despite being increased by double digits nearly every year since 2012. This is indicative of the strong earnings growth of the firm. The yield has remained under 2% most years as the share price has followed the payouts to higher levels. Currently, shares are yielding 2.5%, which is the highest it’s been. This is one indication of a mismatch between current pricing and the current dividend payment.
Seeking Alpha – GS Dividend Growth History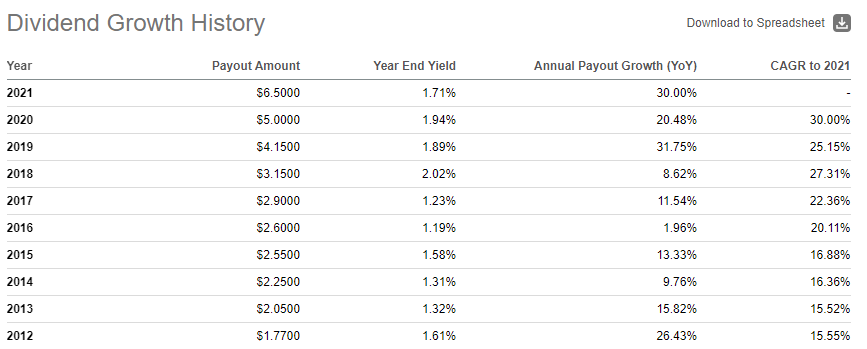
Consensus dividend estimates are at $10.13 in 2024. This would be 27% higher than current levels and would represent a yield of 3.2%, which would be one of the highest offerings for the firm’s dividend.
Seeking Alpha – Consensus Dividend Estimates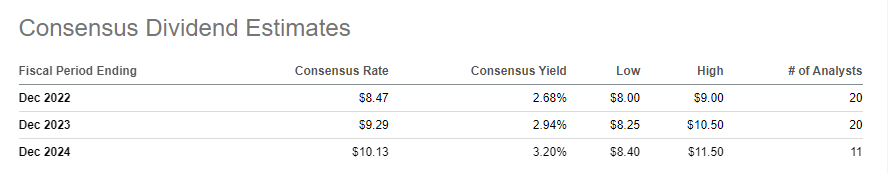
GS has strong fundamentals supported by a sizeable balance of cash, which exceeds most of their individual liability balances, and strong profitability performance. In addition, the firm is generating more than enough earnings to fully cover their shareholder payouts, which are growing by double-digits every year. There are no liquidity or long-term solvency concerns, and shareholder payouts appear safe for the foreseeable future. As such, it is safe to apply a strong rating to Goldman’s fundamentals.
Upcoming Earnings
Goldman is set to report earnings prior to market open on Thursday, April 14. On their last earnings release, they beat on revenues but missed on EPS. The consensus revenue estimate for the current quarter is +$11.94B. Goldman has a history of beating on revenues and often beats on EPS. While the share price tends to drop following earnings, it regains ground as the market absorbs the details within the guidance. Shares are currently trading on bearish sentiment, so the market will be more unforgiving on any miss or underwhelming guidance.
YCharts – Movement of GS Following Past Earnings Releases
Primary Risks
Goldman’s businesses are materially affected by conditions in the global financial markets and the overall economic environment. Client activity levels and creditworthiness may be impacted by negative externalities that are outside of Goldman’s control. Declining economic growth, business activity, and consumer confidence can all reduce activity levels, which will negatively impact GS’ results of operations.
In addition, GS has many net “long” positions in debt securities, loans, and most other asset classes. Substantially all these positions are marked-to-market on a periodic basis. As such, any declines in asset values directly impacts the firm’s earnings, unless the positions are hedged. Even then, a wrong-way hedge could further strain earnings in periods with significant volatility.
Furthermore, the firm receives asset-based management fees based on their clients’ portfolios or investment in funds managed by the firm. In some cases, GS receives incentive fees based on the increase in value of the investments under management. Thus, declines in client portfolios would also result in reduced fees to the firm.
GS is subject to pervasive rules and regulations both within the United States and worldwide. In many cases, their activities are subject to overlapping regulations in different jurisdictions. Compliance with these regulations is tedious and failure to adhere to the requirements would result in significant fines and penalties that could adversely affect the firm’s liquidity. In addition, failure to maintain adequate capital as stipulated within the regulatory requirements may limit the ability of the firm to pay dividends and repurchase shares.
Conclusion
Bearish sentiment has forced shares of GS well below their 200-day moving average. The declines have been to the point of oversold territory. This comes ahead of earnings, which will be released next week prior to market open. A strong beat paired with a favorable outlook could swing sentiment and immediately send shares significantly higher.
The forward pricing multiple of GS is currently 8x versus a five-year average of 10x. Applying the historical multiple to current pricing levels would yield a share price close to $400. Additionally, the current dividend yield appears to be at odds with historical averages. Currently, the dividend is yielding 2.5% versus a yield of typically 2%. Applying the historical yield to current pricing would, again, bring the price to right around $400. This is also in line with consensus price targets of various Wall Street analysts.
Continued growth in newer units, such as transaction banking, will be catalysts in future periods that should help the firm close the gap in its price-to-book ratio with competitors, such as JPMorgan and Morgan Stanley. At current pricing, an attractive entry point exists for new shareholders looking to benefit from the hefty $8.00 dividend payment that is fully covered and expected to grow further, in addition to potential significant share price appreciation.
Be the first to comment