

Gold, XAU/USD, Federal Reserve, Yield Curve, Technical Analysis – Talking Points:
- Gold prices gained after the Fed hiked rates as the US Dollar fell
- Markets seemed confident in the central bank, yield curve not so
- XAU/USD eyeing follow-through after near-term trend breakout
Gold prices aimed higher over the past 24 hours even though the Federal Reserved commenced its first hiking cycle since 2018. On Wednesday, the FOMC voted to raised interest rates by a quarter-percentage point, bringing up the range to 0.25% – 0.50%. The anti-fiat yellow metal tends to be quite sensitive to a combination of movements between the US Dollar and Treasury yields.
The US Dollar weakened as front-end Treasury yields gained. So, it seemed that XAU/USD took full advantage of the softer Greenback, particularly as equity markets rallied. In fact, the strongest performing sector within the S&P 500 was technology. The Nasdaq 100 roared higher, climbing 3.72%. Clearly, demand for anti-risk assets, such as the US Dollar, faded.
This is despite the central bank signaling rate hikes at the remaining 6 meetings this year. Prior to the Fed, overnight index swaps were pricing in 7 hikes in 2022. So, it seems that this was as expected. Furthermore, Chair Jerome Powell noted that “The American economy is very strong and well positioned to handle tighter monetary policy”.
FOMC members were able to deliver on a hawkish narrative without upsetting financial markets, for now. Perhaps the markets welcomed the central bank’s confidence in the economy despite numerous uncertainties, such as Ukraine and a slowing China. Some details were left out, such as the date of beginning unwinding the balance sheet. Mr Powell also left the door to a faster tightening ‘if needed’.
Looking at the 10-year and 2-year Treasury yield curve below paints a rather different picture, however. It remains lower on the weekly setting in the aftermath of the Fed. The trend has been accelerating towards inversion since this year began, reflecting the markets gradually pricing in higher recession risk. With that in mind, gold’s rapid descent from near all-time highs is a reminder of the tough road ahead for the yellow metal in a rising interest rate world.
US Yield Curve (10Y – 2Y Spread) – Weekly Chart
Chart Created Using TradingView
Gold Technical Analysis
On the 4-hour chart, gold prices confirmed a breakout above a near-term falling trendline from the current 2022 high of 2075.14. This may hint at further gains ahead. However, keep a close eye on the 50- and 100-period Simple Moving Averages (SMAs). Both lines are above and may hold as resistance, they could also experience a bearish crossover. Downtrend resumption entails a break under the 1894 – 1906 support zone.
XAU/USD 4-Hour Chart
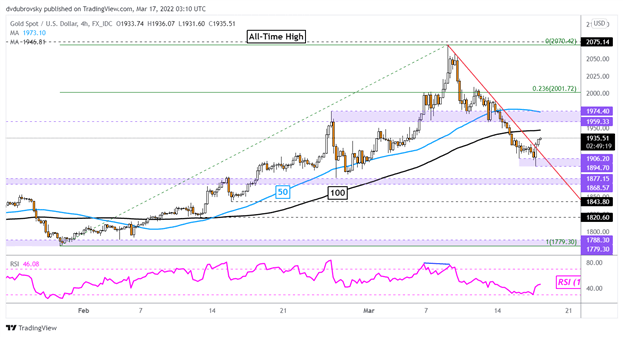
Chart Created Using TradingView
–— Written by Daniel Dubrovsky, Strategist for DailyFX.com
To contact Daniel, use the comments section below or @ddubrovskyFX on Twitter
Be the first to comment