

GOLD, CRUDE OIL PRICE OUTLOOK:
- Gold prices extended higher after President Joe Biden announced a smaller-than-expected infrastructure plan
- Crude oil prices awaited fresh catalysts from the OPEC+ policy meeting after falling 3.8% over the past two sessions
- Friday’s US nonfarm payrolls data will be closely watched by traders for clues about the direction of the US Dollar

Recommended by Margaret Yang, CFA
Trading Forex News: The Strategy
Gold prices traded modestly higher during Thursday’s APAC morning session after rebounding 1.32% a day ago. Prices returned to above a psychological level at $1,700 as the DXY US Dollar index retreated from a four-month high. This could be attributed to a smaller-than-expected infrastructure plan announced by President Joe Biden, who aims to revamp America’s infrastructure facilities, create millions of jobs and tackle climate changes with the proposal. Yet the $2.25 trillion spending package came below market expectation of $3-4 trillion, resulting in some unwinding activity.
A weaker US Dollar provided bullion with some temporary relief, but this may not change its medium-term bearish trajectory as the longer-term Treasury yields continues to march higher on reflation optimism. The heavily watched 10-year rate hovered near its 14-month high of 1.744%, exerting downward pressure on precious metal prices. The real yield, as represented by the 10-year Treasury inflation-indexed security, climbed to -0.63% from -0.70% a week ago. A rising real yield may weigh on gold prices despite a temporary retreat in the Greenback.
Gold Prices vs. 10-year Treasury Inflation-indexed Security
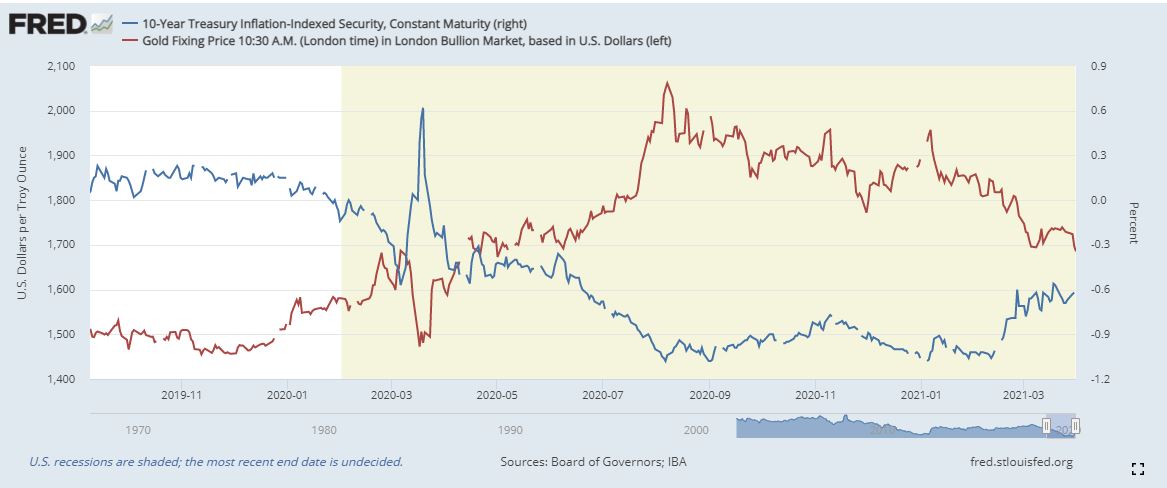
Source: FRED
Friday’s US nonfarm payrolls report will be closely watched by traders for clues about the health of the labor market and its ramification for the Fed’s interest rate path. Volatility could be exacerbated by thinner trading volume as many markets are shut for the Good Friday holiday. Prior to this, ADP private payrolls added 517k new jobs in March, the most seen since September 2020, but still fell below the consensus forecast of 550k. If the nonfarm payrolls number fails to meet an estimation of 647k, this could lead to a deeper pullback in the US Dollar and buoy bullion prices. The opposite may happen if the actual number beats.
Crude oil prices were little-changed during Thursday’s APAC trading session after falling over 3.8% over the prior two sessions. Prices were facing a couple of headwinds, including a larger-than-expected build in API crude inventories, a revision down of this year’s oil demand outlook by OPEC+, and the lingering impact of a third viral wave in Europe. Against this backdrop, market participants are expecting OPEC+ to roll over its current production cut through May to stabilize prices.
The energy demand outlook appears to be tarnished by renewed wave of lockdowns in Europe and rising Covid-19 infections in India and Brazil. The Canadian province of Ontario will be put under lockdown restrictions for 28 days, marking the latest restrictive measure carried out by a major economy to curb the spread of coronavirus.
Gold Price Technical Analysis
Gold prices rebounded from a key support level at US$ 1,676 and extended slightly higher. The primary trend remains bearish-biased however, as suggested by the downward-sloped 50- and 100-day SMA lines, although the 20-day SMA seems to be flattening. Gold prices have also broken the minor “Ascending Channel” earlier this week, suggesting that bears are still in control. The MACD indicator is probably going to form a bearish crossover beneath the neutral midpoint, underpinning downward momentum.
Gold Price – Daily Chart

| Change in | Longs | Shorts | OI |
| Daily | -6% | 8% | -4% |
| Weekly | 5% | -27% | -1% |
Crude Oil Price Technical Analysis
WTI retreated from the 200% Fibonacci extension level of 66.50 and entered a technical correction. Prices appeared to be hesitant to decide a near-term direction as traders await policy guidance from OPEC+. A daily close below the 50-day SMA (59.67) would likely intensify near-term selling pressure and carve a path for price to test a key support level at 58.29 (the 127.2% Fibonacci extension). The MACD indicator has formed a bearish cross over and trended lower since, underscoring bearish momentum.
Crude Oil Price – Daily Chart
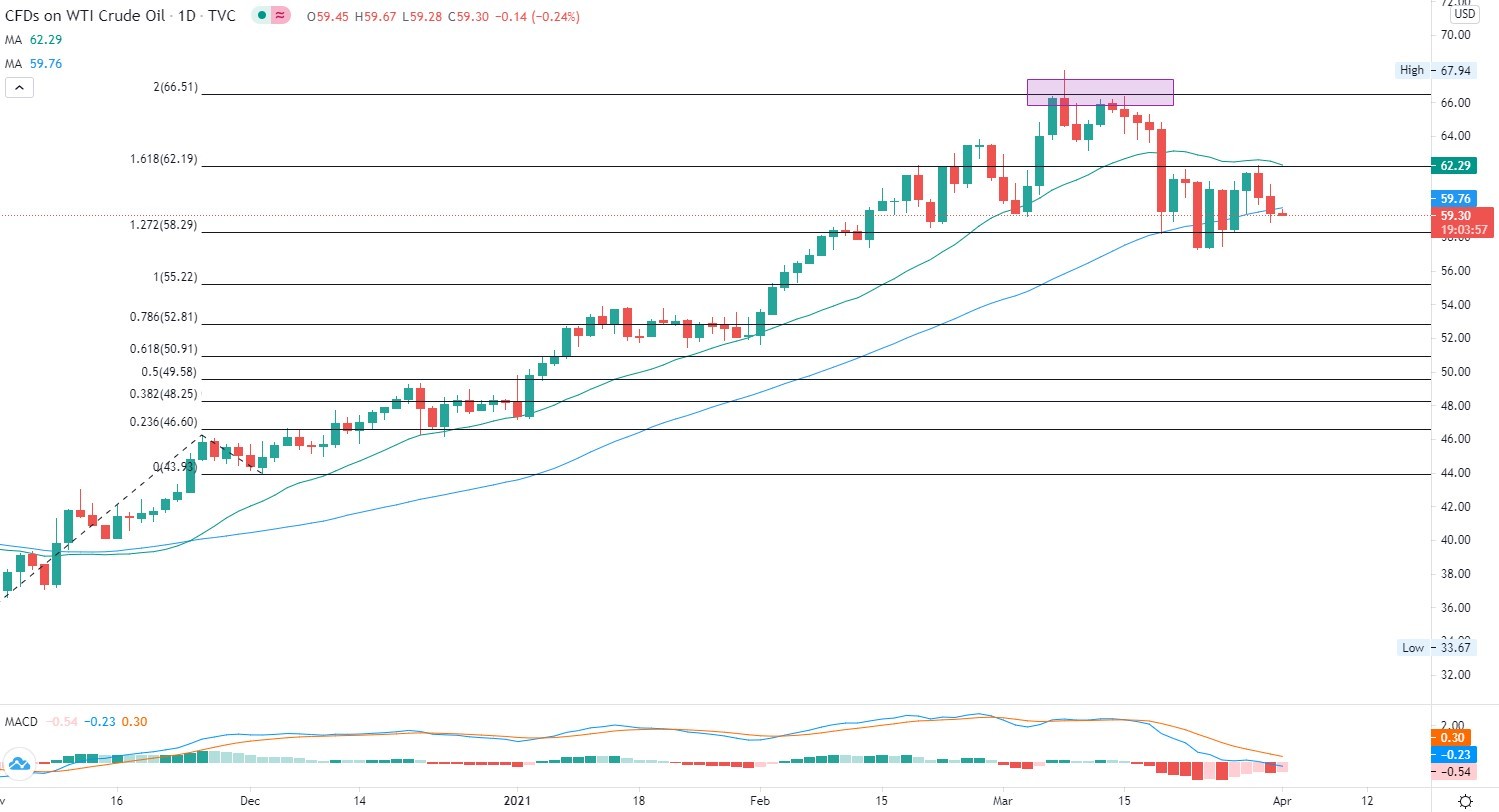
Chart by TradingView
Discover what kind of forex trader you are

— Written by Margaret Yang, Strategist for DailyFX.com
To contact Margaret, use the Comments section below or @margaretyjy on Twitter
Be the first to comment