

Gold Price Talking Points
The price of gold appears to be reversing ahead of the October high ($1814) even as the US Gross Domestic Product (GDP) report points to sticky inflation, and lack of momentum to hold above the 200-Day SMA ($1792) may spark a near-term decline in the precious metal like the price action seen earlier this year.
Gold Price Susceptible to Rebound in US Treasury Yields
The price of gold struggles to hold its ground even as the US GDP report shows the growth rate slowing to 2.0% from 6.7% per annum in the second quarter of 2021 as the 10-Year Treasury yield bounces back from the weekly low (1.52%) to halt a four-day decline.
At the same time, the reaction suggests gold has lost its appeal as a hedge against inflation as the core Personal Consumption Expenditure (PCE) Price Index prints at 4.5%, which remains well above the Federal Reserve’s 2% target for inflation, and it remains to be seen if the central bank will react to the batch of mixed data prints as Fed Governor Randal Quarlesacknowledges that “growth in the third quarter is likely to be lower than we had expected.”
As a result, the recent recovery in US yields may keep price of gold capped ahead of the Federal Open Market Committee (FOMC) interest rate decision on November 3 as the central bank prepares to scale back monetary support, and a shift in Fed policy may produce headwinds for bullion as the central bank plans to end its purchases of Treasury securities and mortgage-backed securities (MBS) “around the middle of next year.”
With that said, the price of gold may struggle to hold above the 200-Day SMA ($1792) amid the recent rebound in Treasury yields, and the recovery from the August low ($1682) may turn out to be a correction in the broader trend rather than a change in market behavior as longer-dated US yields retrace the decline from earlier this year.
Gold Price Daily Chart
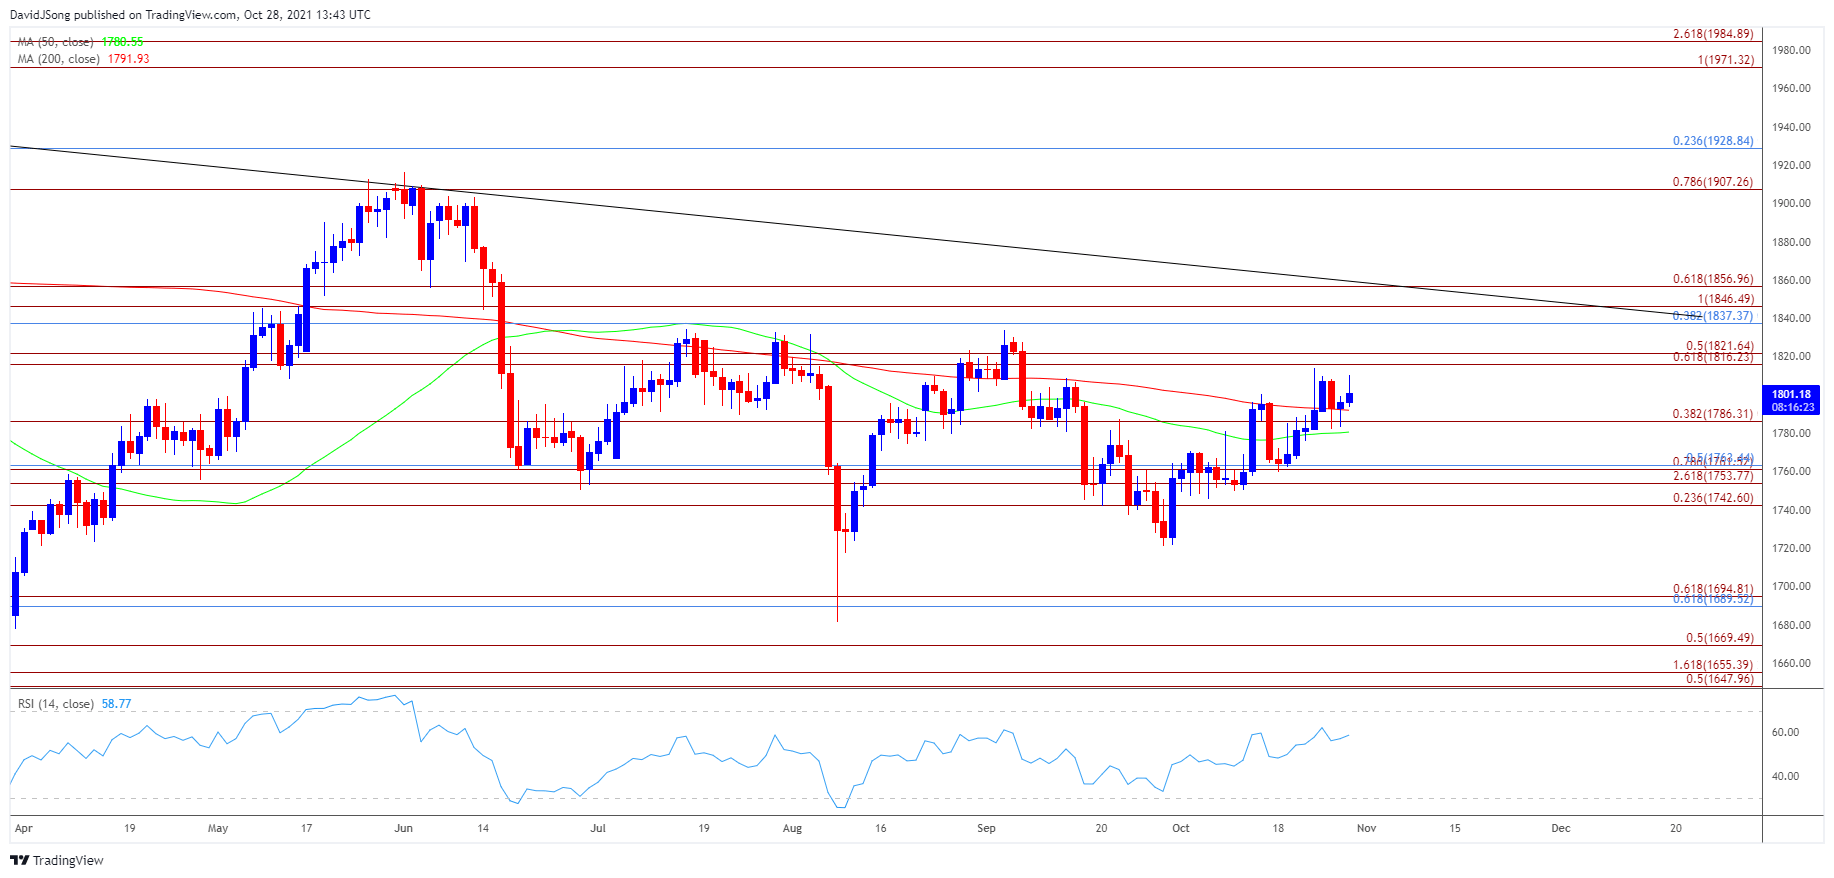
Source: Trading View
- Keep in mind, the negative slope in the 200-Day SMA ($1792) indicates that the broader trend for the price of gold remains tilted to the downside, with a ‘death cross’ formation taking shape in August as the Relative Strength Index (RSI) pushed into oversold territory.
- However, lack of momentum to test the March low ($1677) generated a textbook RSI buy signal as the oscillator climbed back above 30, with rebound from the August low ($1682) pushing the price of gold briefly above the 200-Day SMA ($1792) in September.
- A similar scenario seems to be taking shape this month as the price of gold trades back above the 200-Day SMA ($1792), but need a break/close above the $1816 (61.8% expansion) to $1822 (50% expansion) region to bring the September high ($1834) on the radar.
- Next area of interest comes in around $1837 (38.2% retracement) to $1847 (100% expansion) followed by the $1857 (61.8% expansion) region.
- At the same time, failure to hold above the 200-Day SMA ($1792) may push the price of gold back towards the $1786 (38.2% expansion) region, with a move below the 50-Day SMA ($1781) opening up the Fibonacci overlap around $1743 (23.6% expansion) to $1763 (50% retracement)
— Written by David Song, Currency Strategist
Follow me on Twitter at @DavidJSong
Be the first to comment