

Gold Price (XAU/USD), Chart, and Analysis
- Two-year US Treasury yields continue to soar.
- Gold eyes support below $1,700/oz.
Recommended by Nick Cawley
Download our Q3 Forecast
Tuesday’s US inflation report showed that price pressures in America are not abating and that further rate hikes are needed. Yesterday’s report showed inflation rising on a month-on-month basis, surprising market participants who had priced-in and positioned for a move lower. Financial markets are now showing a 35% chance that there will be a 100 basis point rate hike at the September 21 meeting. These heightened expectations can be seen in the interest-rate sensitive Two-year US Treasury which is now trading with a 15-year high yield of 3.78%. Higher-for-longer Treasury yields will weigh on gold in the months ahead.
Trade Smarter – Sign up for the DailyFX Newsletter
Receive timely and compelling market commentary from the DailyFX team
Subscribe to Newsletter
For all market-moving data releases and events, see the DailyFX Economic Calendar.
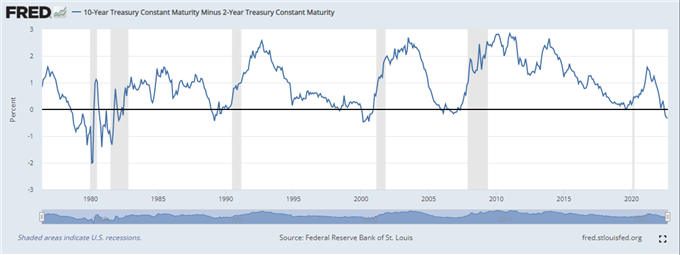
The Fed will also be watching the US Treasury 2-10 year yield spread, a closely followed recession indicator. The spread, negative 33 basis points, is 10 basis points away from the multi-year low made on August 8 this year.
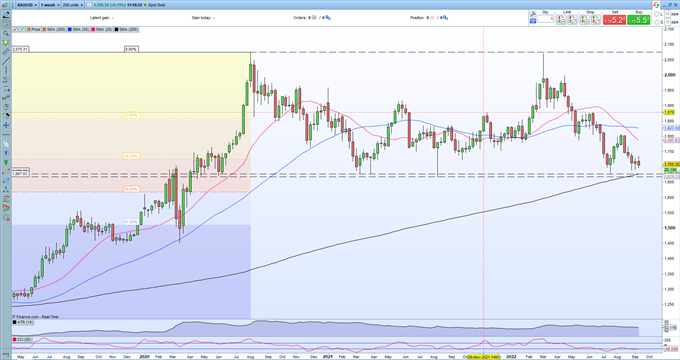
The weekly gold chart shows support at just under $1,700/oz. holding sellers at bay for now. A cluster of prior lows all the way down to $1,667/oz. will likely stem any sell-off although this will leave a gap back to the 50% Fibonacci retracement level at $1,618/oz vulnerable. Recent weekly highs at $1,736/oz. and $1,746/oz. should keep a lid on prices in the near term.
Gold Weekly Price Chart – September 14, 2022
Retail trader data show 87.77% of traders are net-long with the ratio of traders long to short at 7.18 to 1. The number of traders net-long is 6.78% lower than yesterday and 7.72% higher from last week, while the number of traders net-short is 3.89% lower than yesterday and 22.82% lower from last week.
We typically take a contrarian view to crowd sentiment, and the fact traders are net-long suggests Gold prices may continue to fall. Positioning is less net-long than yesterday but more net-long from last week. The combination of current sentiment and recent changes gives us a further mixed Gold trading bias.
| Change in | Longs | Shorts | OI |
| Daily | -7% | 11% | -5% |
| Weekly | 9% | -20% | 5% |
What is your view on Gold – bullish or bearish?? You can let us know via the form at the end of this piece or you can contact the author via Twitter @nickcawley1.
Be the first to comment