

Gold Price Talking Points
The price of gold appears to be stuck in a narrow range after testing the 50-Day SMA ($1903) in March, but the rebound from the moving average may keep the precious metal afloat as the indicator continues to reflect a positive slope.
Gold Price Holds Steady After Bouncing Back from 50-Day SMA
The price of gold struggles to retain the advance from the start of the week as Federal Reserve Governor Lael Brainard insists that the central bank could “reduce the balance sheet at a rapid pace as soon as our May meeting,” and speculation for a shift in the Fed’s exit strategy continue to produce headwinds for the precious metal as the central bank shows a greater willingness to normalize monetary policy at a faster pace.
Source: CME
As a result, the CME FedWatch Tool currently reflects a greater than 80% probability for a 50bp rate hike at the next interest rate decision on May 4, and it remains to be seen if the Federal Open Market Committee (FOMC) will embark on quantitative tightening (QT) as a growing number of central bank officials show a greater willingness to winddown the balance sheet.
Until then, swings in risk appetite may largely influence the price of gold as it appears to be unfazed by the ongoing rise in US Treasury yield, and the Russia-Ukraine war along with the recent weakness in global equity prices may keep the precious metal afloat as major central banks struggle to keep inflation under control.
With that said, the price of gold may continue to consolidate over the coming days as Fed officials prepare US households and businesses for an adjust in the exit strategy, but the decline from the yearly high ($2070) may turn out to be a correction in the broader trend as the 50-Day SMA ($1903) continues to reflect a positive slope.
Gold Price Daily Chart
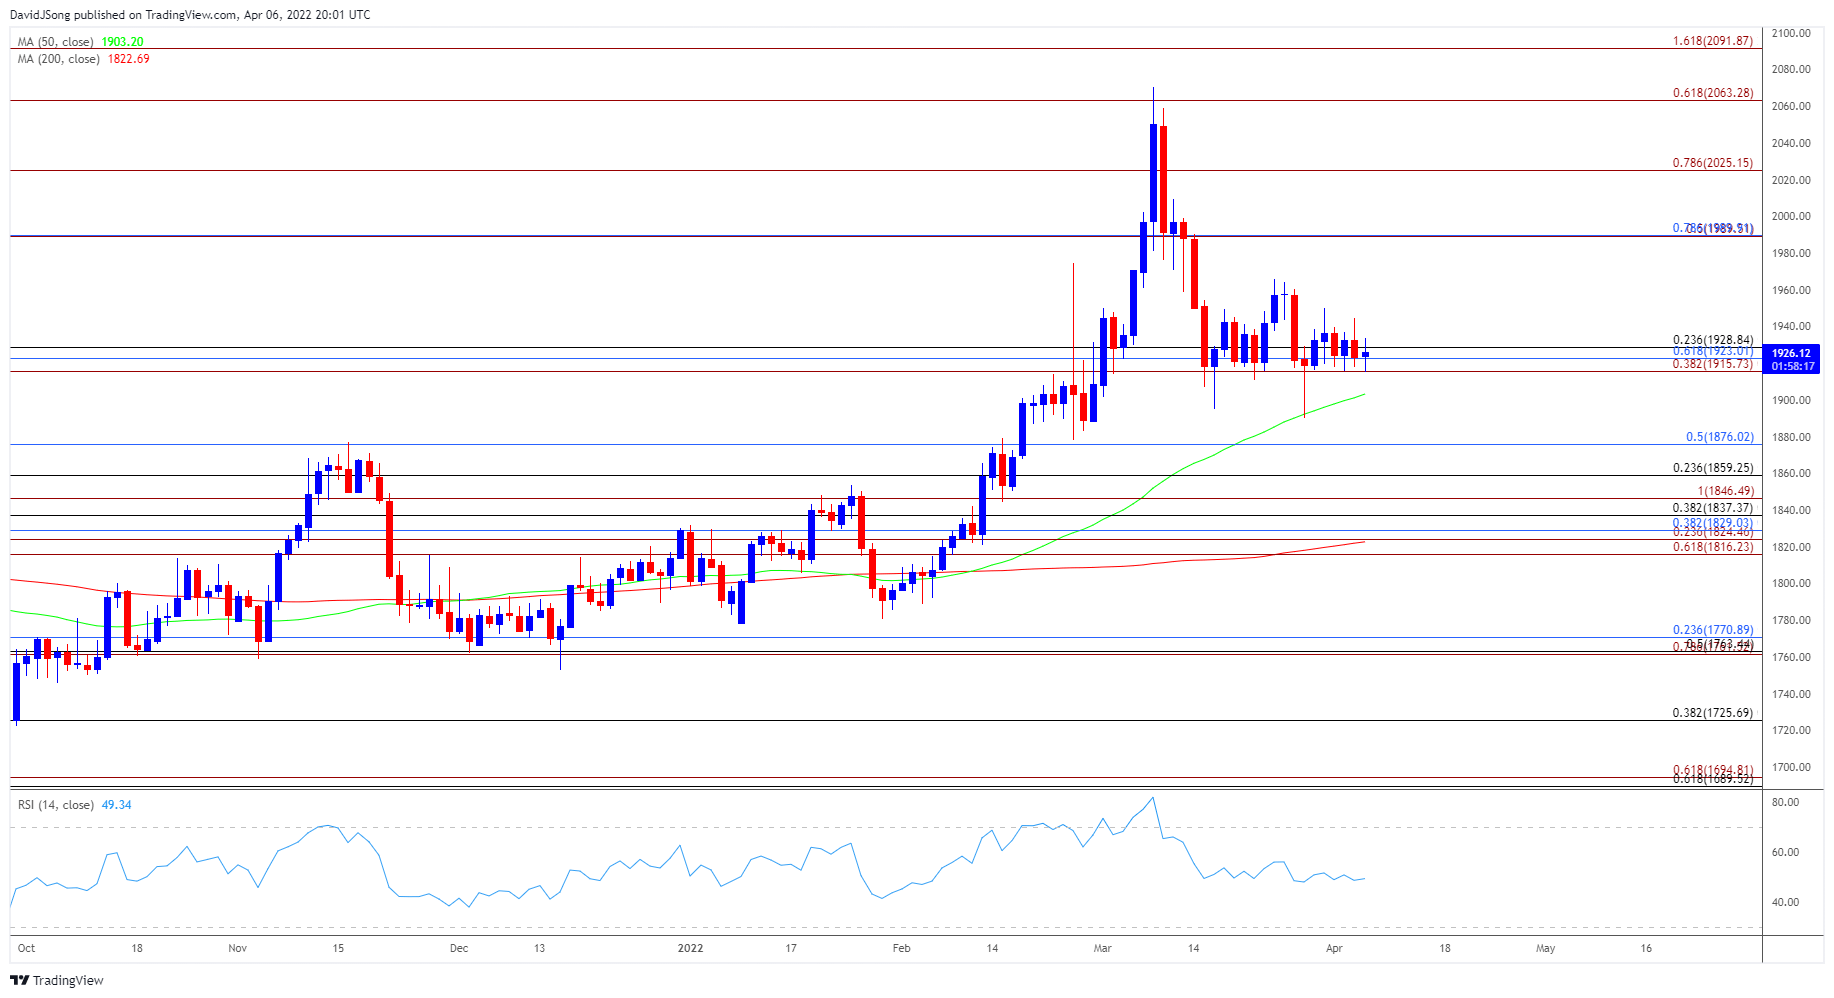
Source: Trading View
- The price of gold appears to have reversed course after failing to test the record high ($2075), with the decline from the yearly high ($2070) generate a sell signal in the Relative Strength Index (RSI) as the oscillator fell back below 70.
- Nevertheless, the price of gold has bounced back from the 50-Day SMA ($1903) to trade within a narrow range, and lack of momentum to close below the Fibonacci overlap around $1916 (38.2% expansion) to $1929 (23.6% retracement) instills a constructive outlook for bullion as the moving average continues to reflect a positive slope.
- Need the price of gold to break out of the opening range for April to bring the $1990 (78.6% retracement) area back on the radar, with the next area of interest coming in around $2025 (78.6% expansion).
- At the same time, a close above theoverlap around $1916 (38.2% expansion) to $1929 (23.6% retracement) could indicate a potential change in trend, with a move below the 50-Day SMA ($1903) opening up the $1876 (50% retracement) region.
— Written by David Song, Currency Strategist
Follow me on Twitter at @DavidJSong
Be the first to comment