

Gold Talking Points:
- Gold prices are breaking out again this morning, this time testing above the 1800 psychological level.
- Today’s move marks a greater than 7.5% gain from the low two weeks ago when Gold plunged down for a test towards the yearly low of 1680.
- The analysis contained in article relies on price action and chart formations. To learn more about price action or chart patterns, check out our DailyFX Education section.
Gold prices have continued to rally over the past week, leaving the ‘flash crash’ scenario from two weeks ago even further in the rearview. At this point, Gold prices are up more than 7.5% from the flash crash low of August 9th, which happened to post at a key spot on the chart, right around the same 2021 low that established a double bottom formation back in March.
To learn more about the double bottom formation, check out DailyFX Education
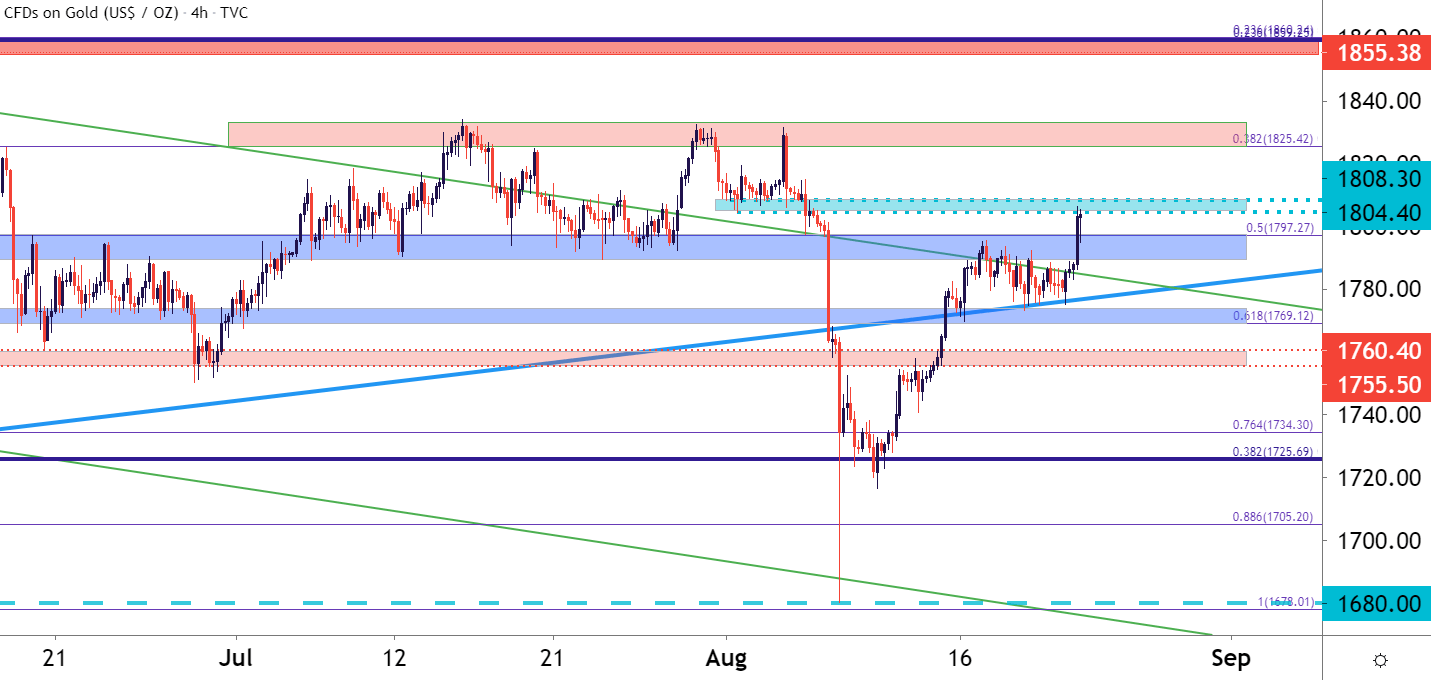
Last week started with Gold prices digging into a big zone of resistance running from 1789-1797. And while that zone helped to hold the highs for much last week, this week started with a bang as Gold prices scaled-above this zone and ran right into the next spot of resistance, plotted from 1804-1808. This current resistance area was a batch of swing-lows from early-August trade that have now been repurposed as resistance.
Gold Four-Hour Price Chart
Chart prepared by James Stanley; Gold on Tradingview
Taking a step back for some perspective and trends remain rather opaque. While the recent jump in Gold prices makes for bullish potential with shorter-term outlooks, the longer-term backdrop here remains unconvincing. It does, however, put emphasis on the 1834 level, as this is a potential double top formation, and if that high gets taken out then the door opens for a run at the 1855 zone.
Gold Daily Price Chart
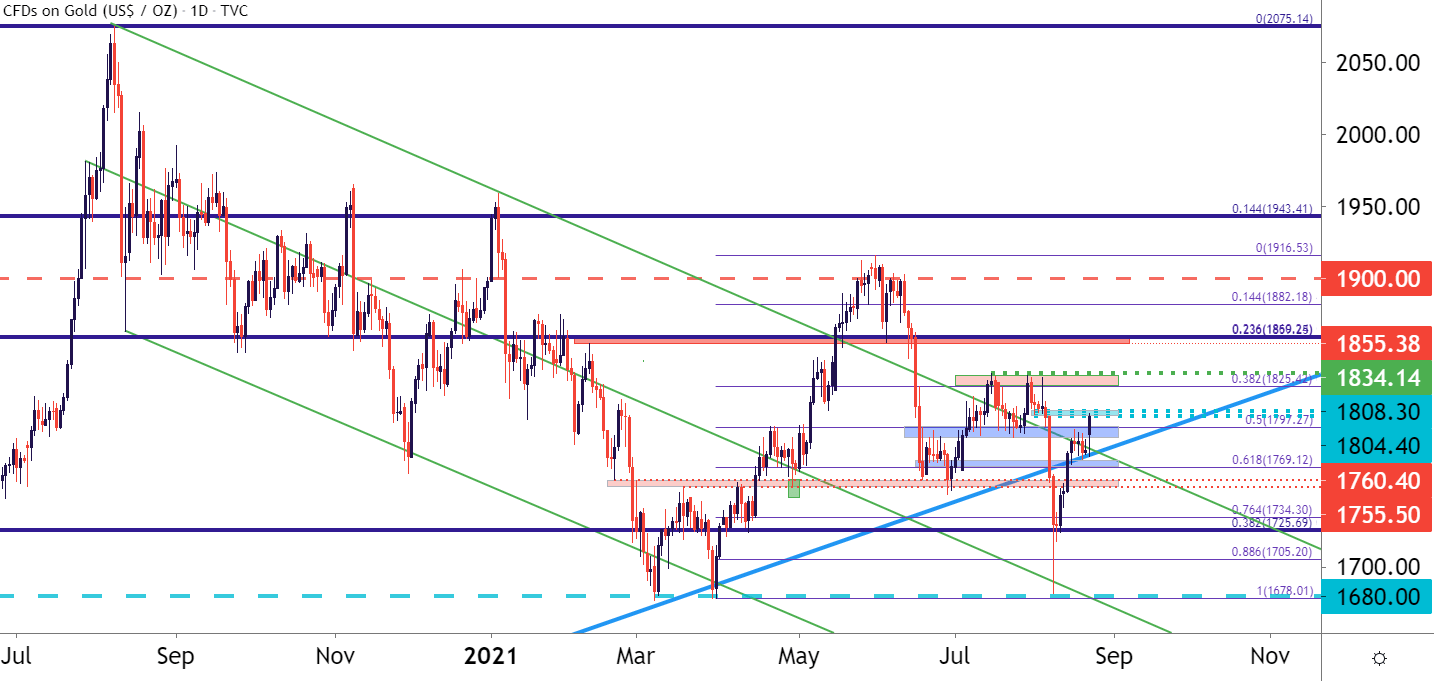
Chart prepared by James Stanley; Gold on Tradingview
Gold Levels
Given this week’s economic calendar with Jackson Hole on top of a slew of USD-related releases, and there could be considerable motive for Gold price action this week. While strength has been on full display, breakout potential remains at the current zone of resistance, spanning from the approximate 1804-1808, with another zone overhead from around 1824-1834. If bulls are able to take out that resistance, the next zone looming overhead runs from 1855-1860.
Underneath current price action there’s a support zone spanning from 1769-1775; this is the area that helped to hold last week’s lows. Below that is a secondary support zone running from 1755-1760, and below that is a third zone of interest from 1825-1834. The yearly low at 1680 continues to stick out, so if bears put in an outsized move, that 1680 level lurks below as a key marker sitting at the lows of Gold price action in 2021 trade.
Gold Eight Hour Price Chart
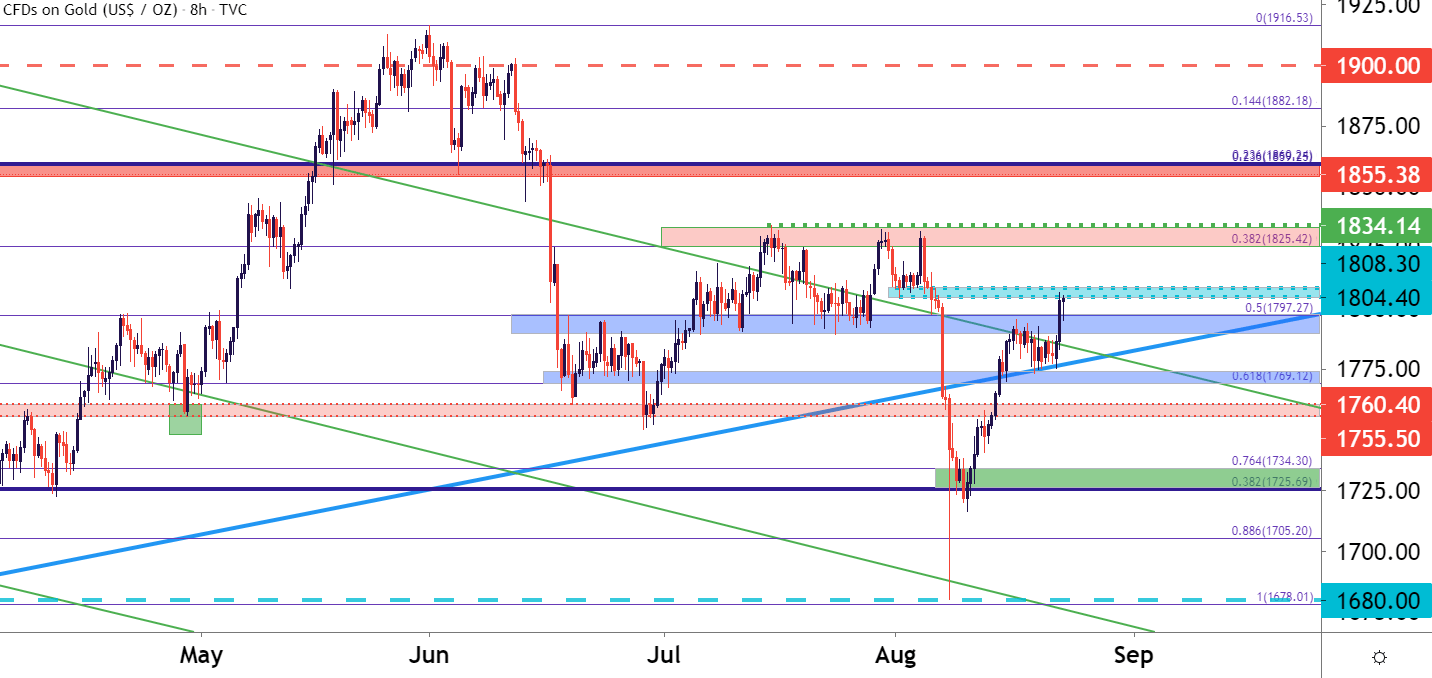
Chart prepared by James Stanley; Gold on Tradingview
— Written by James Stanley, Senior Strategist for DailyFX.com
Contact and follow James on Twitter: @JStanleyFX
Be the first to comment