

bymuratdeniz
Why Won’t Energy Companies Drill?
The most pressing question facing oil markets is why US shale drilling remains so muted despite high prices. A simple question whose answer is complex. Investment pundits and oil analysts all have theories, many of which we believe miss the underlying issues. Our research suggests several complicated factors have come together to keep the industry from increasing activity. The result is that US shale production growth (the only source of non-OPEC supply growth over the last decade) will likely remain muted for longer than most investors expect.
Oil bottomed in April 2020 at an unthinkable -$37 per barrel. The US oil-directed rig count bottomed a few months later, in August 2020 at 172 rigs – the lowest level since 2002. The US oil industry slashed its drilling activity by 80% compared with the pre-COVID level of 900 rigs in 2018 and by 90% from the 2016 high of 1,600 rigs.
Production has been equally volatile over the past three years. Responding to extreme COVID-related uncertainty, US producers stopped drilling new wells and postponed completing their already drilled wells. As a result, the inventory of drilled-but-uncompleted (DUC) wells ballooned. Low prices and concerns that storage would overflow compelled companies to significantly shut in existing production – a first for the industry. Total US crude production fell from 13 m b/d in December 2019 to 9.7 m b/d by May 2020.
Our models told us that resource depletion problems coupled with massive capital curtailment would make widespread shortages highly likely in the coming years. In the lead essay of our 2Q 2020 letter, we warned of an impending energy crisis – a highly unusual conclusion at the time, given that oil markets had turned negative only one month before.
Investors and analysts, as expected, vehemently disagreed with us. Not only were investors obsessed about demand, but they also became convinced that any nascent rally would run into a wall of new drilling. “Once oil hits $40, shale producers will start drilling again,” went the conventional wisdom. Oil did reach $40 in June 2020 but failed to illicit a drilling response. Even with oil at $60 per barrel in March 2021, the oil-directed rig count remained stuck at 300 – the lowest level, apart from the COVID lows, since the 2008-2009 financial crisis.
Following Russia’s invasion of Ukraine, oil prices broke through $100 per barrel for the first time since 2014. Most analysts predicted that triple-digit oil prices – the highest in nearly a decade – would produce a strong response in drilling activity. However, thus far, that response has been muted. Even now, after six months with oil prices greater than $85 per barrel, the US oil-directed rig count remains at 533 – nearly 40% below the 2018 levels despite oil prices having nearly doubled.
As this chart shows, a tight relationship has historically existed between oil prices and drilling activity. Between 2008 and 2018, the oil price alone explained 70% of the variation in drilling activity. Since 2020 however, this relationship has broken down. The industry should be turning 1,000 rigs; instead, they are stuck stubbornly at 533.
FIGURE1 Oil Price vs. Rig Count

Source: Bloomberg.
This lack of activity has confounded most analysts. Countless agencies and banks have revised their estimates for lower 2022 and 2023 US crude oil production. The US represented the bulk of non-OPEC growth over the past 17 years, making these disappointments impactful. Since June, the US Energy Information Agency (EIA) has revised its estimates lower for 2022 and 2023 US crude production every month. The International Energy Agency (IEA) revised its 2022 US production estimates lower while revising its 2021 figures higher, effectively reducing implied growth by nearly 200,000 b/d. Our models tell us these disappointments would have been even greater had it not been for the accelerated completion of the vast DUC inventory accumulated during COVID. With most of the DUC inventory now gone, the industry must either increase drilling activity or accept further disappointments. As of now, they are choosing the latter.
Indeed, the oil price justifies new drilling. Prices have rallied steadily for the last 30 months and remain at the highest level in nearly a decade while oil inventories continue to plummet. The market has shifted from structural surplus to structural deficit. We estimate that a company with high-quality Permian acreage can generate $38 mm in undiscounted cash flow from a well given $80 WTI, compared with $8 mm in drilling and completion costs. Given more than half of a well’s cash flow is generated in its first two years, the IRR at today’s oil prices is well over 200%.
Given these extremely attractive single-well economics, why are the companies not drilling more? Energy analysts throw vague references to capital discipline or labor shortages around. We don’t want to downplay these observations; however, we believe that other forces are at work.
After studying the issue in depth, we believe oil companies are acting very rationally, even if it seems counterintuitive. By keeping activity low, oil companies are simply responding to the signals sent from their three significant constituencies, all emphatically telling them not to drill. These constituencies are policymakers, investors, and their internal strategy teams.
Policy Makers
Despite calls for more production, policymakers remain highly hostile toward the fossil fuel industry. In the United States, President Biden repeatedly floated the idea of a windfall profit tax that would severely impact E&P profitability. Every proposal by the Biden Administration in response to high energy prices is either outright antagonistic towards the industry or, at best neutral. They have suggested banning crude exports (bad for producers and refiners), reducing gasoline taxes (good for consumers, neutral for producers), implementing windfall profit taxes (bad for producers), banning drilling on federal lands (bad for producers), and increasing subsidies for renewable energy (bad for everyone).
At no point has the administration signaled to the energy industry that its stance might be moving from outright hostility to accommodation. In the first of two congressional hearings in the last 18 months, members of congress criticized the sector for not cutting production faster; in the second, the same members blamed the companies for underinvestment, low production, and high energy prices.
The situation in Canada and Europe is similar. Energy CEOs remain highly concerned that any increase in oil development will be met with outright hostility and increased government scrutiny. No CEO longs to be part of the next congressional hearings. Under these circumstances, it is entirely rational for oil companies to put off increasing drilling activity and development.
Investors
Investors are also signaling oil companies to slow development. This claim might sound odd, given energy stocks have been one of the few bright spots in the market over the last two years. Since January 1st 2021, energy exploration and production companies (as measured by the XOP ETF) are up 182% compared with the S&P 500, which is up a mere 9% on a total return basis. However, as you will see, investors are sending clear no-drill signals to oil companies.
Despite the rally, energy stocks trade at near-record low valuations. As recently as September, E&P companies traded for 5.6x earnings and 3.4x EBITDA – the weakest readings in over a decade. On average, the stocks have traded for a median value of 22x earnings and 9x EBITDA over the past ten years. Currently, the sector trades for 7x earnings and 4x EBITDA – 68% and 55% below the long-term average, respectively, and only slightly above the September lows.
Low valuations encourage companies to favor returning capital to shareholders over increasing drilling, despite strong single-well returns. Here’s why:
The E&P sector trades at 0.8x its net-debt adjusted PV-10 per share. For those to whom this is unfamiliar, the SEC requires energy companies to publish their PV-10 value (or standard measure) annually in their 10-K. The companies must list their proven reserves and estimate the discounted cash flows using a given oil and gas price. Removing net debt and dividing by the share count yields the so-called “net-debt adjusted PV-10 value per share,” which we will refer to as NAV per share going forward. In the past, investors capitalized an energy company at a multiple of NAV, reflecting the future development potential not yet reflected in their proved reserve figure. The trick was to determine the appropriate multiple given the company’s assets.
We cannot recall a time when the entire industry traded for less than its NAV, and these extremely low valuations have tipped the scales away from drilling and toward dividends and share repurchases.
Consider a hypothetical E&P company trading at 0.8x its net-debt adjusted PV-10 per share. Our hypothetical company has $1 bn of PV-10, 10 mm shares, and $200 mm of net debt. The company’s CEO can choose between spending $100 mm on new drilling or buying back stock.
Assuming they can find and develop energy reserves for $15 per barrel of oil equivalent ((boe)), the company will book 6.7 mm boe of newly proved developed reserves for the $100 mm investment. At $80 crude and $5 gas, we estimate this investment would generate ~$130 mm in new PV-10. However, because the market capitalizes the company at only 0.8x NAV, the ending stock price would be virtually unchanged.
On the other hand, if the company bought back $100 mm of its stock, its share count would fall by nearly 20%. Adjusting for net debt and dividing by the new lower share count implies the stock would rise by over 5% – more than by drilling new wells. Therefore, the CEO that choses to return money to shareholders will enjoy a higher stock price and still have his best wells left undrilled. Under these conditions, no rational executive would rush to increase activity. Even though each well drilled would generate an IRR of nearly 80% in our example, the company is better off deferring development. The companies’ extremely low valuations explain this paradox. To summarize Edward Chancellor in “Capital Returns,” high multiples value growth and reward investment, while low multiples discount growth and encourage discipline.
We call this analysis a company’s “signal to drill,” and we believe it explains the industry’s reluctance to increase activity. Looking company by company, we estimate over 50% of the remaining undeveloped reserves in the US are in the hands of companies for whom it is better to return capital than to drill. Those companies with a clear “signal to drill” are growing production by 8%, while those without are shrinking by 4%. Pioneer Natural Resources (PXD) is an example of the former. PXD trades at a 100% premium to their NAV, and the company is growing production by almost 20%. In the latter category, Laredo Petroleum trades at a 70% discount to NAV, and its production is declining by 7%.
In 2018, the industry had a much clearer signal to drill despite lower prices. Oil averaged $51 per barrel in 2017 – 40% lower than today; however, we estimate the industry was valued at 4x NAV compared with 0.8x today. Using the same parameters as in the example above, drilling increases the stock price by 7%, whereas buying back stock at very high valuations would decrease the price by 10%. Even though a single well’s IRR is much better today than
it was in late 2017, the difference in valuations back then pushed oil companies to drill. If oil companies traded at 3x NAV, everyone would have a positive “signal to drill,” and a considerable drilling boom would be underway. These same companies today are being told to defer drilling and development because of depressed valuations.
Unless investors start redirecting capital back into the energy industry, valuations will remain depressed. The “signal to drill” will continue to push energy executives away from drilling and towards share buybacks. By deferring drilling, energy executives act entirely rationally and in the best interest of shareholders. Perhaps the most rational is Harold Hamm, Chief Executive Officer of Continental Resources. We estimate that Continental trades for 0.8x NAV, sending management the signal to slow drilling. At the same time, Continental can likely still generate a strong drilling rate of return – although it is suffering from resource exhaustion. Mr. Hamm has decided to break the “signal to drill” constraint by offering to acquire the remaining Continental shares he does not own and to take the company private. In doing so, Mr. Hamm hopes to unlock the latent value that the public markets refuse to acknowledge. He can undertake any drilling activity he deems appropriate since he is the only shareholder.
Strategy Teams
The last group signaling energy companies to keep development muted are their strategy teams: petroleum engineers, rig crews, and project managers. The reason is resource depletion. We have long argued that Eagle Ford and Bakken producers have drilled out most of their best wells, so production would likely plateau and decline. Over the past years, several companies have gotten into serious trouble by running out of high-quality inventory. As recently as 2017, Oasis Petroleum, a sizeable Bakken driller, claimed they retained 20 years of top-quality Tier 1 drilling locations. However, only a few months later, they tacitly acknowledged they were running out by closing a high-priced Permian acquisition to exit the Bakken and forestall future production declines. The strategy did not work, and Oasis declared bankruptcy in September 2020.
Similarly, Whiting Petroleum stated they had a decade of Tier 1 locations before declaring bankruptcy in mid-2020. The most dramatic example is Cabot Oil and Gas. Long a market darling that commanded a premium valuation due to its perceived asset quality, Cabot claimed to have had 20+ years of top Tier 1 drilling inventory in the prized northeast corner of the Marcellus. Our models, however, suggested that Cabot’s tier 1 acreage was not as extensive as claimed, so we have not owned the stock for many years. Cabot began to suffer Tier 1 inventory depletion several years ago, and in 2021 Cabot unexpectedly announced they would merge with Cimarex, a mid-quality Permian company. Based on our research, this merger addressed Cabot’s quickly depleting Tier 1 inventory in the Marcellus.
Energy executives are acutely aware of the dangers surrounding Tier 1 inventory exhaustion. After being forced out of their Tier 1 cores, companies will suffer from ever-declining well productivity, production shortfalls, lower profitability, and recurring earnings disappointments. Given such a scenario, even executives with the best remaining acreage are reluctant to increase drilling programs that speed the depletion of their Tier 1 inventory.
F I G U R E 2 Tier 1 Permian Wells Drilled Through 2018 (28% drilled)
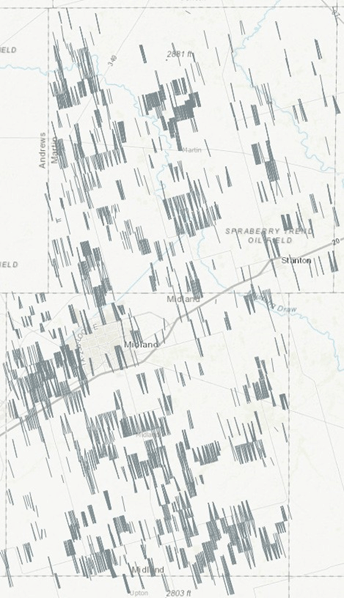
Source: NoviLabs, G&R Models
F I G U R E 3 Tier 1 Permian Wells Drilled Through 2022 (61% drilled)
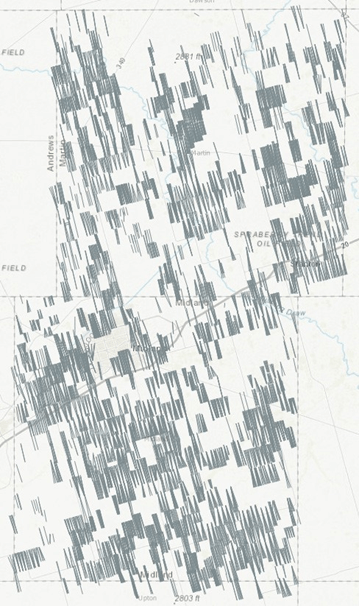
Source: NoviLabs, G&R Models
As Tier 1 acreage becomes scarcer, Tier 1 inventory management becomes more critical.
An in-depth study of Tier 1 acreage in the Midland and Marlin Counties in the Permian Basin clearly highlights these companies’ issues. Using our neural network, we can study the best areas of the Permian and estimate the inventory of undrilled locations in both counties. In the map below, you can see Midland and Martin County areas that we estimate have the best Tier 1 drilling locations. We estimate approximately 4,800 undrilled Tier 1 locations, based upon 10,000-foot laterals and 600 feet between wellbores. Operators have recently brought on 50 wells per month. At this rate, the area will be fully developed by 2030.
As recently as 2018, development in this area averaged 110 wells per month. If the companies operating in the play were to double drilling and go back to 100 wells per month, they would fully develop the acreage in only four years. A company with core Midland and Martin acreage would therefore need to start looking immediately to try and reinvent its asset base – a daunting task given the lack of exploration success over the past decade. If they waited, they would risk the fates of Oasis, Whiting, and Cabot.
By maintaining a more muted pace of drilling development, operators across the Permian are choosing to stretch out the life of their Tier 1 inventory, despite strong well economics suggesting accelerating development.
When you think about the challenges now being faced by the industry in these terms, you can easily see why oil company executives would keep the pace of development subdued. On the one hand, you could increase activity, risk attracting the ire of policymakers, have your stock price go down, and deplete your irreplaceable asset. On the other hand, you could return capital to shareholders, stay under the radar of policymakers, have the market reward your capital discipline, and keep your Tier 1 assets for a later time when the market will better value them.
Is it any wonder energy companies are not drilling?
In past cycles, the “signal to drill” has often been determined by the oil and gas price. When oil prices fell from $100 to $27 between 2014 and 2016, the industry laid down rigs because they could not generate a return on drilling. As prices recovered in 2016 and into 2018, the rig count rebounded by 600 rigs. Because of record low valuations, this is the first time we can recall where the “signal to drill” is driven by valuation instead of oil price. As a result, higher prices have not incentivized increased activity. Until investors allocate capital to the space and valuation improves, we expect drilling activity to remain subdued and oil shale supply disappointments to continue.
Market Overview – 3Q22
Inflation continued to surprise to the upside in Q3. Aggressive central bank tightening and ongoing worries over China’s “COVID-zero” lockdown policies and real-estate developer problems put downward pressure on both financial and commodity markets. Pockets of strength in global commodity markets were few; while North American and international natural gas and global thermal coal advanced, almost all other commodity markets were weak. The Goldman Sachs Commodity Index fell 10.8% due to the pullback in global oil prices. The Rogers International Commodity index, with less energy and more metal and agricultural exposure, fell by 9.1%. Natural resource-related equities declined less. The S&P North American Natural Resource Stock index declined only 2.2%, whereas the S&P Global Natural Resource Index (with more metals and agriculture and less energy exposure) fell 5.1%.
Overall, global stock markets were also very weak during the quarter. US equity markets (as measured by the S&P 500) fell 4.9%, while global equity markets (as measured by the MSCI All-Country World index) fell 7.2%.
Year-to-date, both commodity and related natural resource equities continue to outperform broad financial markets. Since the beginning of the year, the Goldman Sachs Commodity Spot index advanced over 20%, while the Rodgers International Commodity index rose 14.5%. In the equity markets, the S&P North American Natural Resource stock index increased 11.6%, while the S&P Global Natural Resource index fell 6.6%. By comparison, broad-based global equity markets have been very weak. The S&P 500 Index fell by 23.9% over the first nine months of 2022, while the MSCI all-world index pulled back a steep 26.7%.
Oil Market
Oil prices pulled back significantly in Q3, even as crude fundamentals continued to tighten. Worries of a Fed-induced global recession, combined with the measurable effect of China’s COVID-19 lockdown policies, pushed oil prices down. WTI fell almost 25%, while international prices, measured by Brent crude, fell 22%. Global inventories, adjusted for releases from the strategic petroleum reserves (SPR), continue to decline sharply. Not only are SPR releases distorting commercial inventory levels, but they are also masking a severe development: oil demand has already reached and is about to surpass global oil pumping capability.
The math is simple, yet no one has bothered to notice. We calculate global demand at 102 mm b/d, while non-OPEC supply (including OPEC NGLs) is approximately 71 mm /d, and OPEC crude production is 29.9 mm b/d., Global demand exceeds supply by 400,000 b/d. Given normal seasonality in oil markets, demand often exceeds production in Q4, leaving inventory drawdowns to make up the difference. In the past, when demand would exceed production in Q4, the industry always held significant pumping capability in reserve.
However, we believe OPEC’s current output, at 29.9 mm b/d, represents its maximum capacity. Not only is OPEC pumping less than 2 mm b/d below their quota, but we believe Saudi Arabia’s current production (~ 11mm b/d) is putting strain on their fields and is unsustainable – a subject we have covered in the past. With any contrarian thesis, we lay out roadmaps that try and predict what we should expect to see if we are heading in the right direction. In 2019, when Saudi Aramco (ARMCO) released its first reserve report in nearly 50 years, we predicted their production could not exceed 10.5 m b/d for any sustainable period without incurring material field damage. As a “mile maker,” we stated that anytime Aramco pumped above 10.5 m b/d, they would quickly announce an unexpected production cut. These “surprise” curtailments occurred in 2019, 2020, and again today
In today’s example, weak oil demand has given the Saudis cover to slow production once again. We continue to believe the real reason they slowed production is field exhaustion.
Assuming our models are correct and the Saudis cannot pump more than 10.5 mm b/d, OPEC pumping capacity is much lower than stated. Nearly every other OPEC member cannot achieve their quotas, and the 1.5 m b/d of unused Iranian capacity remains sanctioned. Since Iranians are now providing weapons to Russia, the probability of the US lifting its sanctions is quite remote. Considering these, we believe OPEC’s pumping capacity is only 31 m b/d and not the commonly stated (and accepted) 34 m b/d.
With demand now pushed up against total pumping capability, the only thing keeping inventories from continuing their multi-year plunge has been the 1.5 mm b/d of coordinated releases from US, European, and Japanese strategic petroleum reserves. The world has become addicted to SPR sales to keep global markets balanced and prices from soaring.
The Biden administration has stated that SPR sales will continue into December, but they cannot go on forever. As of today, the US SPR has already fallen by 32% and, at current rates, will be entirely depleted within 17 months. Eventually, the SPR releases will slow, and with demand growing past pumping capability, we expect inventories will resume their sharp declines.
Inventories are about to fall below the levels seen back in 2007, just before oil surged to over $145 per barrel. A price spike to well above $200 per barrel is becoming more likely over the next six months.
Natural Gas Market
Global natural gas prices continued to exhibit strength. In the US, natural gas rose 25% in Q3 after having pulled back 40% in Q2 after the fire at the Freeport LNG plant knocked out two bcf/d of export capacity. Hot summer weather offset the lost export capacity, causing US gas prices to rally.
Summer temperatures in the US were 2.7% warmer than the 10-year average. When Freeport caught fire, US inventories were 2.0 tcf – 340 bcf below the 10-year average. By September 30th, US natural gas inventories were 340 bcf below average, despite the Freeport outage. With only six weeks before the end of the injection season, we will likely begin the withdrawal season with inventories 10% below the five and 10-year average.
US gas supply has grown by 3.7% year-over-year, but we believe this will moderate as we progress into 2023. Nearly 80% of the growth comes from just two fields: the Haynesville and the Permian. Although we believe the Permian will continue to grow by 1 bcf per day per year, our modeling suggests that the Haynesville’s growth will slow significantly.
Turning to the Marcellus, the field’s performance confirms our prior modeling. Marcellus production peaked in December 2021 at 26.5 bcf per day and has fallen to 25.1 bcf per day, according to the Energy Information Agency (EIA), wiping out any growth since December 2020. It now looks like the Marcellus started to plateau 22 months ago, and we believe the field may soon begin to decline, just like what happened to the Barnett and Fayetteville 10 years ago – a subject we discussed in previous letters and at our investor day.
Although the continued growth in gas supply combined with the loss of Freeport LNG demand has pushed out our thesis concerning the convergence of US and international gas prices, we still have great confidence this will occur at some point in 2023. It appears the Marcellus is in the process of rolling over, which is very much in line with our models. Those same models suggest we will see a significant slowdown in the Hayneville’s growth very soon. The Haynesville rig count has doubled since the 2020 COVID-related bottom but has stagnated over the last 10 months.
Our neural network suggests that the Hayneville (like the Marcellus) is running out of Tier 1 drilling locations. If this is correct, we should expect drilling activity to stagnate, which seems to be happening right now.
Although the natural gas market is highly weather dependent, the potential return of the Freeport LNG export facility sometime in the next few months, combined with low storage levels, and the potential for both the Marcellus and Haynesville fields to plateau, makes us believe our convergence thesis is a high probability 2023 event.
The Golden Pass LNG facilities and the Cheniere Corpus Christi Stage 3 expansion should ramp up at the beginning of 2024, adding 4 bcf per day of export capacity. Starting at the beginning of 2025, Plaquemines will ramp up, adding another two bcf/d of export capacity.
We expect the US will have almost 20 bcf / day of export capacity by the end of 2025. Given our supply modeling, we believe all this new demand to feed LNG exports can only be met by much higher natural gas prices.
International gas prices continued their advance during Q3. European natural gas advanced by 15%. At the end of September, unidentified assailants significantly damaged Nord Stream 1 and 2 through a series of explosions in what now seems to have been an act of sabotage. Although the extent of the damage remains unknown, we do not believe engineers can attempt any repairs before next summer.
Although little gas was flowing through Nord Stream 1 at the time, it provided six bcf/d to Europe (12% of total demand) as recently as May. These volumes have now been cut off for the foreseeable future, regardless of the outcome of the war in Ukraine.
The European energy crisis has become entirely dependent on winter weather – a sobering thought in this day and age.
Coal
Coal prices were once again strong in Q3. Thermal coal prices in the US advanced, and volumes with access to international markets were particularly strong. Illinois Basin coal advanced by 55%, while Central Appalachian thermal coal rallied by almost 25%.
Seaborne thermal coal was also strong, with Australian thermal coal advancing by 12%. Since the beginning of the year, coal has been the best-performing asset class, with prices rising between 120% and 350%. The structural deficit in global natural gas, combined with the Russian curtailment of gas shipments into Europe, has stimulated coal consumption. However, other factors are also at work. In a November 9th piece in the New York Times entitled “China Keeps Burning More Coal,” the authors remind readers that China still has plans to add significant coal-fired electricity generation over the next five years., A quirk in China’s climate pledge gives China a perverse incentive to burn as much coal as possible between now and the decade’s end. China remains a large coal importer, and further increases to its coal-fired power base will add upward pressure to Seaborne thermal coal. Over the past 120 years, every commodity bull market has been led by coal equities, including the bull market experienced during the Great Depression. Once again, coal equities have been the best-performing sector since this commodity bull market began in 2020. History is repeating itself.
Precious Metals
Gold and silver have been correcting for over two years, and the selloff continued into Q3. Gold and silver fell 8% and 6% during the quarter.
Precious metals equities were also weak in Q3. Gold stocks (as measured by the GDX ETF) fell 12%, while silver stocks (as measured by the SIL ETF) fell 7%. Since the peak in August 2020, gold and silver have pulled back 20% and 33%, respectively, while the decline in the related equities has been even more severe. Gold stocks fell by nearly half, while silver stocks fell 53%. Given the substantial price pullbacks, precious metals equities are selling at extremely low valuations.
Maintaining minimal exposure to precious metals over the last two years has been the right call, especially given the vast outperformance of other natural resource sectors like energy exploration and production stocks, which have now appreciated by 200% over the same two-year period.
Given the low valuation of gold equities and our belief that a new bull market will come to dominate the natural resource sector for much of this decade, we continue to watch closely for signs that the corrective phase is nearing an end.
In previous letters, we discussed the positioning of gold and silver futures traders on the COMEX exchange. When commercial traders (the smart money) go net long and speculators (the trend followers or dumb money) go net short, it is often a signal that a significant bottom has been put in. Since the monumental bottom in both gold and silver took place in the early 2000s, the number of instances when COMEX gold and silver commercial traders went net long and speculators went net short have been few and far between. The last time was back in September 2018, which in retrospect, turned out to be an excellent time for investors to increase their precious metals exposure.
In our last letter, we highlighted how silver traders were about to go net long (a buy signal) while gold traders still had a ways to go. Since then, silver traders on the COMEX have clearly flashed a buy signal. On the second week of August 2022, silver speculators went net short by 12,000 contracts, while commercial traders went noticeably net long.
F I G U R E 4 COMEX Silver Net Positioning ( Silver traders are flashing strong buy signal in August ’22 )
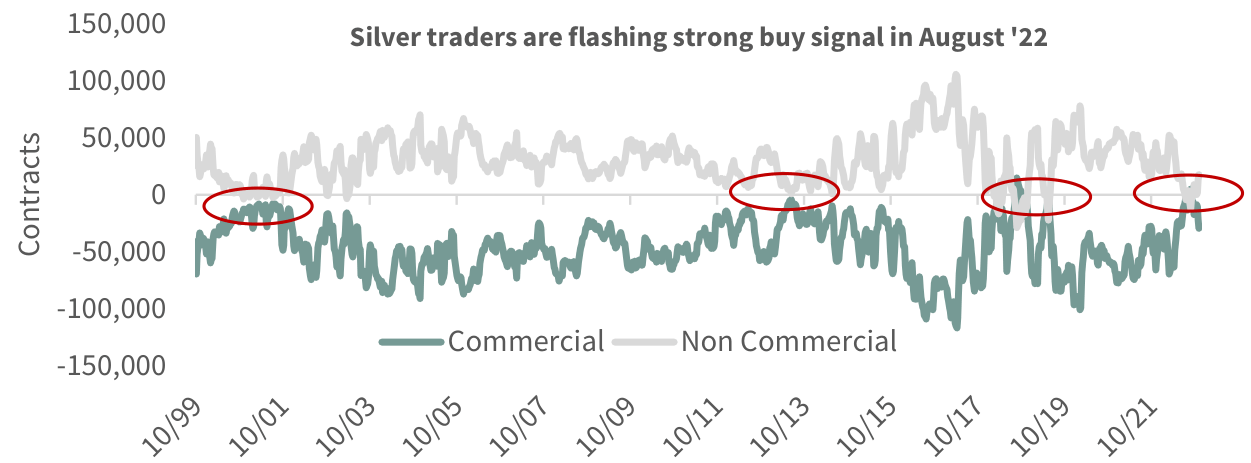
Source: Bloomberg.
Gold traders on the COMEX have yet to flash a buy signal, but they are getting closer. As we write, commercial gold traders are net short 80,000 contracts, down significantly from the 140,000 contracts they were net short when we wrote our Q2 letter. COMEX gold speculators have also greatly reduced their net long position. Over the last three months, they liquidated almost 60,000 contracts and now stand only 68,000 net long. Commercial traders are getting very close to flashing a buy signal.
F I G U R E 5 COMEX Cold Net Positioning
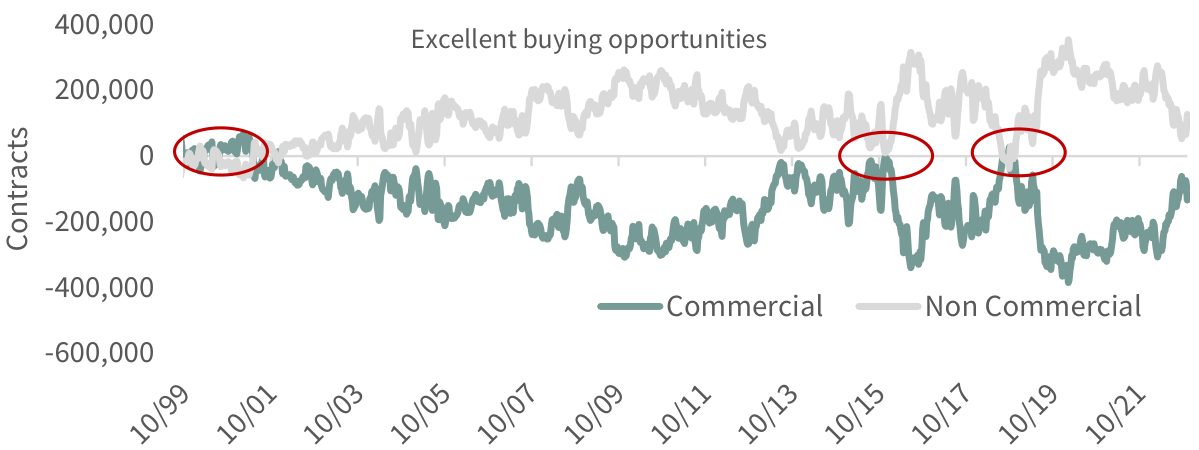
Source: Bloomberg.
In 2018, silver traders flashed a buy signal in April, seven months before a similar sign appeared in the gold market. If history repeats itself, we may have to wait another six months before COMEX gold traders follow their silver colleagues.
The positioning of COMEX silver traders is also reflected in the divergence between the physical silver and gold ETFs. The chart below clearly shows that the eight physical silver ETFs we monitor have significantly slowed their liquidation.
Between April and mid-August, silver ETFs liquidated 3,800 tonnes of physical silver. Since COMEX traders flashed their buy signal in August, the same 10 ten silver ETFs we track shed only 650 tonnes – 82% less. In contrast, physical gold ETFs continue to shed metal aggressively. Between April and mid-August, the 16 physical gold ETFs we monitor liquidated 200 tonnes of gold. Since then, these same ETFs have continued liquidating an additional 170 tonnes. Instead of slowing their liquidation, they have accelerated.
F I G U R E 6 Physical Silver ETFs

Source: Bloomberg.
F I G U R E 7 Physical Gold ETFs
Source: Bloomberg.
The corrective phase in precious metals is not over, but the end is getting closer. If we repeat the 2018 experience, which produced an excellent buying opportunity, silver COMEX traders’ August buy signal will be confirmed by COMEX gold traders sometime in the next three to six months.
We have slowly added to our gold and silver equities over the last six months, taking advantage of the 45% price pullback. As of today, we are not yet fully invested. If we get a bullish confirmation from COMEX gold traders, we will likely increase our precious metals equity weighting.
And just one further observation regarding the underlying health of the current gold market.
Since central banks switched from net sellers to net buyers in 2008-2009, they have aggressively accumulated metal. Between 2011 and 2019, central banks added 500 net tonnes annually. In 2020, central banks pulled their buying back significantly. As we discussed at the time, we worried that central banks moving from buyers to sellers would mean that the corrective phase in precious metals might get worse. In retrospect, this did not happen. Strong central bank buying resumed promptly in 2021 and has continued into 2022. Central banks accumulated 399 tonnes of gold in Q3 – a record – and year-to-date purchases total 673 tonnes, more than the total purchases in any full year since 1967, according to the World Gold Council. Buyers included Turkey, Uzbekistan, Qatar, and India. Furthermore, the World Gold Council said that an undisclosed central bank bought a substantial amount of gold, igniting speculation that China might be accumulating metal.
Robust central bank buying is another data point underpinning our thesis that the corrective phase in precious metals is rapidly approaching an end.
In our upcoming Q4 letter, we will discuss price targets for both gold and silver in the upcoming bull market. We firmly believe that the gold price and the Dow Jones Industrial Average could cross this decade well. Although seemingly impossible, we would like to remind you that the Dow and gold nearly crossed in 1895 and again in 1932-1934. They did cross in January 1980; in our next letter, we will discuss how all this could happen again in the ‘20s.
Agriculture
Grain prices were mixed in Q3. Severe summer drought conditions in Europe pushed wheat higher, while corn and soybeans slipped on improving growing conditions here in the US. Fertilizer prices were also mixed this quarter. After their sizeable Q2 pullback, nitrogen prices rebounded 20%, while phosphate and potash prices pulled back 4% and 25%, respectively. In response to the Ukraine invasion and the dry global conditions that dominated the beginning of the northern hemisphere growing season, the global agricultural complex peaked in May. Since then, improved growing conditions, combined with the removal of Russia’s Black Sea grain blockade in July, have ushered in a corrective phase in agricultural prices.
Even though grain prices pulled back, markets remain tight and are vulnerable to any supply disruption. Weather and Ukraine continue to be factors hindering supply. Excessive heat and semi-drought conditions in the eastern half of the US put a significant dent in the size of both corn and soybean crops. As late as June, the USDA, in their World Agricultural Supply and Demand Estimates (WASDE) report, projected the US corn crop would be 14.46 bn bushels (81.7 mm harvested acres at an assumed yield of 177 mm bushels per acre – a record). The USDA June WASDE report predicted the soybean crop would reach 51.5 bn bushels (90.1 mm acres harvested at an assumed yield of 51.5 bushels per acre – a near record).
Because of dry conditions and excessive heat, the USDA significantly reduced the estimated size of the corn and soybean harvests in their latest WASDE October report. For corn, the USA reduced the expected crop by 4% compared to the June estimate – harvested acres had fallen to 80.8 mm harvested acres and estimated yields to 171.9 bushels per acre. For soybeans, they reduced the expected crop by 7% compared with the June estimate – harvested acres had fallen to 86.6 mm acres, and the estimated yield had dropped to 49.8 bushels per acre.
Reduced harvest size has also lowered the USDA’s corn and soybean 2022-2023 ending stock inventory estimates. They now expect US corn ending stocks to be 1.172 bn bushels – at the bottom third of observations over the last 50 years. Soybean ending stocks are estimated to be only 200 mm bushels – again in the bottom third of observations over the previous 50 years.
Drought has also gripped Europe this summer, significantly impacting expected grain yields. The USDA estimates that the European Union’s 2022 wheat harvest will be 4% smaller than the 2021 harvest, while the coarse grain harvest (which includes corn) will be 10% smaller.
India’s precipitation this monsoon season was 30-40% below average in many parts of the country, negatively impacting crop yields. Winter wheat was the first crop to be affected as extremely hot spring temperatures significantly reduced the size of the wheat crop. Over the last decade, India has become a significant wheat exporter. In one of the first modern observations of “food nationalism” – a subject we have discussed in previous letters – the government announced a ban on wheat exports in June, citing the sudden spike in prices and the resulting food security risks within India.
Because of a disappointing monsoon, the USDA lowered India’s rice crop estimates by almost 6% compared with its original forecast. India is the world’s second-largest rice producer and, by far, the world’s largest rice exporter, accounting for almost 40% of the global export market. Given disappointing yields, India banned shipments of broken rice starting in September and slapped a 20% export tax on several varieties of unbroken rice.
We believe food nationalism will become a recurrent problem disrupting the global food chain (with resulting price spikes) throughout this decade. Banning exports, as India has already done with wheat and rice, is a prime example of what to expect as food nationalism spreads.
Regarding the war in Ukraine, grain exports through the Black Sea continue even though Russia said they were suspending their June agreement allowing Ukrainian grain exports via the Black Sea.
However, underlying problems are still besetting Ukraine’s agricultural economy. Workforce, fuel, and fertilizer shortages, combined with extensive war-related field damage, have significantly reduced the size of the Ukrainian grain harvest. The USDA estimates Ukraine’s 2022 wheat and coarse grain production will be down 40% and 30%, respectively. Ukrainian exports of wheat and coarse grains are enormous and represent 15% and 10% of the total export supply. The USDA estimates that Ukrainian export volumes will drop between 40 and 50% in the 2022-2023 crop year.
Because of multiple supply disappointments worldwide, grain inventories remain low, and we will be susceptible to any supply shock: weather, war, or insect-related.
Uranium
Uranium markets were quiet during Q3. Prices started the quarter at $49 per pound and finished at almost the same price.
More and more people realize the massive renewable investment has created a series of unintended consequences, many of which can be alleviated by accelerating the investment in nuclear power. The recognition that nuclear power represents a highly safe source of carbon-free baseload power continues to gather momentum.
For example, Poland announced its intention to build its first nuclear power plant in October. Costing an estimated $20 bn, the three-unit Westinghouse AP1000 plant will replace aging coal plants and provide the country with increased energy independence. Poland joins the Netherlands in adding new nuclear power plants to the country’s energy mix. The French Council of Ministers also approved draft legislation to streamline the administrative and bureaucratic process needed to build new nuclear power plants near or within existing sites. France has announced plans to build 14 new reactors in the coming years, and if passed, this legislation will speed up the approval and construction process.
In early November, the Indian government announced its intention to triple the electricity generated from nuclear power by 2030. India has seven nuclear power plants operating and plans to construct ten new reactors in the next three years.
The last remnants of excess Fukushima-related inventory are now being rapidly drawn down. The uranium markets are about flip from a structural surplus to a structural deficit. A huge uranium bull market looms.
Copper
Base metals prices were weak in Q3. As in the oil markets, worries about a Fed-induced global recession and continued concern about Chinese COVID lockdown policies put downward pressure across the base metals complex. Copper prices pulled back 8 %, followed by nickel down 7%, zinc down 5%, and aluminum down 4%. Copper stocks, as measured by the COPX ETF, followed the metals down and fell by 8%. Large capitalization base metals stocks, as measured by the XBM base metal stock ETF, rose slightly by 1%.
An interesting piece in Bloomberg appeared on October 8th with the headline “China’s Billion-Dollar Cash-for-Copper Trade Grinds to a Halt”; however, the real intrigue was in the subhead: “China’s bonded warehouses are all but empty, and the implications are being felt across the copper market.”
Over the previous decade, copper traders had developed an obsession with the size and bearish implications of these mysterious copper inventories held in a Shanghai warehouse. Estimated to be as big as 1mm tonnes at various points last decade, these “bonded” warehouse inventories represented an almost unlimited, and bearish source of copper supply, according to traders. It now seems buyers have quietly drawn down nearly all these supposedly massive warehouse inventories over the last several years.
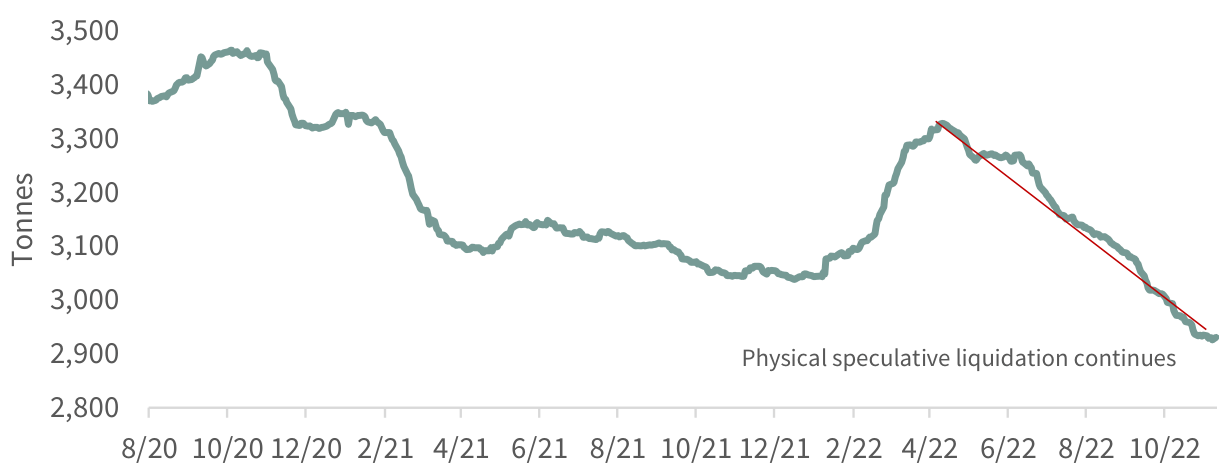
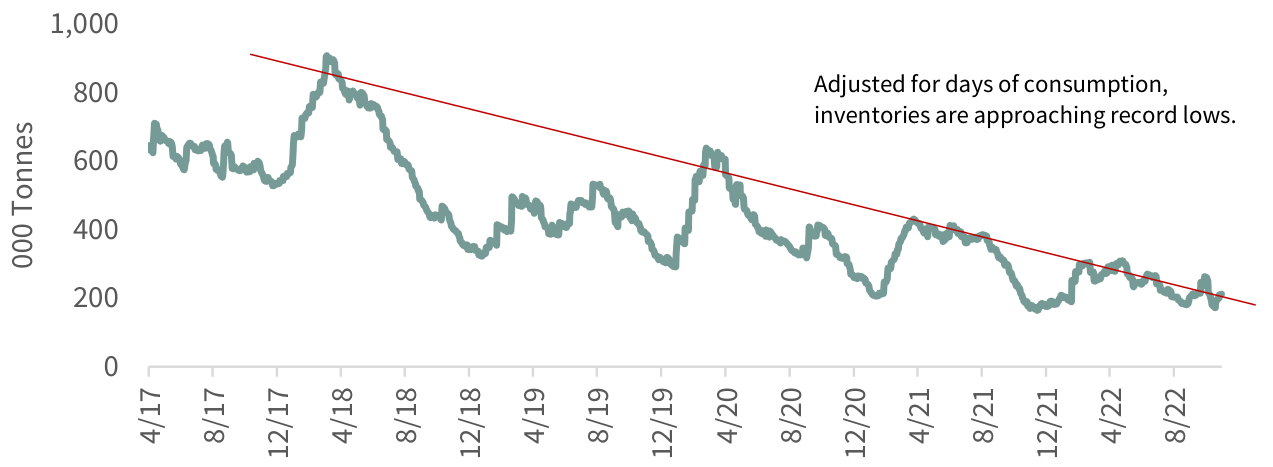
In previous letters, we discussed how copper inventories on the three big listed exchanges – the COMEX, LME, and Shanghai– had been in significant decline since 2017 and, after adjusting for consumption, were fast approaching the record lows seen back in 2005 and 2006. As you can see in the chart below, copper inventories have again declined and are now near record lows after being adjusted for consumption. The significant drawdown has mirrored the drawing down of exchange inventories in bonded copper warehouse inventories in China.
F I G U R E 8 Copper Listed Exchange Inventories
Source: Bloomberg.
Chinese copper demand over the last twelve months has strengthened significantly, and bonded warehouse inventories likely met most of the surge. The effects of this are already being felt in the market. China has become more reliant on imports to meet its demand; at the same time, global inventories outside of China are historically low. The Chinese copper market is at its tightest in more than a decade, and traders narrate how commercial users are now paying significant premiums for readily available copper, confirming the market’s tightness.
An interesting comment in the Bloomberg piece on the developing situation in China comes from the CEO of hedge fund Drakewood Capital Management Ltd: “The physical market is so tight, it’s like a room full of gunpowder – any spark and the whole thing could blow… without the Shanghai bonded inventory, we are living without a safety net.”
We are approaching a dangerous situation in global copper markets – similar to the crisis back at the end of 2005, where copper surged by almost 175% in just six short months.
Global copper demand remains extremely strong in the first eight months of 2022. According to the World Bureau of Metal Statistics (WBMS), global copper demand grew by 4.3% yearly. The growth in copper demand was broad-based. Even with the COVID-related lockdowns, Chinese copper demand grew by over 5% year-over-year. Europe also showed surprising growth. Led by demand rebounds in France and Germany, European copper demand increased a robust 4.7% for the first eight months of 2022. European copper demand, it should be noted, has now significantly passed through its pre-COVID 2019 peak.
The most crucial copper demand data point to note is India’s solid growth in copper demand. As our readers know, we believe India today is where China was back in 1999-2000, just before China’s copper demand surged. Based upon our copper models – models that track the copper investment needed to attain various levels of per capita GDP– we have outlined how a massive acceleration in India’s copper consumption should occur this decade. We couldn’t help but notice that Indian copper demand has surged 45% this year. Given India’s strong desire to grow and its present deficit in the amount of copper invested in its economy, we believe India could very well become a vast, underappreciated source of copper demand as this decade progresses.
On the supply side, copper mine supply growth lagged behind demand growth. According to WBMS data, global mine supply grew by 1.7% year-over-year for the first eight months of 2022. The only source of world mine supply growth is in the Democratic Republic of Congo (DRC). The massive Kamoa-Kakula project ramped up production last year, and the phase 2 expansion–which will take the mine’s projection up from 200,000 tonnes of annual copper production to 400,000 – is now almost complete. Construction has also started on the phase 3 expansion, adding an additional 200,000 tonnes of annual copper production. Output from the phase 3 expansion should begin in Q4 of 2024. DRC copper production is up 430 tonnes this year versus last; however, much of this surge in production has been offset by an unexpected 260-tonne fall in Chilean production. As we discussed in the lead essay in our Q1 2021 letter, “The Problems With Copper Supply,” the Chilean copper industry suffers from huge depletion problems that will be impossible to overcome as we progress through this decade. Confirming our analysis, CODELCO, in an August 26th press release, prominently mentioned declining ore grades as a primary reason for their disappointment in 2022 production. CODELCO also recently lowered their 2023 copper production guidance, again citing project delays and problematic ore grades as the primary reasons.
The limited number of world-class projects coming online in the next several years, combined with accelerating depletion problems in the world’s copper mine supply base, means that growth will continue to disappoint as we progress through this decade.
Disappointment in mine supply combined with robust demand growth is about to flip the global copper market into a “structural deficit.” We expect copper prices to surge in 2023 as copper traders finally realize that inventories can longer fill the gap between demand and supply. The next leg of the copper bull market is about to start.
|
Registration with the SEC should not be construed as an endorsement or an indicator of investment skill, acumen or experience. Investments in securities are not insured, protected or guaranteed and may result in loss of income and/or principal. Historical performance is not indicative of any specific investment or future results. Investment process, strategies, philosophies, portfolio composition and allocations, security selection criteria and other parameters are current as of the date indicated and are subject to change without prior notice. This communication is distributed for informational purposes, and it is not to be construed as an offer, solicitation, recommendation, or endorsement of any particular security, products, or services. Nothing in this communication is intended to be or should be construed as individualized investment advice. All content is of a general nature and solely for educational, informational and illustrative purposes. This communication may include opinions and forwardlooking statements. All statements other than statements of historical fact are opinions and/or forward-looking statements (including words such as “believe,” “estimate,” “anticipate,” “may,” “will,” “should,” and “expect”). Although we believe that the beliefs and expectations reflected in such forward-looking statements are reasonable, we can give no assurance that such beliefs and expectations will prove to be correct. Various factors could cause actual results or performance to differ materially from those discussed in such forward-looking statements. All expressions of opinion are subject to change. You are cautioned not to place undue reliance on these forward-looking statements. Any dated information is published as of its date only. Dated and forward-looking statements speak only as of the date on which they are made. We undertake no obligation to update publicly or revise any dated or forward-looking statements. Any references to outside data, opinions or content are listed for informational purposes only and have not been independently verified for accuracy by the Adviser. Third-party views, opinions or forecasts do not necessarily reflect those of the Adviser or its employees. Unless stated otherwise, any mention of specific securities or investments is for illustrative purposes only. Adviser’s clients may or may not hold the securities discussed in their portfolios. Adviser makes no representations that any of the securities discussed have been or will be profitable. Indices are not available for direct investment. Their performance does not reflect the expenses associated with the management of an actual portfolio. |
Editor’s Note: The summary bullets for this article were chosen by Seeking Alpha editors.
Be the first to comment