

Sundry Photography
In July 2022, GLOBALFOUNDRIES Inc. (NASDAQ:GFS) and STMicroelectronics N.V. (STM) announced plans to build a jointly operated semiconductor manufacturing facility in France. Thus, we have analyzed the planned expansion and determined the impact on GlobalFoundries in terms of its supply growth and whether it is sufficient to meet its demand growth based on its revenue by end markets. Also, we analyzed its project cost and how the government financial support could benefit the company’s free cash flow (“FCF”).
Partnership Supports Expansion of Capacity Growth by 5%
|
Revenue Forecast ($ mln) |
2019 |
2020 |
2021 |
2022F |
2023F |
2024F |
2025F |
2026F |
|
Wafer Shipments 300mm equivalents (‘000s) |
1,758 |
2,030 |
2,374 |
2,586 |
3,036 |
3,358 |
3,538 |
3,718 |
|
Growth % |
-5.6% |
15.5% |
16.9% |
8.9% |
17.4% |
11% |
5% |
5% |
|
Wafer ASP (Revenue per wafer) |
3,306 |
2,389 |
2,774 |
3,051 |
3,034 |
3,017 |
3000 |
2984 |
|
Growth % |
-0.6% |
-27.7% |
16.1% |
10.0% |
-0.6% |
-0.6% |
-0.6% |
-0.6% |
|
Revenue |
5,813 |
4,851 |
6,585 |
7,890 |
9,212 |
10,133 |
10,616 |
11,093 |
|
Growth % |
-6.2% |
-16.6% |
35.8% |
19.8% |
16.7% |
10.0% |
4.8% |
4.5% |
Source: GlobalFoundries, Khaveen Investments
According to STM, the jointly operated facility is targeted to reach full capacity by 2026 at 620,00 300mm wafers per year with a split between STM and GlobalFoundries of 42% and 58% respectively. Thus, we factored in GlobalFoundries’ share of production of the 620,000 wafers at a 58% share in our 2026 wafer shipment projection of the company. Assuming it takes 3 years to complete a fab based on Intel (INTC), we expect the facility to begin contributing shipments in 2025 for the company and projected its wafer shipment to increase by half of GlobalFoundries’ share of the 620,000 wafers in 2025, resulting in a growth of 5%. In 2026, as it is expected to reach full capacity, we accounted for the company’s 58% share of wafers in our 2026 forecast which is also an increase of 5% from the prior year.
Expansion Insufficient to Meet Demand Growth
|
Segment |
2020 |
2021 |
2022F |
2023F |
2024F |
2025F |
2026F |
|
Smart Mobile Devices |
2,421 |
3,350 |
3,892 |
4,184 |
4,497 |
4,834 |
5,196 |
|
Growth % |
38% |
16% |
7.49% |
7.49% |
7.49% |
7.49% |
|
|
Communications Infrastructure & Datacenter |
983 |
998 |
1,338 |
1,794 |
2,405 |
3,224 |
4,323 |
|
Growth % |
2% |
34% |
34.07% |
34.07% |
34.07% |
34.07% |
|
|
Home and Industrial IOT |
724 |
882 |
1,338 |
1,538 |
1,769 |
2,034 |
2,339 |
|
Growth % |
22% |
52% |
14.98% |
14.98% |
14.98% |
14.98% |
|
|
Automotive |
100 |
287 |
326 |
368.71 |
417.01 |
471.63 |
533.42 |
|
Growth % |
187% |
14% |
13.10% |
13.10% |
13.10% |
13.10% |
|
|
Personal Computing |
1025 |
480 |
272 |
296.21 |
322.57 |
351.28 |
382.54 |
|
Growth % |
-53% |
8.90% |
8.90% |
8.90% |
8.90% |
8.90% |
|
|
Non-Wafer and Corporate Other Revenue |
-402 |
588 |
700 |
700 |
700 |
700 |
700 |
|
Growth % |
-246% |
19% |
0% |
0% |
0% |
0% |
|
|
Total |
4,851 |
6,587 |
7,866 |
8,881 |
10,110 |
11,615 |
13,473 |
|
Growth % |
35.8% |
19.5% |
12.9% |
13.8% |
14.9% |
16.0% |
Source: GlobalFoundries, Mordor Intelligence, Business Wire, Global Newswire, Stratview Research, Khaveen Investments
Based on the table above of the company’s revenue breakdown by end markets, its Smart Mobile Devices segment was the largest segment accounting for 4.36% of total revenue. However, the segment which had the highest growth rate was the Automotive segment at 187% in 2021 but only represented a small portion of total revenues (2.84%). We projected its full-year 2022 revenue by prorating it based on the company’s Q1 & Q2 results. This is because we could not obtain historical segment data to c the company had only had its IPO in October 2021.
To project its revenue growth from 2023 onwards based on end markets, we referred to market forecasts by each end market including smartphones, data center, automotive and PC market forecast CAGRs. Based on this, we use this forecast as its demand growth and compared it with our supply growth projections.
|
Revenue Projections ($ mln) |
2020 |
2021 |
2022F |
2023F |
2024F |
2025F |
2026F |
|
Revenue (Supply) |
4,851 |
6,585 |
7,890 |
9,212 |
10,133 |
10,616 |
11,093 |
|
Revenue (Demand) |
4,851 |
6,585 |
7,866 |
8,881 |
10,110 |
11,615 |
13,473 |
|
Revenue Projection |
4,851 |
6,585 |
7,866 |
8,881 |
10,110 |
10,616 |
11,093 |
|
Growth % |
19.5% |
12.9% |
13.8% |
5.0% |
4.5% |
Source: GlobalFoundries, Khaveen Investments
Overall, we compiled our revenue projections by demand and supply and projected its total revenue growth. For the years 2022 to 2025, we projected the company’s revenue based on demand as it is lower than supply, which is the limiting factor for its growth. Then for 2025 and 2026, we projected the revenue based on supply due to it being lower than demand due to capacity constraints.
Expansion Supported by State Investment Positive for FCF Margins
FCF Margin Forecast (Without Government Financial Assistance)
GlobalFoundries, Khaveen Investments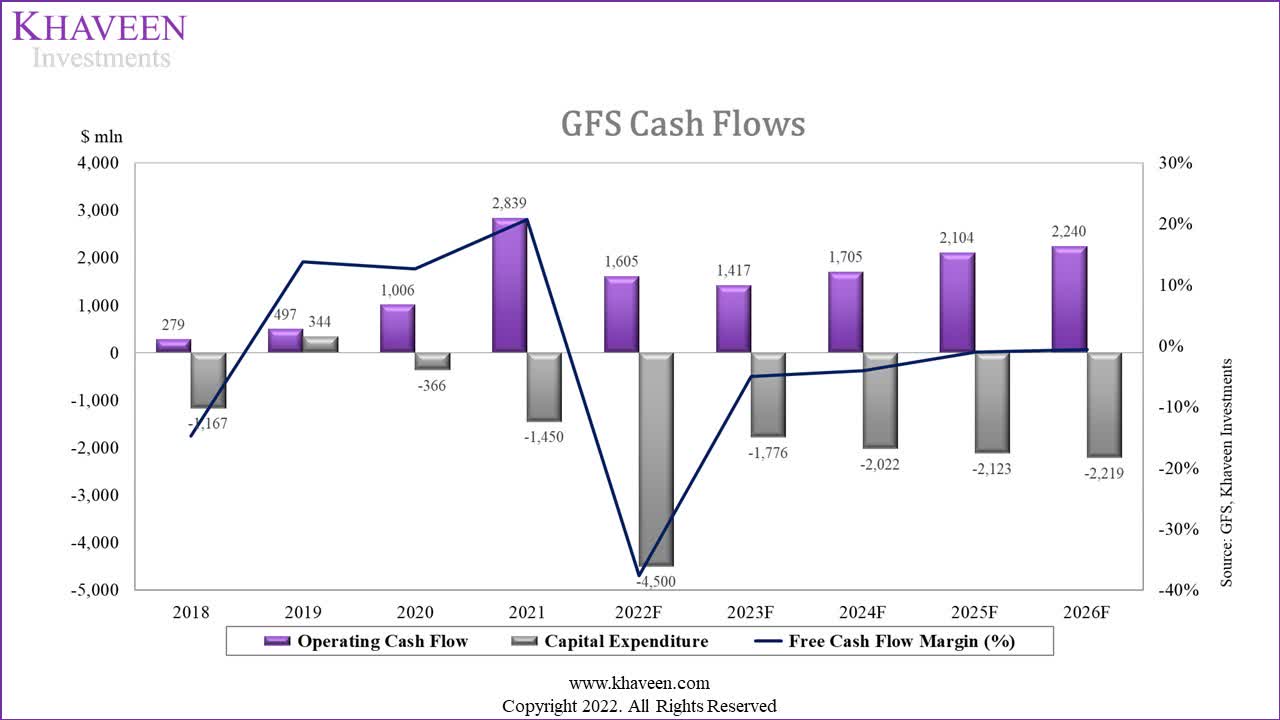
FCF Margin Forecast (With Government Financial Assistance)
GlobalFoundries, Khaveen Investments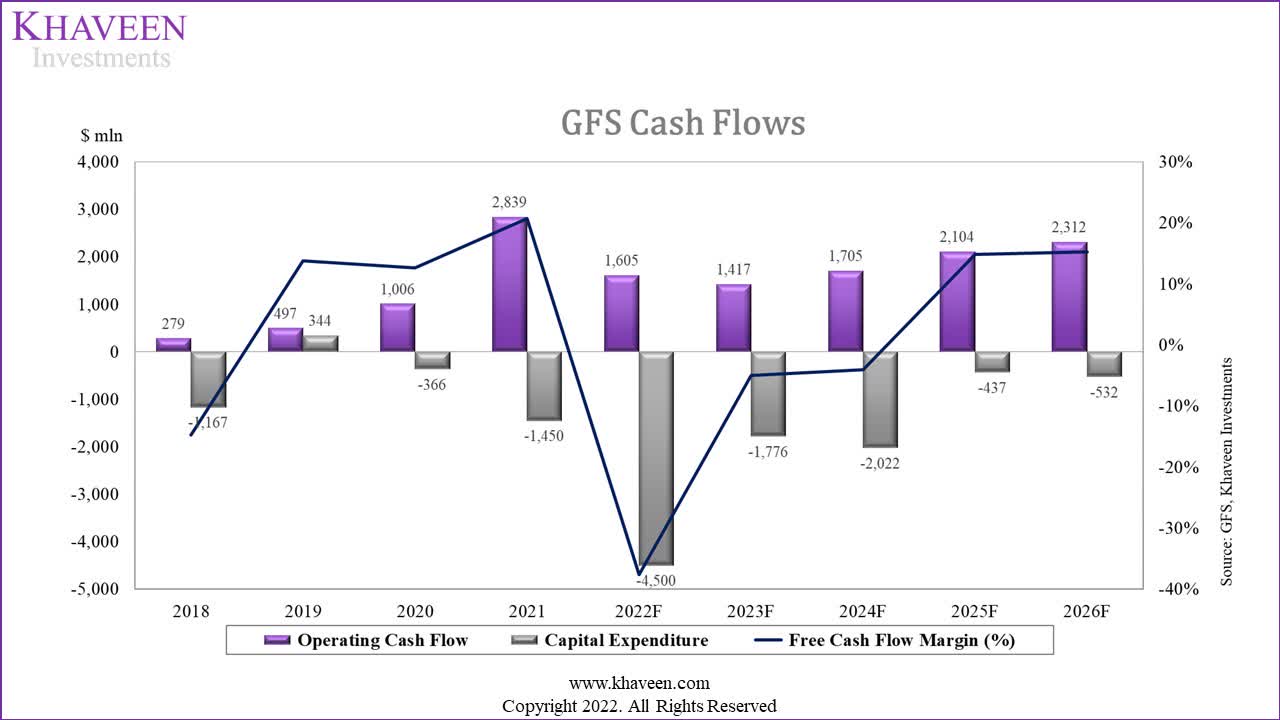
|
FCF Forecast ($ mln) |
2021 |
2022F |
2023F |
2024F |
2025F |
2026F |
|
Operating Cash Flow |
2,839 |
1,605 |
1,417 |
1,705 |
2,104 |
2,240 |
|
Capital Expenditure (Without government support) |
-1,450 |
-4,500 |
-1,776 |
-2,022 |
-2,123 |
-2,219 |
|
Free Cash Flow Margin (%) (Without government support) |
20.75% |
-37.60% |
-5.02% |
-3.99% |
-0.99% |
-0.59% |
|
Capital Expenditure (With government support) |
-1,450 |
-4,500 |
-1,776 |
-2,022 |
-437 |
-532 |
|
Free Cash Flow Margin (%) (With government support) |
20.75% |
-37.60% |
-5.02% |
-3.99% |
14.90% |
15.27% |
Source: GlobalFoundries, Khaveen Investments
According to STM, STM and GlobalFoundries will receive
significant financial support from the State of France for the new facility will contribute to the objectives of the European Chips Act.
According to Financial Times, the joint investment is EUR5.7 bln ($5.82 bln) but the government declined to provide specific details of the amount of government support. Assuming the entire investment is funded by the government, we adjusted our previous projection of the company’s capex based on its long-term guidance of 20% of total revenue by reducing the company’s capex by the investment amount (adjusted for GlobalFoundries share). This resulted in a higher and positive FCF margin of 14.9% in 2025 and 15.27% in 2026 compared to -0.99% and -0.59% respectively without government support.
Risk: Lower Government Support
According to a report by the Financial Times, the specific details of the allocation of funding towards the company’s EUR5.7bln investment are not disclosed with pending details to be finalized. If the amount of government support allocation is lower than expected, it would result in a lower FCF margin forecast for the company. Though, as the EU’s Chips Act is worth EUR43 bln, we believe this indicates sufficient government funds to be allocated for the project.
Verdict
|
Valuation |
2024F |
|
Revenue |
10,110 |
|
P/S |
3.52 |
|
Valuation ($ mln) |
35,588 |
|
Shares Outstanding |
539.75 |
|
Price Target |
$65.93 |
|
Current Price |
$58.05 |
|
Upside |
13.6% |
Source: Khaveen Investments
|
Valuation |
Price Target |
Upside |
|
Current Price |
$58.05 |
|
|
Price Target (2022F) |
$60.57 |
4.3% |
|
Price Target (2023F) |
$63.19 |
8.9% |
|
Price Target (2024F) |
$65.93 |
13.6% |
Source: Khaveen Investments
To conclude, as GlobalFoundries announced its planned capacity expansion in partnership with STM, we expect the expansion to boost its supply growth by 5% per year in 2025 and 2026 based on its share of capacity. However, we forecasted its demand growth to be higher than supply growth in 2025 and 2026 and believe its expansion may not be sufficient to meet demand. In terms of FCF margins, we believe the government’s financial support for the project could provide a boost to its FCF margins to 14.9% in 2025 and 15.27% in 2026. Overall, we updated our valuation of the company with a lower target price of $60.57 which represents an upside of 4.3% with an updated foundry industry P/S average of 3.52x and rated it as a Hold.
Be the first to comment