

Andranik Hakobyan
“Real” GDP – adjusted for inflation and seasonality – rose by an annualized rate of 2.6%, after two quarters of declines, according to the Bureau of Economic Analysis on Thursday.
On the positive side: Consumers, still flush with money and pumped up by rising incomes and very low unemployment, continued to outspend this raging inflation. Non-residential fixed investment rose. And after having dropped for six quarters in a row, government consumption expenditure and investment rose.
On the negative side: Residential fixed investment plunged for the sixth quarter in a row.
Q3 not as good as it looks, Q1 not as bad as it looked: What really moved the GDP needle was the reversal of the “freak event” that had sunk GDP in Q1, when net exports had collapsed by a historic amount. At the time, it was clear that it would reverse, and so I mused in May: “That Q1 GDP Drop Was a Freak Event that’ll Get Unwound in Q2”; well, only part of that freak event got unwound in Q2, and the huge remaining part got unwound in Q3, plus some, and pushed up Q3 GDP by a good margin.
“Real” GDP, after dipping in Q1 and Q2, more than fully recovered in Q3 and eked out a new record of a seasonally adjusted annual rate of $20.0 trillion, expressed in 2012 dollars.
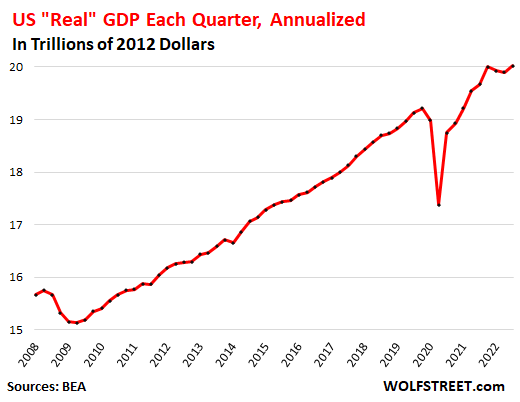
Not adjusted for raging inflation, GDP jumped by 6.7% to a seasonally adjusted annual rate of $25.7 trillion. This is in “current dollars” not “2012 dollars,” and roughly represents the actual size of the US economy in a 12-month period.
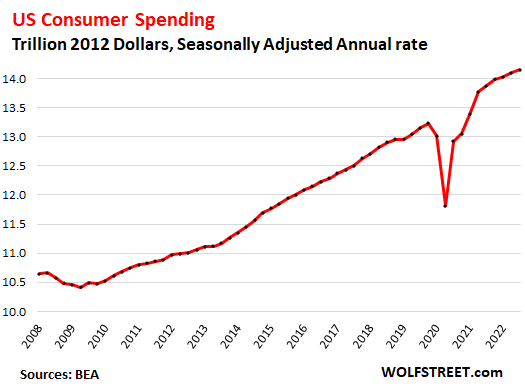
Consumer spending, adjusted for inflation, grew by a somewhat feeble but still respectable – given the circumstances of the raging inflation – annual rate of 1.4% in Q3, after the 2.0% growth in Q2 and 1.3% growth in Q1. This was well below the normal growth range between the Great Recession and the pandemic. But back then, inflation wasn’t as much of a problem.
The share of consumer spending as a percent of GDP dipped to 70.7%, but still above the pre-pandemic range of 68-69%, as other factors in GDP aren’t fully pulling their weight yet.
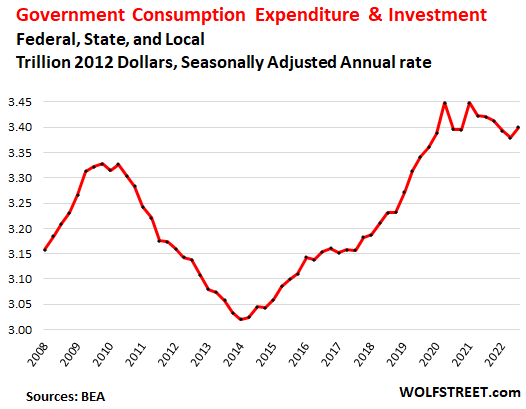
Government consumption and investment rose by 2.4% (adjusted for inflation and annualized) after five quarters in a row of declines.
Federal government: +3.2%, after five quarters in a row of declines:
- National defense: +4.7%.
- Nondefense: +2.3%.
State and local government: +1.7%, after three quarters in a row of declines.
Government consumption and investment does not include salaries paid to government employees, transfer payments to consumers (stimulus payments, unemployment payments, Social Security payments, etc.), and other direct payments to consumers. Those payments enter GDP when consumers and businesses spend or invest this money.
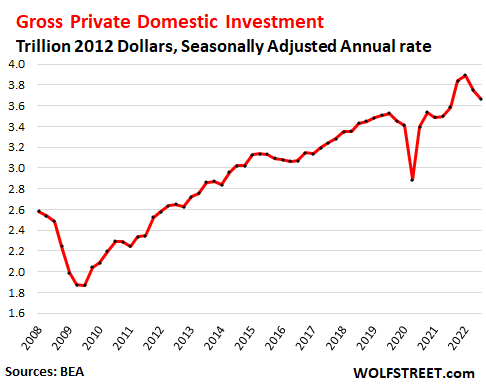
Gross private domestic investment plunged by 8.5% (adjusted for inflation, annualized), the second quarter in a row of sharp declines, after a huge surge in 2021:
- Non-residential fixed investments: +3.7%:
- Structures: -15.3%, sixth quarterly decline in a row.
- Equipment: +10.8%.
- Intellectual property products (software, etc.): +6.9%, ninth big increase in a row.
- Residential fixed investment: -26.4%, the second plunge in a row after smaller drops before.
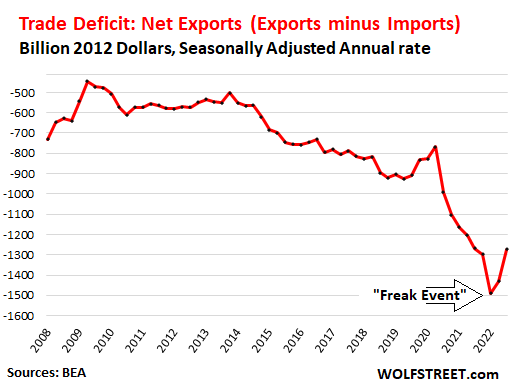
The Trade Deficit in goods & services improved by $156 billion, after the $58 billion improvement in Q2, more than completely reversing the “freak event,” as I had called it, in Q1 (-$191 billion), all in 2012 dollars, annualized.
Exports add to GDP, imports subtract from GDP. And “Net Exports” (exports minus imports) have been a negative factor in the GDP calculations for decades, as exports rose some, while imports worsened year after year as Corporate America went on an all-out no-holds-barred campaign to “globalize” production to other countries. Additionally, in recent years, overseas vendors have been able to sell directly to US consumers via internet platforms, by passing Corporate America altogether.
During the pandemic, Americans binged on buying goods with the cash they got from everywhere, and many of these were imported, and the trade deficit blew out. Over the past year, consumers have been shifting their spending from goods back to services, and imports got less terrible.
In Q3, imports fell by 6.9%, while exports jumped by 14.4%, driven by exports of petroleum products, capital goods, and financial services:
Editor’s Note: The summary bullets for this article were chosen by Seeking Alpha editors.
Be the first to comment