

Here are a few Charts and Notes for the GBPUSD
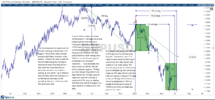
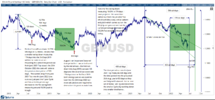
In the diagram below I have outlined the previous Cycles of 2018 and 2019 and compared these swings against the current position of the market . The 2018 swing ran down 120 Deg between point A-B making Low on the 29th June then up till the 9th July then declining into the 15th August for final Low . It is interesting to note in both cases the June Lows were all broken before trading lower into August and Sept Lows . The current swing down into the 15th June Low measures 153 days which is 32 days longer than the 121 day period so we have overbalanced time against this swing .
The second swing of 2019 is quite interesting as it measures 173 days from A- B which lines up against the projected time period of 174 days into the 7th July Low so the two swings will balance into this date so we could be looking at a Low into this date but it would be wise to wait for this date to approach and a few days beforehand we can qualify this point as either Top or Bottom as we move into it but at this point the technical indications are pointing towards a Low on the 7th July then up till the 15th July for counter trend Top then down till August 11th for main Low. We had Low on the 15th August 2018 which is quite close to our target date . The current swing down has declined 12.77% so in percentage terms we have overbalanced the 2019 swing of 10.64% but we will match the time period into the 6th July projected Low . Please see the two Curves presented below .

Be the first to comment