

Sterling (GBP) and FTSE 100 News, Prices and Analysis:
- GBP/USD may set a new multi-decade low.
- FTSE back below 5,000, Sterling weakness providing only minor support.
British Pound (GBP) Continues to be Driven by Headline Risk
GBP/USD starts the week just above 1.1600, weighed down by increasing negative coronavirus headlines. The UK government has warned that a lockdown in London may be required to enforce social distancing requirements, and this seems highly likely now. Financial markets are taking little notice of the extreme central bank and government liquidity measures and instead are focusing on the daily coronavirus infection and fatality data. At the last count there were nearly 5,700 confirmed cases of the virus in the UK with 281 fatalities.
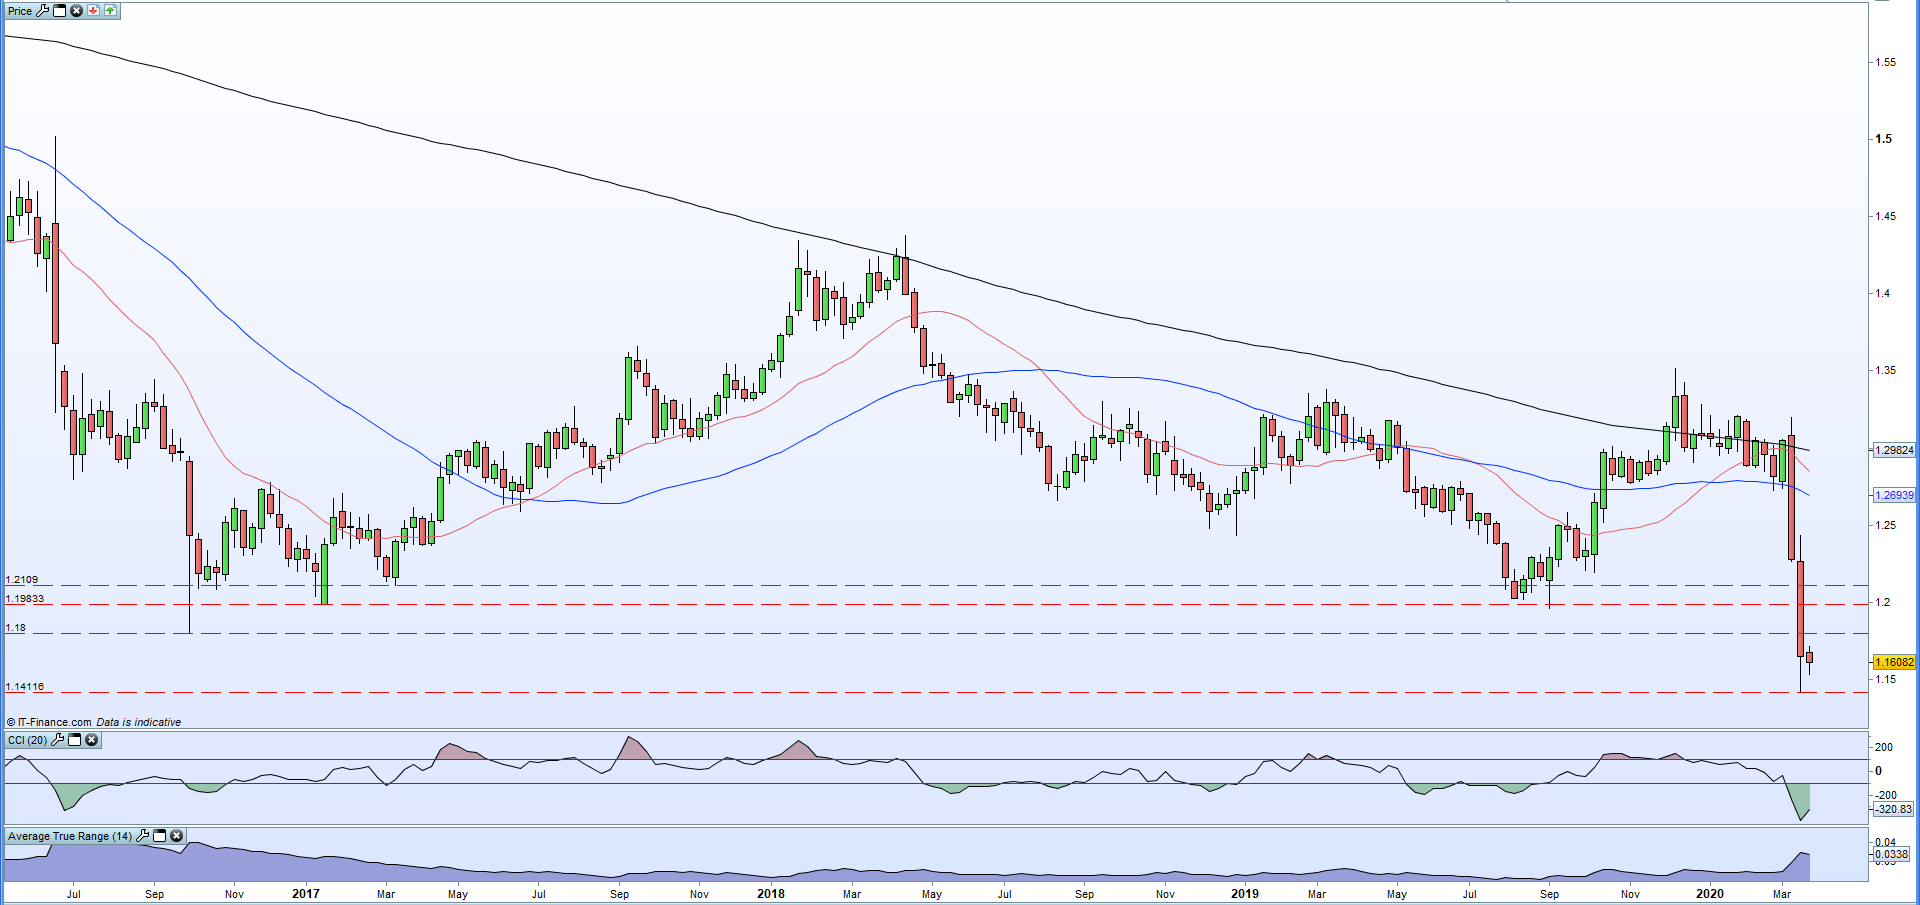
The weekly GBP/USD chart shows little in the way of any support at the moment, while last week’s low print of 1.1412 – the lowest level since 1985 – stands out. GBP/USD did rally sharply last week to trade just below 1.2000 and another move like this cannot be ruled out entirely, especially with volatility at extreme levels. Trading headline risk is impossible, and traders need to carefully consider the risk/reward of any trade in the current environment.
Market volatility remains at multi-year extremes and traders should know how to handle these conditions before making any decisions. DailyFX have a wealth of risk management and discipline resources available to help guide traders through these volatile times.
Becoming a Better Trader – How to Videos.
The DailyFX Online Trading Universityalso has 1000s of updated articles covering all aspects of trading.

Recommended by Nick Cawley
Download our Q1 Sterling Forecast
GBP/USD Weekly Price Chart (January 2017 – March 23, 2020)
| Change in | Longs | Shorts | OI |
| Daily | 10% | 57% | 20% |
| Weekly | 5% | 38% | 13% |
FTSE 100 Gaining Little Benefit from Sterling’s Weakness
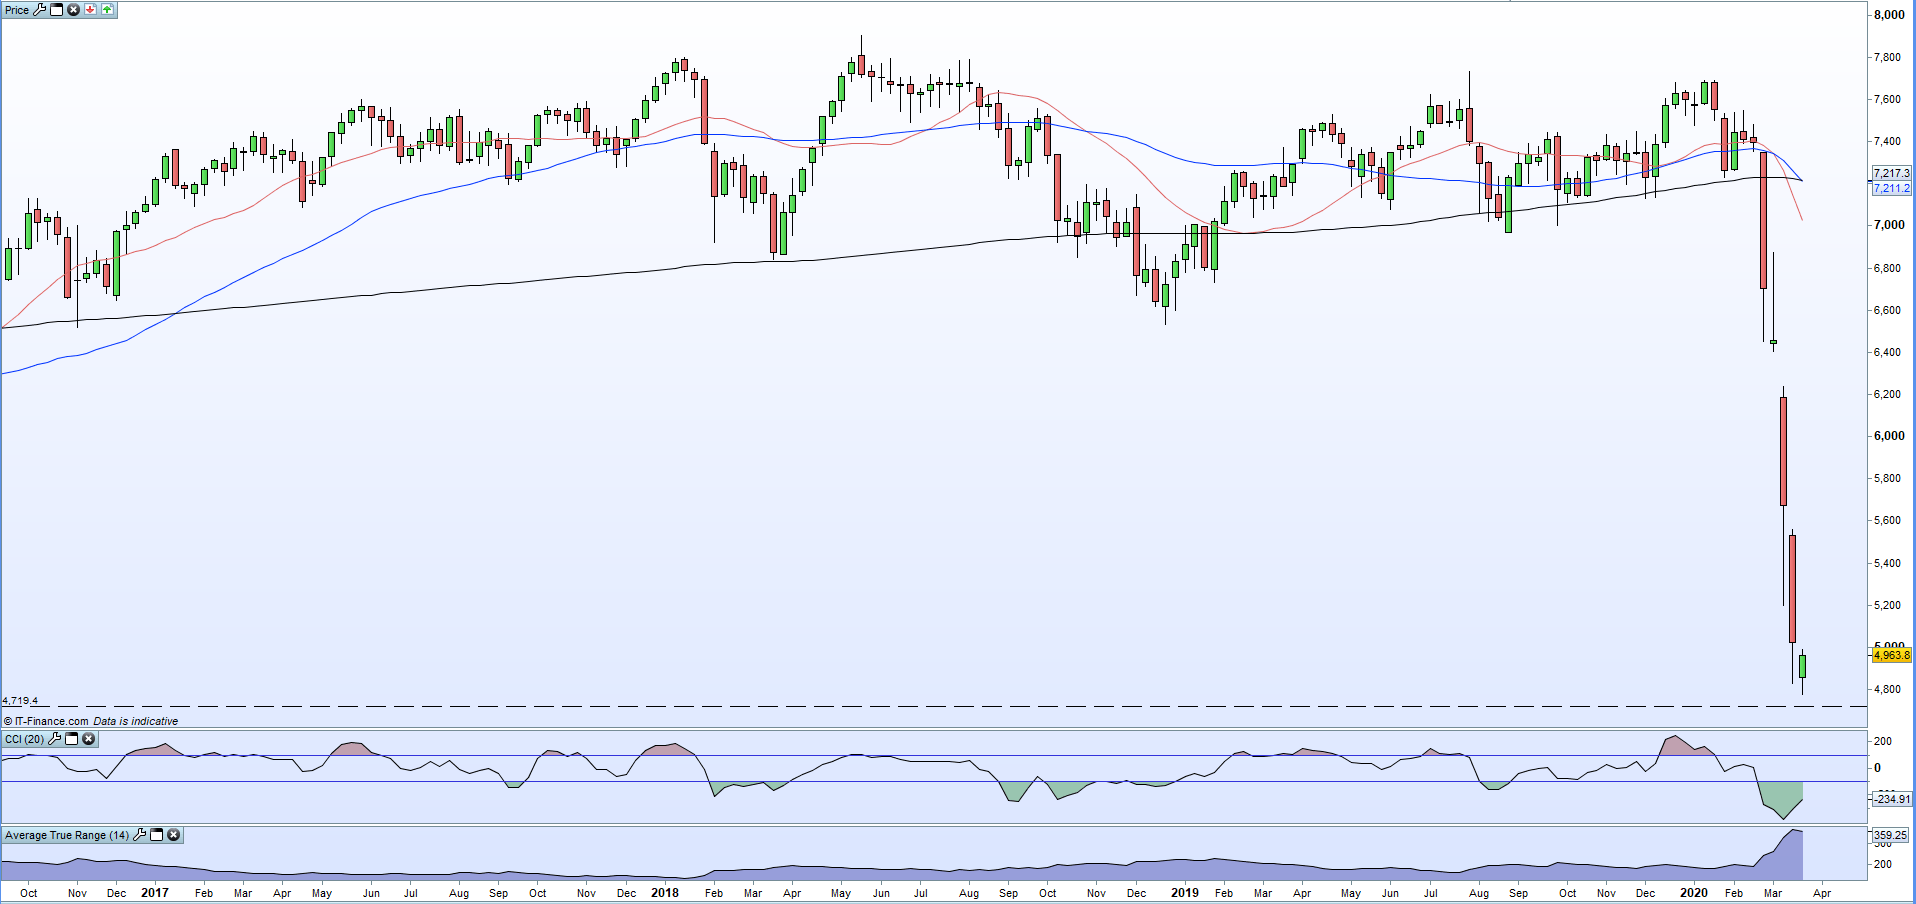
Another chart that trades at a multi-year low and is deep in a bear market. Equities have seen little to no sustained uptick on recent central measures and if the situation worsens, the UK government may need to take a leaf out of Japan’s book and intervene in the equity market to prevent further losses. The weakness of Sterling is helping exporters but with global trade crumbling, this effect is wearing off quickly.
FTSE 100 Weekly Price Chart (September 2016 – March 23, 2020)
Traders may be interested in two of our trading guides – Traits of Successful Traders and Top Trading Lessons – while technical analysts are likely to be interested in our latest Elliott Wave Guide.
What is your view on Sterling (GBP) and the FTSE – bullish or bearish?? You can let us know via the form at the end of this piece or you can contact the author via Twitter @nickcawley1.
Be the first to comment