

GBP/USD started a fresh increase above the 1.3800 resistance. GBP/JPY seems to be facing a major resistance near the 152.20 and 152.30 levels.
Important Takeaways for GBP/USD and GBP/JPY
· The British Pound traded as low as 1.3727 before it started a fresh increase against the US Dollar.
· There was a break above a major bearish trend line with resistance near 1.3800 on the hourly chart of GBP/USD.
· GBP/JPY topped near 152.65 and started a downside correction.
· There is a short-term bullish trend line forming with support near 152.00 on the hourly chart.
GBP/USD Technical Analysis
This past week, the British Pound saw a drop below the 1.3820 level against the US Dollar. The GBP/USD pair even broke the 1.3800 and 1.3750 support levels.
It traded as low as 1.3727 on FXOpen before it started a fresh increase. There was a steady increase above the 1.3750 resistance level. The price surpassed the 1.3800 resistance level and the 50 hourly simple moving average.
There was also a break above a major bearish trend line with resistance near 1.3800 on the hourly chart of GBP/USD. The pair even climbed above 1.3850 and retested the 1.3880 resistance.
A high is formed near 1.3888 and the pair is now correcting gains. It traded below the 23.6% Fib retracement level of the recent wave from the 1.3727 low to 1.3887 high. An immediate support is near the 1.3825 level and the 50 hourly simple moving average.
The next major support is near the 1.3810 level. The 50% Fib retracement level of the recent wave from the 1.3727 low to 1.3887 high is also near 1.3807. If there is a break below the 1.3800 support, the pair could test the 1.3278 support.
If there are additional losses, the pair could decline towards the 1.3720 level. On the upside, the pair is facing a major resistance near the 1.3880 and 1.3900 levels. A clear break above the 1.3900 resistance could increase the chances of a move towards the 1.4000 resistance.
GBP/JPY Technical Analysis
The British Pound gained pace above the 152.30 zone against the Japanese Yen. However, the GBP/JPY pair failed to clear the 152.65 zone and it started a downside correction.
The pair declined below the 152.30 and 152.20 support levels. It even spiked below the 152.00 level, but it is stable near the 50 hourly simple moving average. It traded as low as 151.90 and it is now struggling to recover.
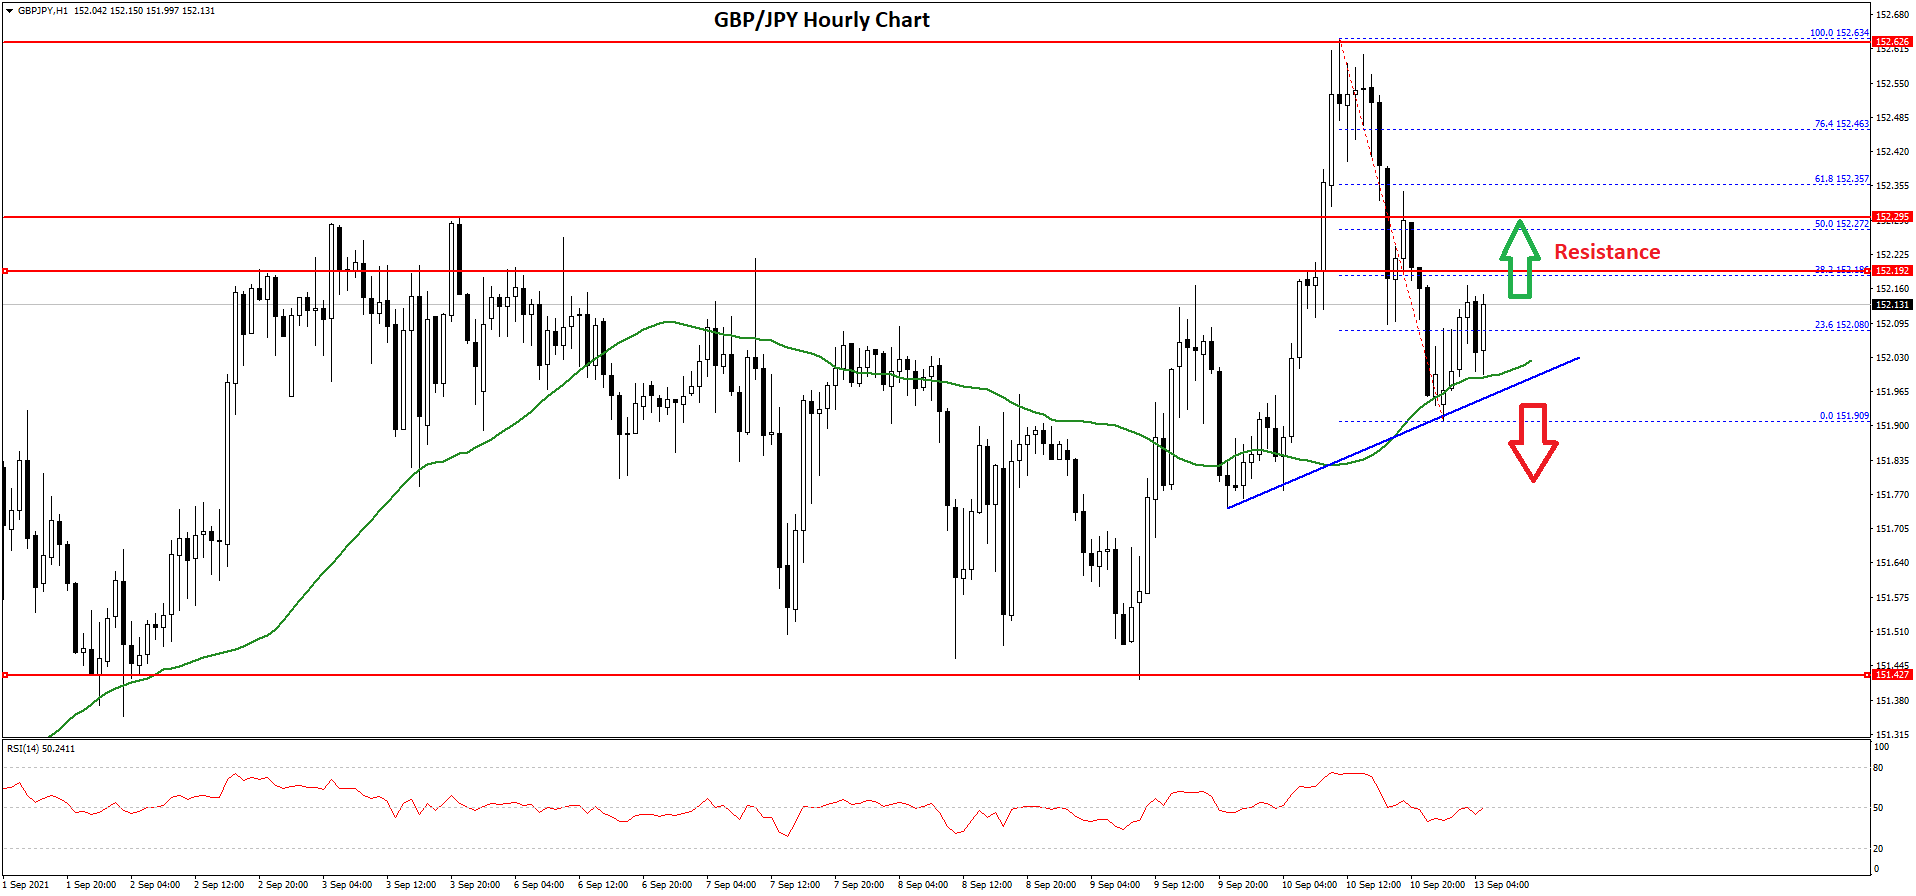
An initial resistance on the upside is near the 152.20 zone. It is near the 38.2% Fib retracement level of the recent decline from the 152.63 high to 151.90 low.
The next key resistance could be 152.30 or the 50% Fib retracement level of the recent decline from the 152.63 high to 151.90 low. A clear break above the 152.30 resistance could push the pair towards the 152.65 resistance.
Any more gains could lead the pair towards the 153.20 resistance zone in the near term. On the downside, an initial support is near the 152.00 level and the 50 hourly simple moving average.
There is also a short-term bullish trend line forming with support near 152.00 on the hourly chart. If there is a downside break below the trend line support, the pair could accelerate lower towards the 151.50 level. The next major support is near 151.20.
This forecast represents FXOpen Markets Limited opinion only, it should not be construed as an offer, invitation or recommendation in respect to FXOpen Markets Limited products and services or as financial advice.

Be the first to comment